Older women’s wealth: Still coming up short (original) (raw)

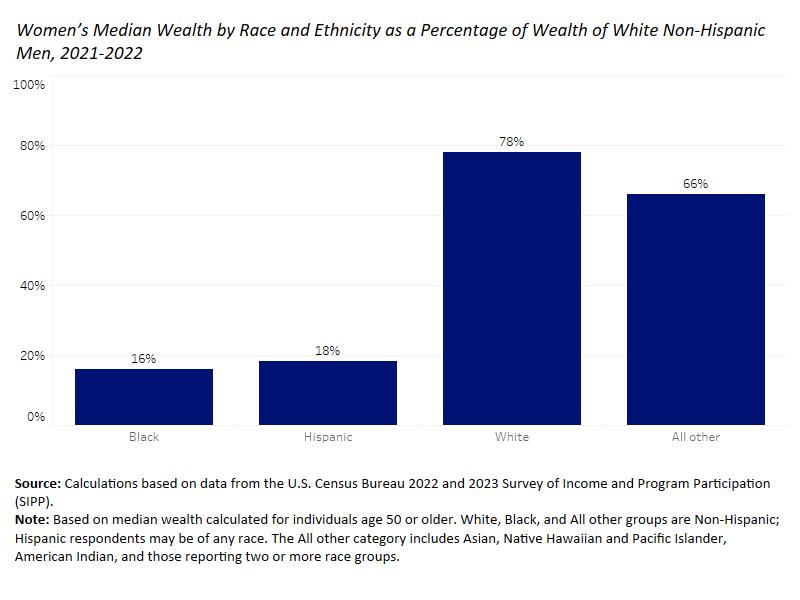
New research from the Women’s Bureau shines a spotlight on the vast gender and racial gaps in wealth among people approaching or at retirement age in the U.S. Among people who are 50 or older, Black and Hispanic women have less than one-fifth the wealth of comparable white non-Hispanic men (16% and 18%, respectively). Non-Hispanic white women have a wealth level that is 78% as high as men in this age group.

Among everyone who is 50 or older, women have 77 cents in wealth for every dollar of wealth reported by men at the median. For median wealth within this group, white women and men have greater median wealth than Black and Hispanic groups. Black women have 43,994andHispanicwomen43,994 and Hispanic women 43,994andHispanicwomen49,921, compared to 214,201forwhitewomenand214,201 for white women and 214,201forwhitewomenand181,175 for women of all other races.

Median Wealth of Men and Women Age 50 and Older, 2021-2022 - plain text version below
Wealth is a critical indicator of economic well-being and financial security. It includes the total value of all assets, minus debts, and it can serve as a personal safety net in the event of a loss of income from job loss, illness, divorce or other reasons. Moreover, wealth can generate income such as dividends, interest, business profits or rent. Wealth can also be passed down across generations; in fact, the ability to contribute to the financial security of one’s children or grandchildren represents a strong motive to save for many.
The significant gender gap in wealth holdings among people nearing or in retirement reflects the cumulative financial losses shouldered by women across their working lives. Despite passage of the Equal Pay Act of 1963, which prohibited wage discrimination on the basis of sex, six decades later, women are paid 83 cents for every dollar paid to men among those employed full-time, year round. In addition to being paid less when they are working full-time, women shoulder greater responsibility for family care, which can reduce their time in the labor force, further eroding their earnings and benefits and leading to substantial economic costs.
Given the critical role that lifetime earnings play in later-life wealth, policies aimed to reduce the gender pay gap, such as the pay transparency policies and salary history bans that have been championed by the Biden-Harris administration, can help reduce wealth gaps. Steps to help women obtain and keep jobs in occupations traditionally dominated by men – many of which pay better and offer better benefits than traditionally ‘female’ jobs – can also increase pay and reduce wealth inequality. The Women’s Bureau supports efforts in this area through our grantmaking and technical assistance. Improving family policies, including providing national earned sick time and paid family and medical leave and reducing childcare costs, would help women save more of their earnings or not dip into savings when they must see to their family’s needs. In other words, these support policies would keep women on what Mariko Chang termed the “wealth escalator” – assuring them greater attachment to the labor force and career progression.
There are also numerous policy options that would tweak the present retirement system to better accommodate the distinct needs of older women. Ideas that have been proposed as improvements to Social Security targeting women’s economic security include improving the surviving spousal benefit by providing a benefit equal to 75 percent of the sum of the spouses’ combined worker benefits. To address the fact that women may outlive their retirement savings, legislators could improve the cost-of-living adjustment by adopting the Consumer Price Index for the Elderly (CPI-E), which reflects the typical expenses of older Americans. Another proposal would help protect divorced women by lowering the number of years of marriage required to receive Social Security spousal benefits to five years, down from 10 years currently. Proposals for calculating benefits over 30 rather than 35 years or providing caregiver credits would further support women who need to leave the workforce temporarily to care for children or elderly relatives.
Jeff Hayes is a Survey Statistician at the Women’s Bureau.
Median Wealth of Men and Women Age 50 and Older, 2021-2022 - plain text version
Median Wealth of Men and Women Age 50 and Older, 2021-2022 - plain text version
| Race and Ethnic Group | Women's Median Wealth | Men's Median Wealth | Women's Median Wealth as a Percentage of White Non-Hispanic Men's |
|---|---|---|---|
| Total | 165,691∣165,691 | 165,691∣213,948 | NA |
| White | 214,201∣214,201 | 214,201∣274,376 | 78% |
| Black | 43,994∣43,994 | 43,994∣51,512 | 16% |
| Hispanic | 49,921∣49,921 | 49,921∣84,992 | 18% |
| All other | 181,175∣181,175 | 181,175∣275,411 | 66% |
Source: Calculations based on data from the U.S. Census Bureau 2022 and 2023 Survey of Income and Program Participation (SIPP).
Note: Median wealth calculated for individuals age 50 or older. Amounts shown are in 2023 dollars. Hispanic respondents may be of any race. The All other races category includes Asian, Native Hawaiian and Pacific Islander, American Indian, and those reporting two or more race groups.