Engagement in 2025: Where Social Media Users Are Actually Interacting (original) (raw)
Think you know which social platform has the most engagement? The data might surprise you.
Social media trends are always evolving, but lately, engagement has been shifting in unexpected ways. LinkedIn is seeing record-high interactions, Pinterest is quietly on the rise, and Threads — once a breakout success — is settling into more stable patterns. Meanwhile, Instagram’s engagement is lower than ever, but that doesn’t mean it’s losing relevance.
If you’ve ever felt like social media engagement is unpredictable, you’re not alone. But while platforms and algorithms change, one thing remains the same: understanding the data gives you an edge.
At Buffer, we analyzed millions of posts across LinkedIn, Instagram, Facebook, TikTok, YouTube, X, Threads, and Pinterest to uncover where engagement is thriving, slowing down, and what it all means for your content strategy.
Here’s what we found:
- Which platforms have the highest and lowest engagement rates this year
- How audience behavior is shifting across social media
- What’s behind LinkedIn’s engagement surge and Instagram’s engagement dip
- How to adjust your content strategy based on 2025’s engagement trends
If you want to stay ahead of the curve and make smarter content decisions, this article has the insights you need.
Let’s dive in.
What is engagement rate and why does it matter?
Engagement rate is one of the most important social media metrics — but it’s also one of the most misunderstood.
At its core, engagement rate measures how much people interact with your content relative to how many people see it. It’s not just about visibility — it’s about connection.
For example:
- A post that reaches 10,000 people but gets only a few likes? Low engagement.
- A post that reaches 1,000 people but sparks hundreds of interactions? High engagement.
That’s why engagement rate is one of the strongest indicators of content performance. It tells you:
- How well your content connects with your audience.
- How likely your content is to be amplified by the platform’s algorithm.
- Whether your audience is passive or actively engaging.
The key considerations about engagement rate data
Before we dive into the rankings, here are some key considerations to reflect the nuance of this report:
- Engagement rate ≠ Total engagement volume. Platforms with massive reach — like Instagram — may have lower engagement rates but still drive more total interactions than smaller, higher-engagement platforms like LinkedIn. A 1% engagement rate on Instagram could mean thousands of interactions, while a 6% engagement rate on LinkedIn might result in far fewer total engagements.
- Each platform encourages different behaviors. LinkedIn prioritizes comments and discussions, while Instagram thrives on shares and saves. These behavioral differences mean a 6% engagement rate on LinkedIn doesn’t equate to a 6% engagement rate on TikTok.
- What counts as engagement varies by platform. Saves on Instagram, pins on Pinterest, and comments on YouTube all count as engagement, but they reflect different user behaviors and levels of intent.
- Not all engagement is public. Private interactions — like bookmarks, DMs, and link clicks — aren’t always reflected in engagement rate calculations.
How we calculate engagement rate
At Buffer, we calculate engagement rate using the following formula:
(Total Interactions / Total Impressions) × 100 = Engagement Rate (%)
To provide the most accurate view of engagement trends, we analyze engagement rates in two ways:
- Averages which help us compare platforms at a high level—showing where engagement is strongest overall.
- Medians over time which reveal the story of how engagement is evolving month by month.
Now that we understand what engagement rate really measures — and its nuances across platforms — let’s get into the rankings.
Average engagement rates by platform: Who’s leading the engagement game?
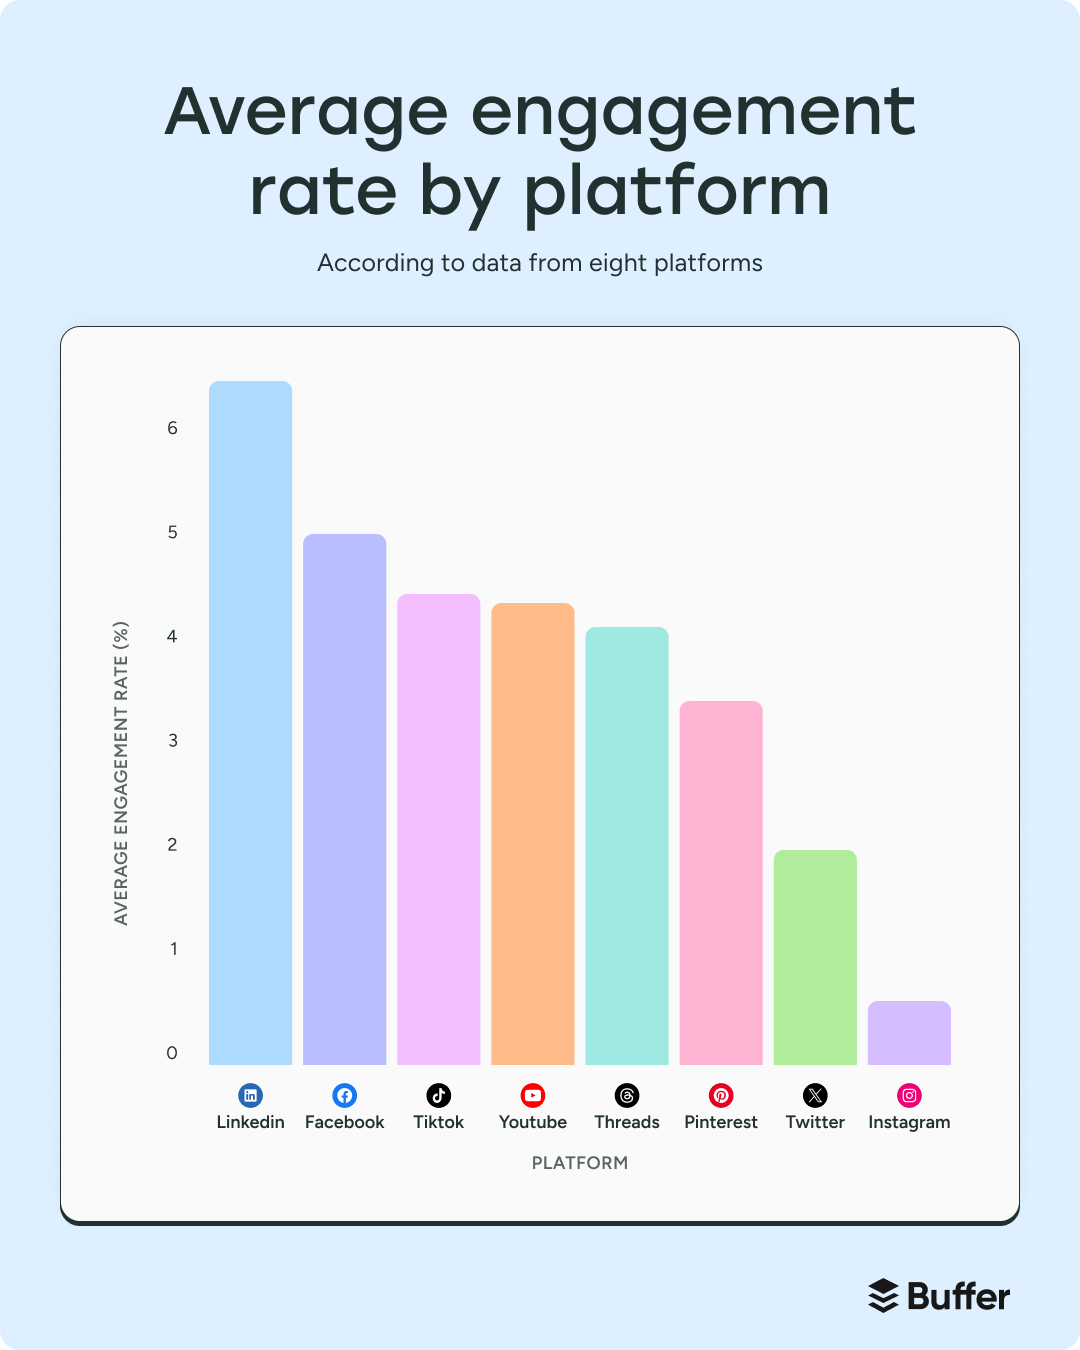
To determine where users are engaging the most, we analyzed average engagement rates across eight major social platforms over a one-year timeframe. Here’s how they stack up:
| Platform | Average Engagement Rate (%) |
|---|---|
| 6.50% 📈 | |
| 5.07% | |
| TikTok | 4.86% |
| Threads | 4.51% |
| YouTube | 4.41% |
| 3.46% | |
| X (Twitter) | 2.31% |
| 1.16% |
At first glance, the average engagement rates across these platforms tell us a few key things:
- LinkedIn is the top performer. With an average engagement rate of 6.50%, LinkedIn has outpaced all other platforms
- Facebook engagement remains steady. At 5.07%, Facebook continues to generate strong engagement
- TikTok ranks higher than YouTube for engagement. With 4.86%, TikTok remains a leader for short-form video, with YouTube not far behind with 4.41%
- Threads has outpaced X/Twitter in engagement. Threads’ 4.51% engagement rate is significantly higher than X’s 2.31%
- Instagram’s engagement rate is the lowest. At 1.16%, Instagram’s engagement is significantly lower than other platforms, though private interactions (DMs, saves) likely contribute to hidden engagement that isn’t captured in public metrics.
Now, while these median numbers provide a broad comparison of which platforms drive the most engagement overall, they don’t capture how engagement has shifted over time.
To understand how engagement is evolving, we decided to look at median engagement rates over the year between January 2024 to January 2025.
Engagement patterns between January 2024 to January 2025
Engagement rates don’t exist in a vacuum. User behavior, algorithm changes, and broader industry shifts all influence how people interact with content.
While the overall median engagement rates tell us which platforms perform best overall, the median engagement rates over time reveal how engagement is changing month by month.
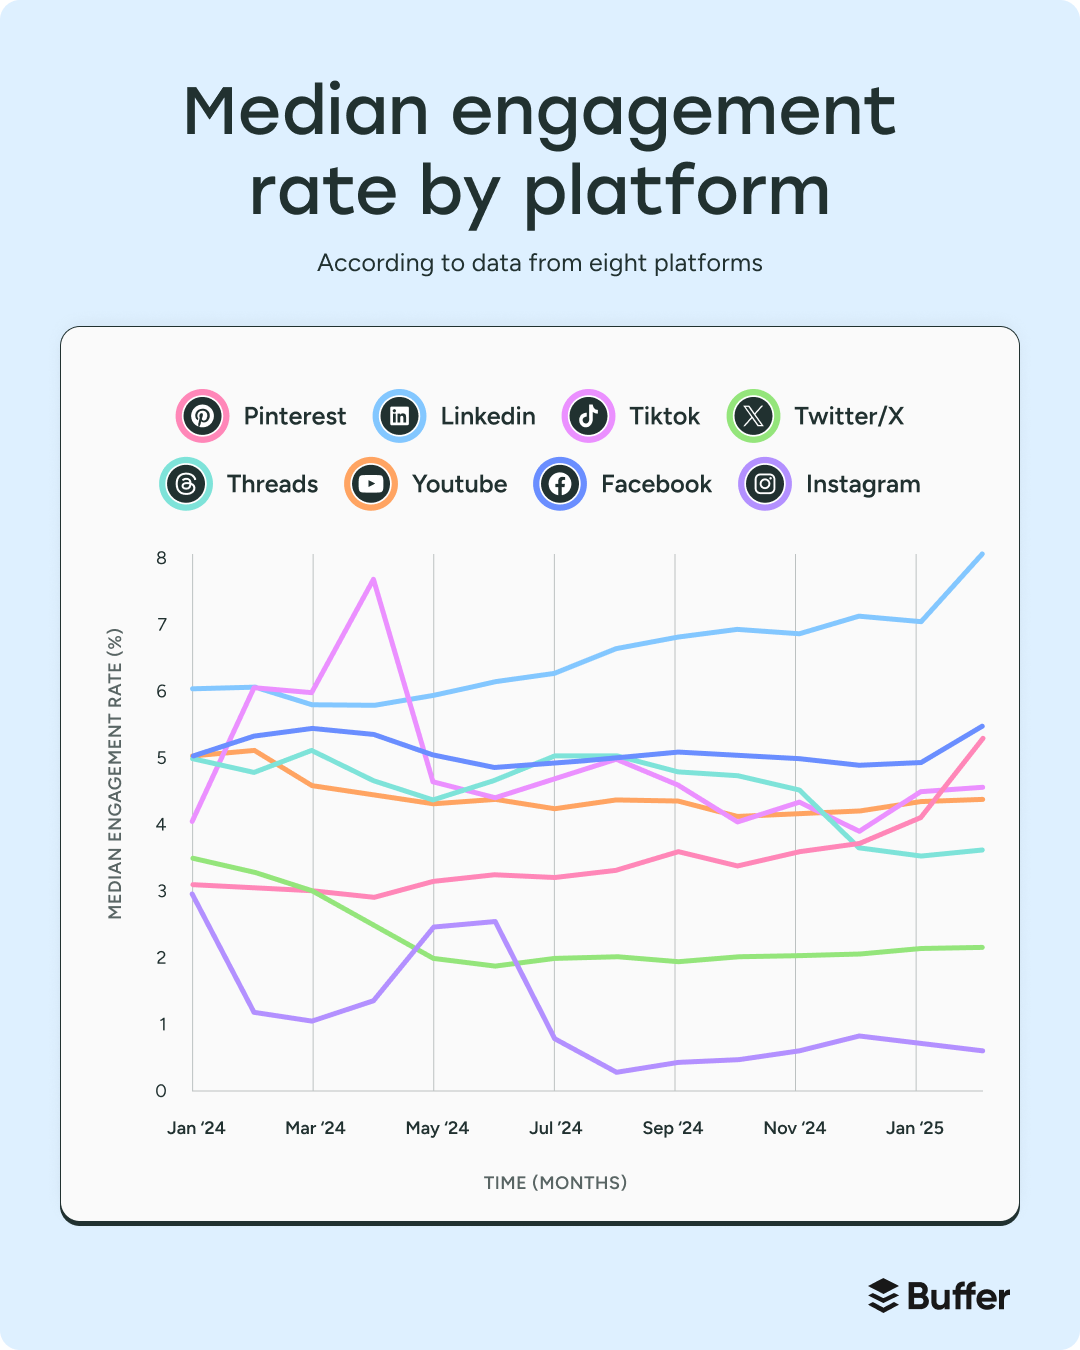
Here’s what we found from analyzing median engagement rates from January 2024 to January 2025.
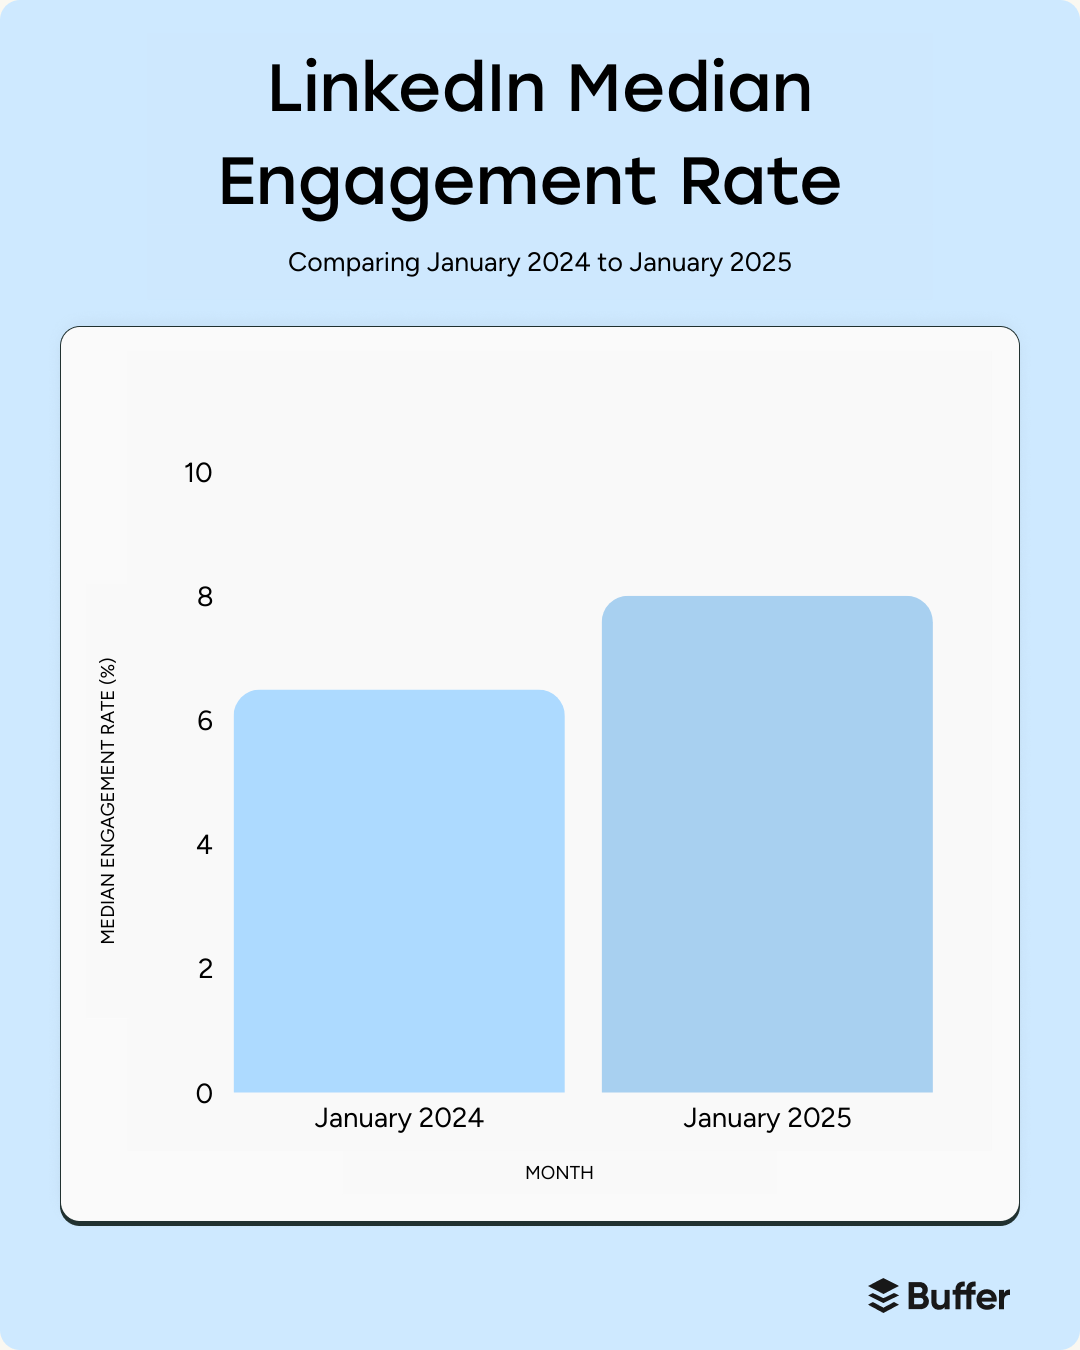
1. LinkedIn’s engagement is steadily rising
With an average engagement rate of 6.50%, LinkedIn leads all platforms, but the real story is its growth over time.
In January 2024, LinkedIn’s median engagement rate was 6.00%. By January 2025, it had risen to 8.01%.
What could be driving this increase?
- Less content saturation = higher visibility. Only 1% of LinkedIn users post regularly, meaning content has less competition and more potential reach.
- The algorithm rewards conversations. Posts with early engagement are boosted to second- and third-degree connections, expanding visibility.
- More diverse content formats are succeeding. Carousels see significant engagement, and the platform just introduced video.
LinkedIn remains the strongest platform for authority-building and organic reach. If you’ve been posting inconsistently, now is the time to lean in.
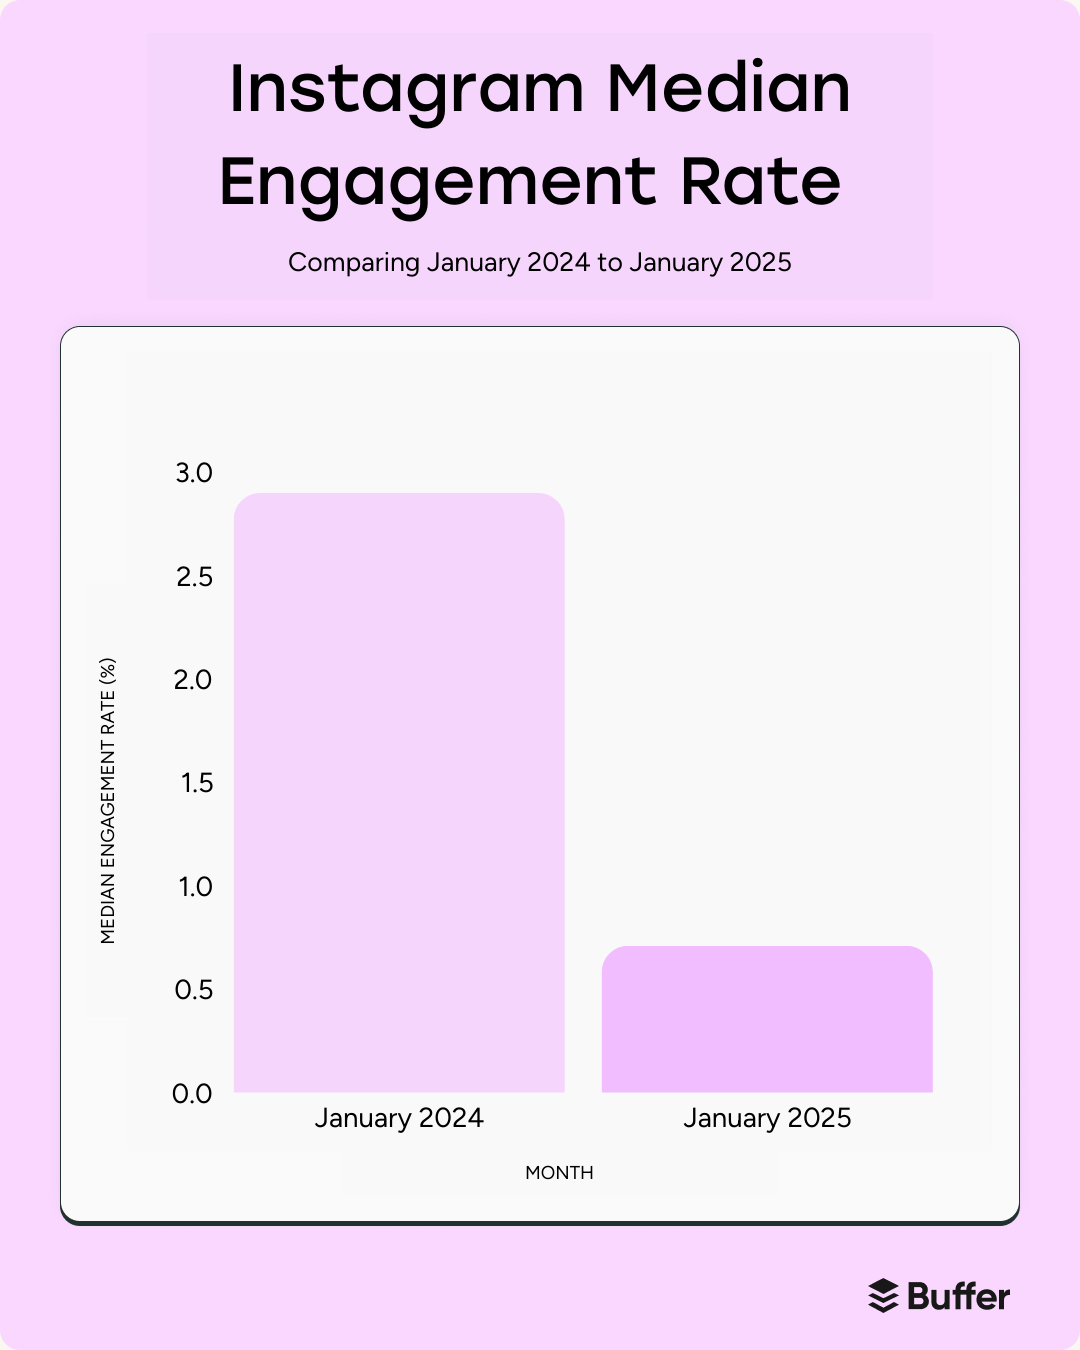
2. Instagram’s engagement is evolving
While Instagram has the lowest average engagement rate (1.16%), its interaction patterns are shifting rather than simply declining.
In January 2024, Instagram’s median engagement rate was 2.94%. By January 2025, it had adjusted to 0.61%.
This change reflects a broader shift in how users engage with content rather than a loss of platform relevance. What’s behind the shift?
- More content is being consumed than ever. With reels and stories dominating, users are watching more but interacting differently — passive engagement is rising, even if likes and comments aren’t as visible.
- Engagement is becoming more private. Saves, DMs, and shares are increasing, but these interactions don’t contribute to public engagement metrics.
- Reels success depends on depth, not just views. High-performing reels tend to spark conversation or encourage sharing, while others may generate views without direct engagement.
Instagram engagement isn’t disappearing — it’s moving behind the scenes. Create saveable content for the algorithm, share your posts with friends, and reply via DM — that’s where real engagement is happening.
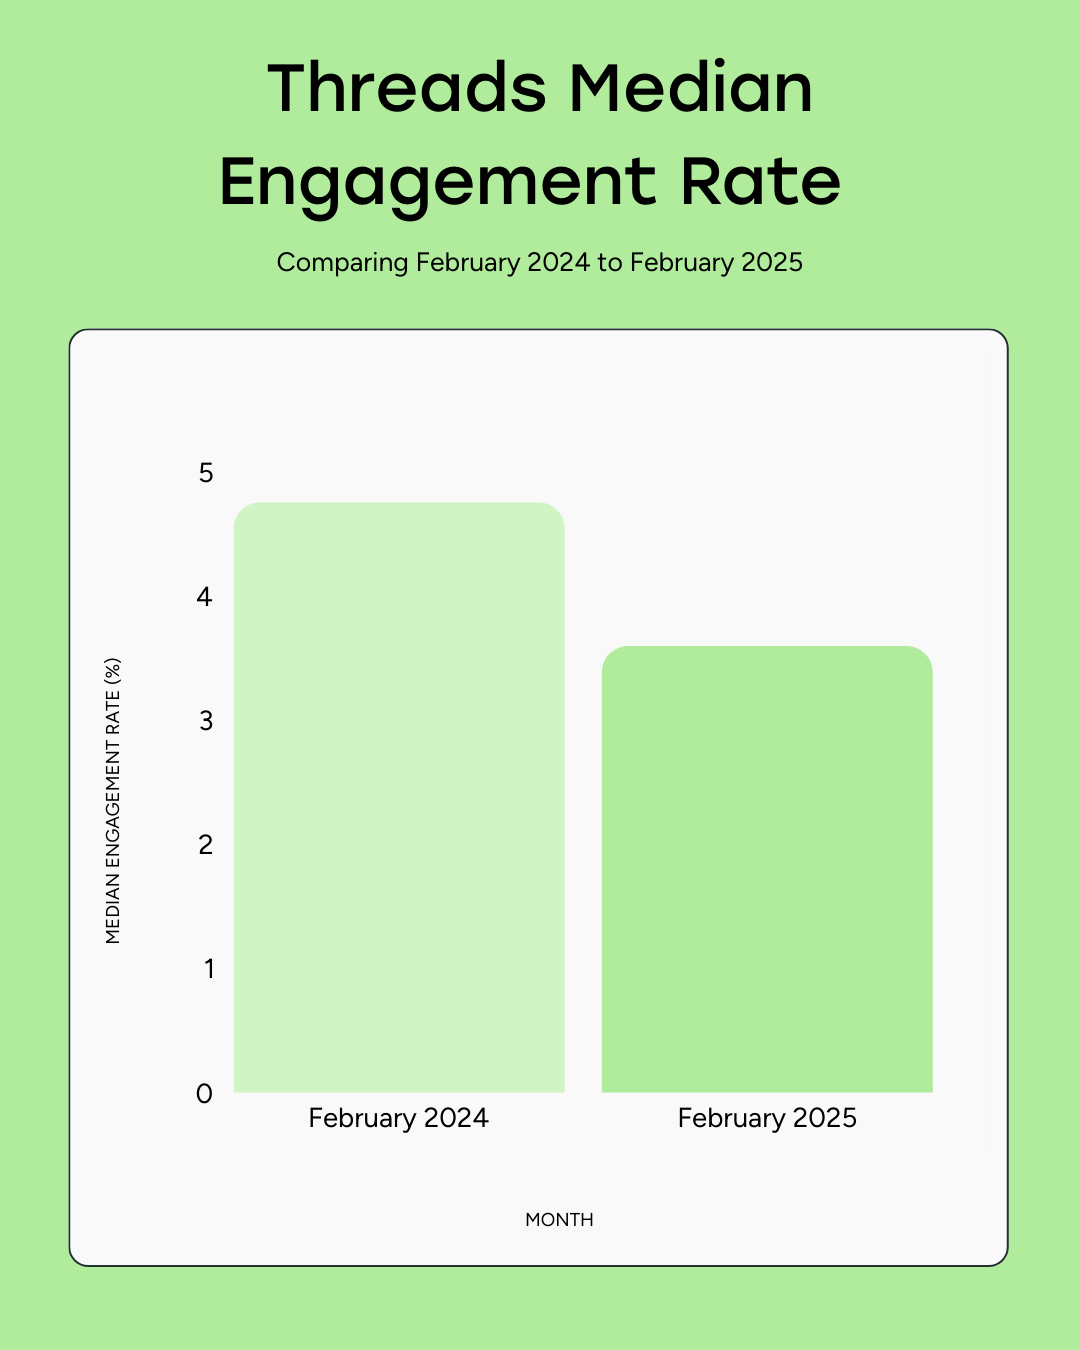
3. Threads’ engagement is stabilizing after an initial surge
Threads launched with high engagement, but its numbers have steadily declined from 4.76% in February 2024 to 3.60% in February 2025. While Threads still outperforms X/Twitter in engagement rate, its growth phase has leveled out.
What’s behind the shift?
- The early adopter effect is fading. When Threads launched, engagement was high as users explored the platform. As more users join, engagement is now spreading out across a larger content pool.
- More content = more competition. Initially, with fewer users posting, content was more visible. Now, as more creators share content, engagement is becoming more distributed.
- **Algorithm shifts are influencing visibility.** Threads started with a purely chronological feed, but Meta has since introduced ranking signals, making engagement less predictable.
Threads remains a high-engagement platform, but success now depends on participation, not just presence. Prioritizing conversations, real-time engagement, and interactive content will help sustain engagement as the platform matures.
💡
We only started collecting engagement data from Threads in February 2024.
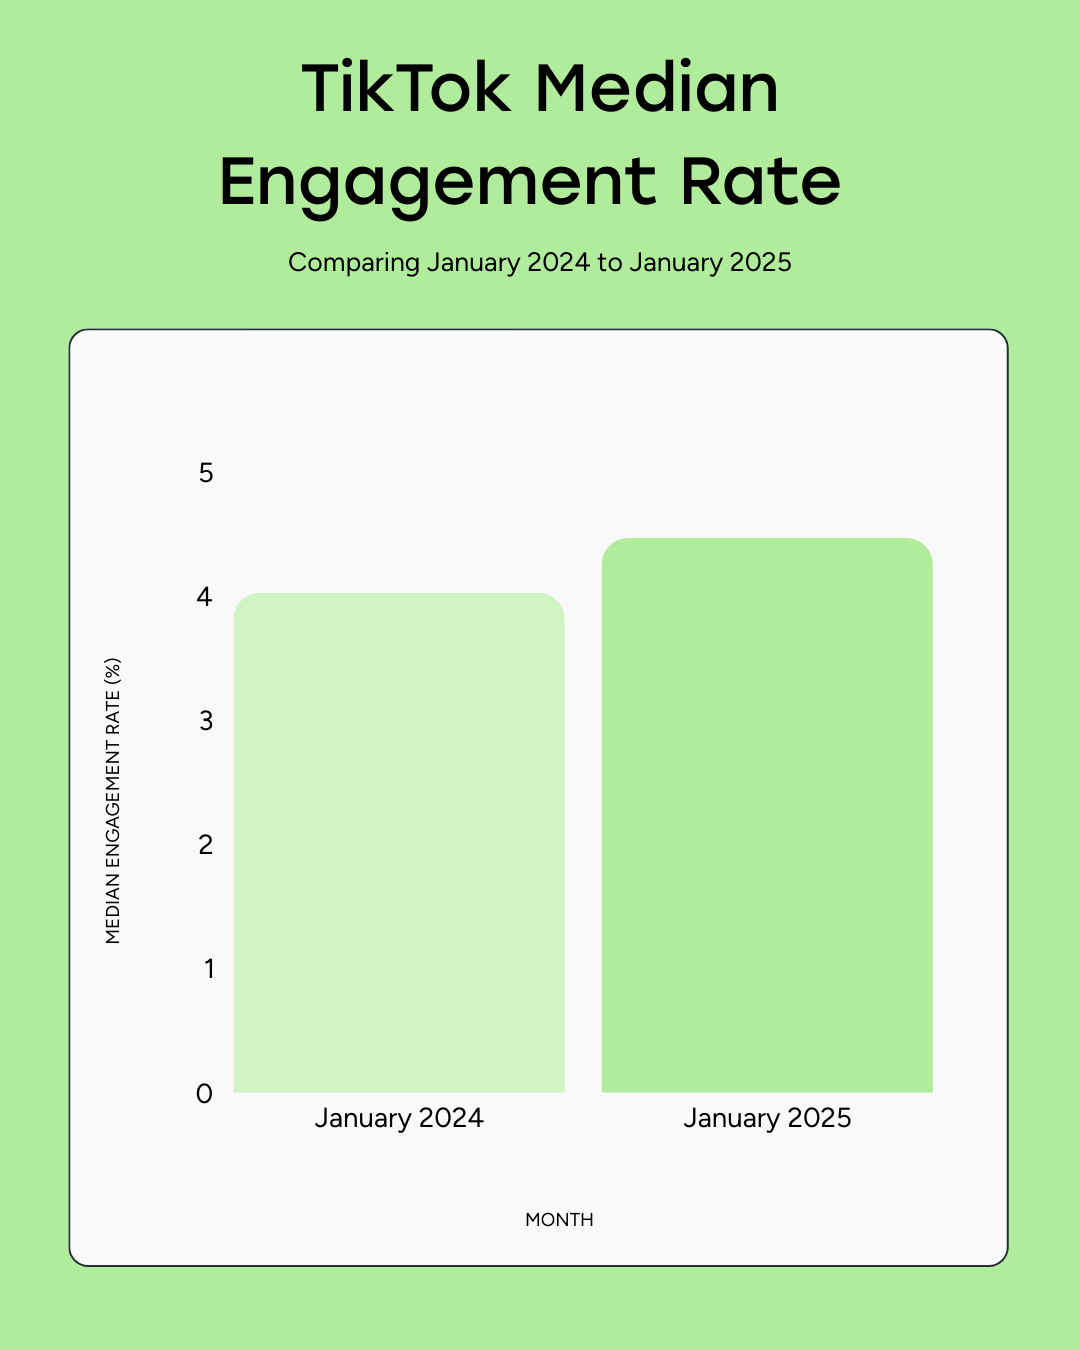
4. TikTok engagement remains high, but patterns are changing
With an average engagement rate of 4.86%, TikTok is still one of the strongest platforms for engagement, but its median engagement rate has gradually declined from 5.14% in January 2024 to 4.56% in January 2025.
What’s behind the shift?
- TikTok’s algorithm is rewarding retention over interactions.** Watch time and replays are now bigger engagement drivers than likes or comments, shifting what “high engagement” looks like on the platform. Pro tip: Keep your videos above 1-minute as we’ve found that longer TikToks perform better in the algorithm.
- Short-form video competition is increasing. With Instagram Reels, YouTube Shorts, and even LinkedIn embracing video, TikTok is no longer the only dominant player in the space.
- More brands and advertisers = more polished content. TikTok’s early success was built on authentic, unpolished content, but as brands ramp up their presence, engagement rates have become less predictable.
TikTok is still a powerhouse for engagement, but the type of engagement that matters is shifting. Focus on content that drives watch time and shares, not just likes and comments.
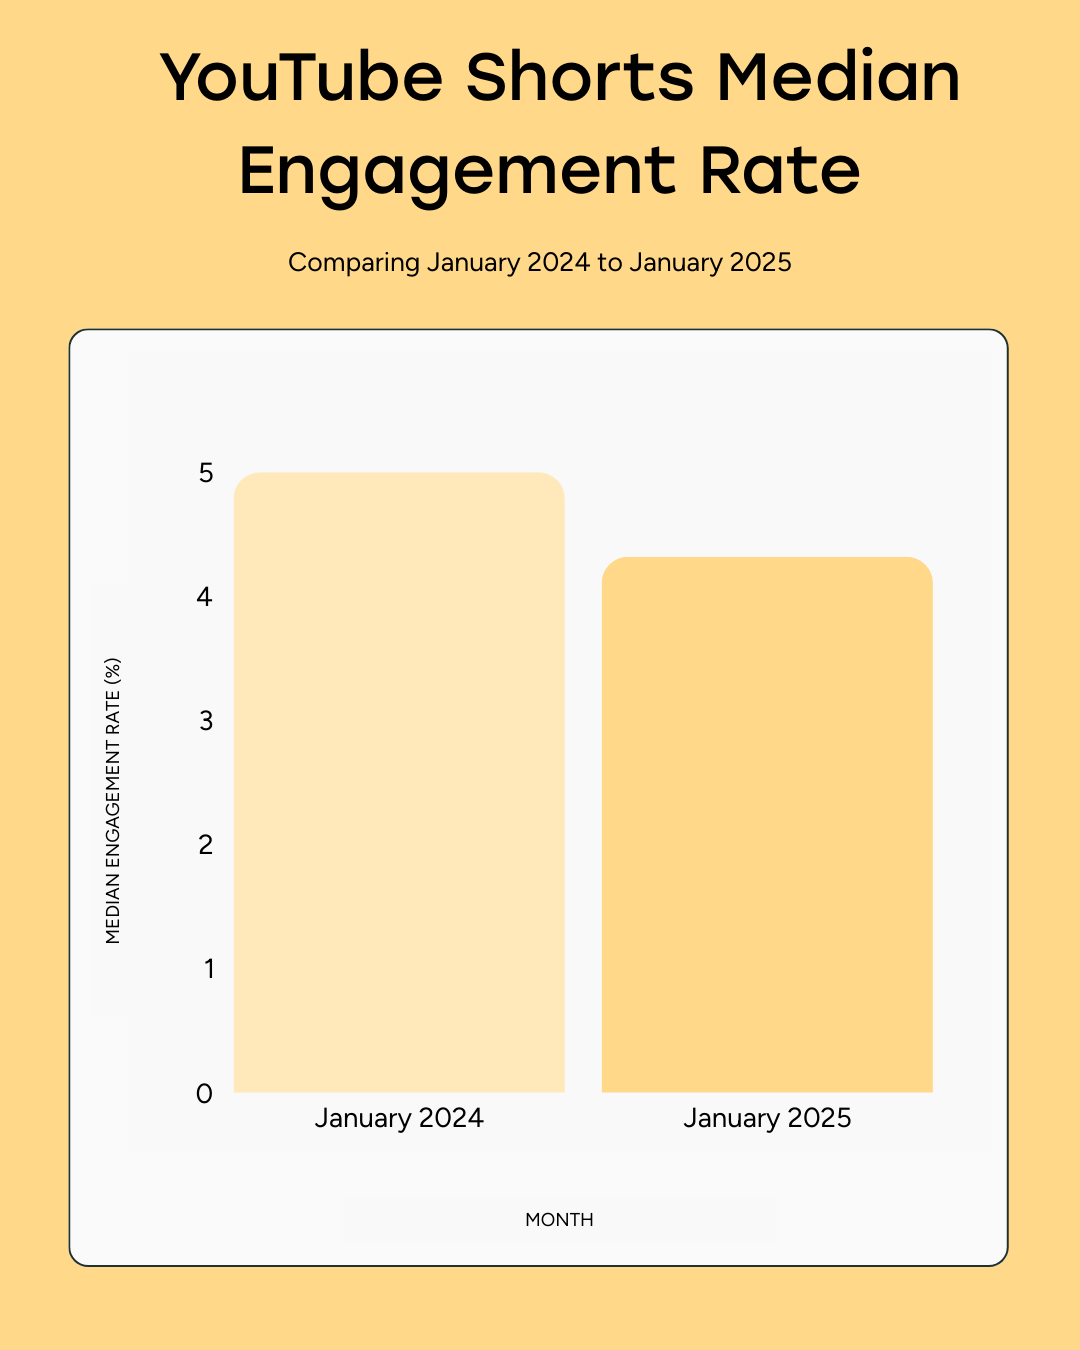
5. YouTube Shorts engagement is catching up to TikTok
YouTube Shorts’ 4.41% average engagement rate puts it just behind TikTok, but its median engagement rate has risen from 3.95% in January 2024 to 4.71% in January 2025.
What’s driving the increase?
- YouTube’s search advantage. Unlike TikTok, YouTube content is discoverable long after posting, meaning shorts have a longer engagement lifespan than TikTok videos.
- Higher audience intent. YouTube users are actively searching for content, while TikTok users are passively scrolling, leading to more engaged viewers on shorts.
- Monetization is attracting creators. With more ad revenue opportunities, creators are investing more in shorts content, leading to higher-quality videos that retain engagement.
YouTube Shorts is becoming a major competitor to TikTok for short-form video. If you’re already creating vertical video content, repurposing it for shorts could extend its lifespan and reach.
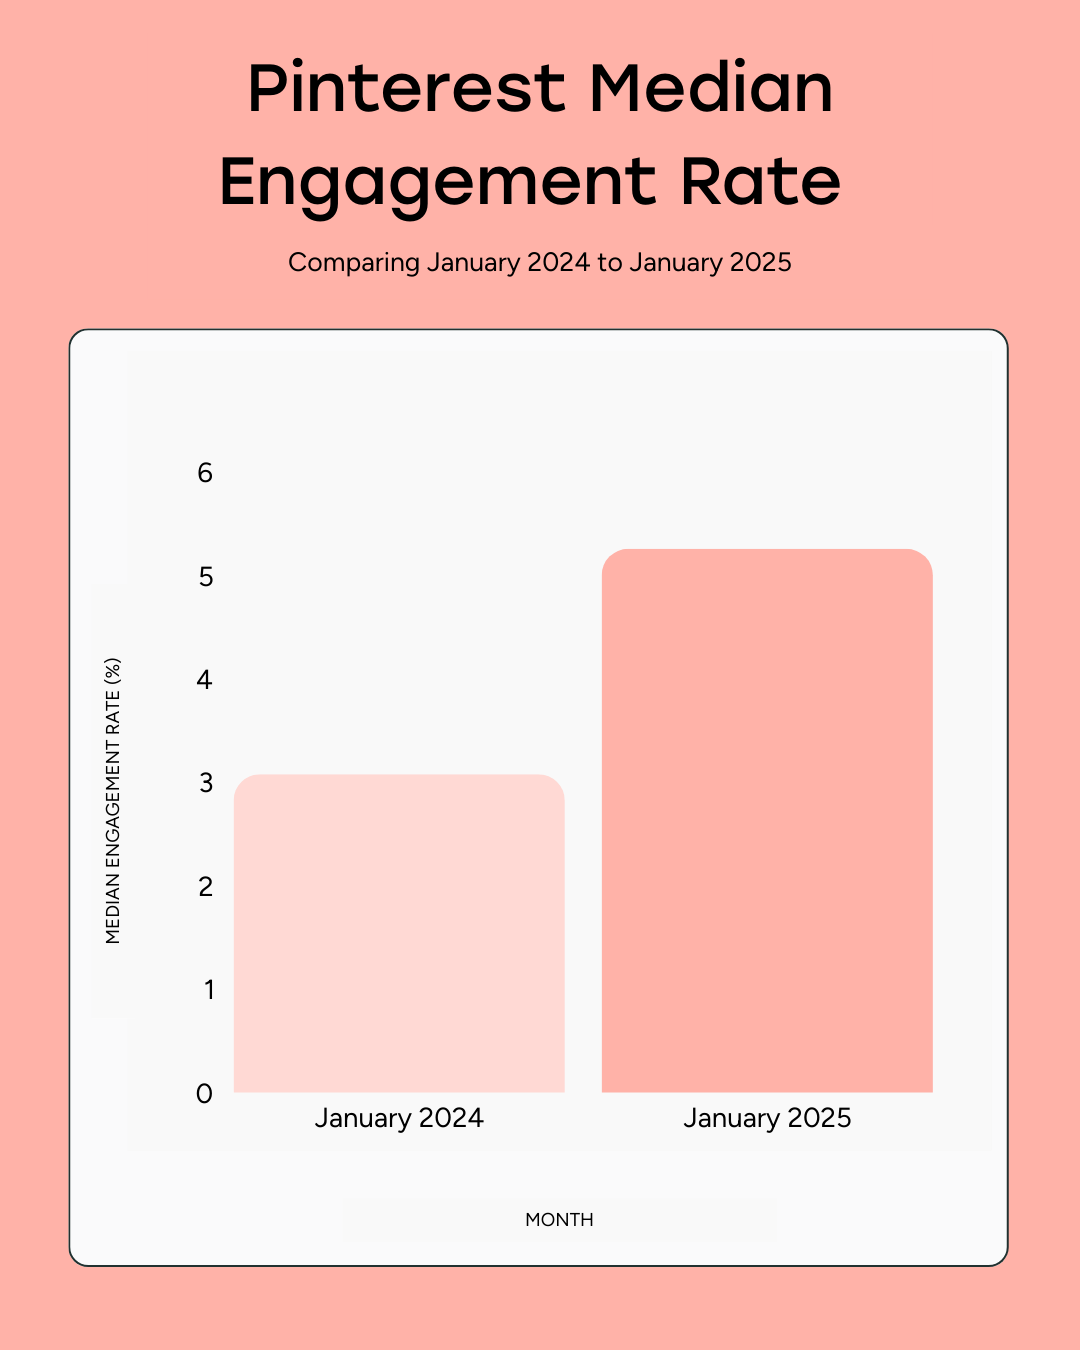
6. Pinterest’s engagement is quietly rising
Pinterest engagement has grown from 3.08% in January 2024 to 5.26% in January 2025, making it one of the strongest platforms for long-term engagement.
Why is Pinterest growing?
- It’s a search-driven platform, not a feed-based one. Unlike TikTok or Instagram, Pinterest users actively seek out content, meaning engagement is more intentional than passive scrolling.
- Pins have a long shelf life. A single Pin can generate engagement for months or even years, unlike Instagram posts that disappear quickly.
- More users are treating Pinterest like a search engine. As Google’s search algorithms shift, more users are turning to Pinterest for inspiration and discovery.
If you create evergreen content — such as guides, tutorials, and infographics — Pinterest offers long-term engagement potential. Unlike other platforms where content fades quickly, your content on Pinterest can drive engagement long after you post it.
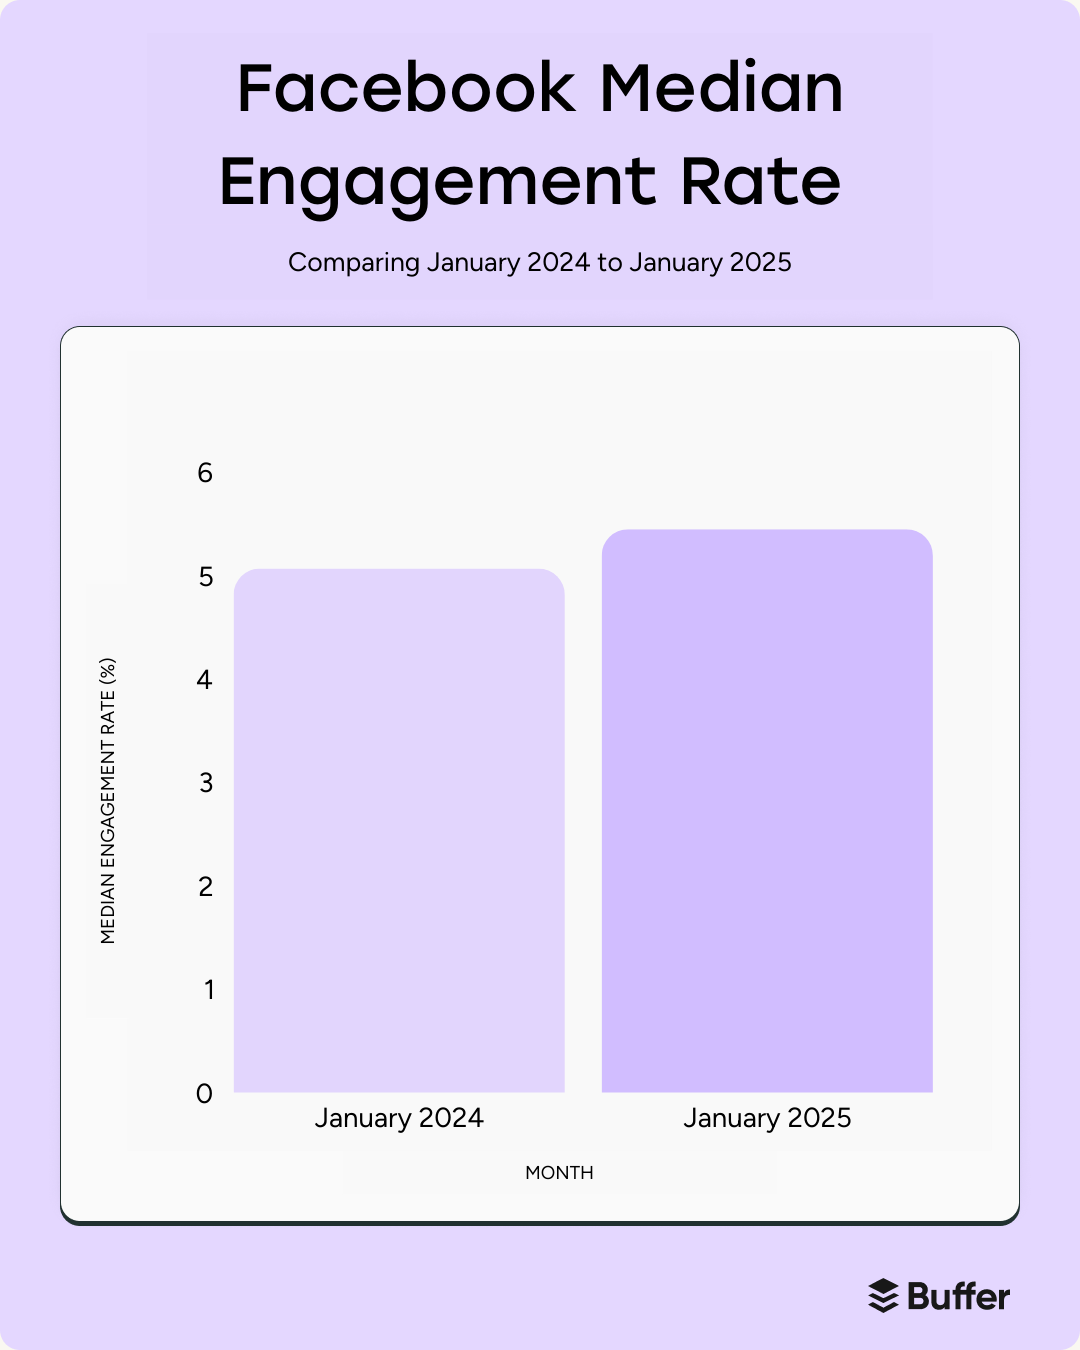
7. Facebook’s engagement remains steady despite changes
Facebook’s 5.07% average engagement rate is strong, and its median engagement rate has remained stable at around 5.45% over the past year.
Why is Facebook engagement holding steady?
- Facebook Groups continue to drive strong engagement. Unlike brand pages, niche Groups see some of the highest interaction rates on the platform.
- Meta is investing in new monetization tools. Features like subscriptions, Facebook reels monetization, and ad revenue sharing are keeping creators active.
- Facebook’s demographic is highly engaged. While younger audiences gravitate toward TikTok and Instagram, Facebook’s core user base (ages 30+) remains actively engaged.
Facebook remains a high-value platform for community-driven engagement — especially if you leverage Groups and interactive content.
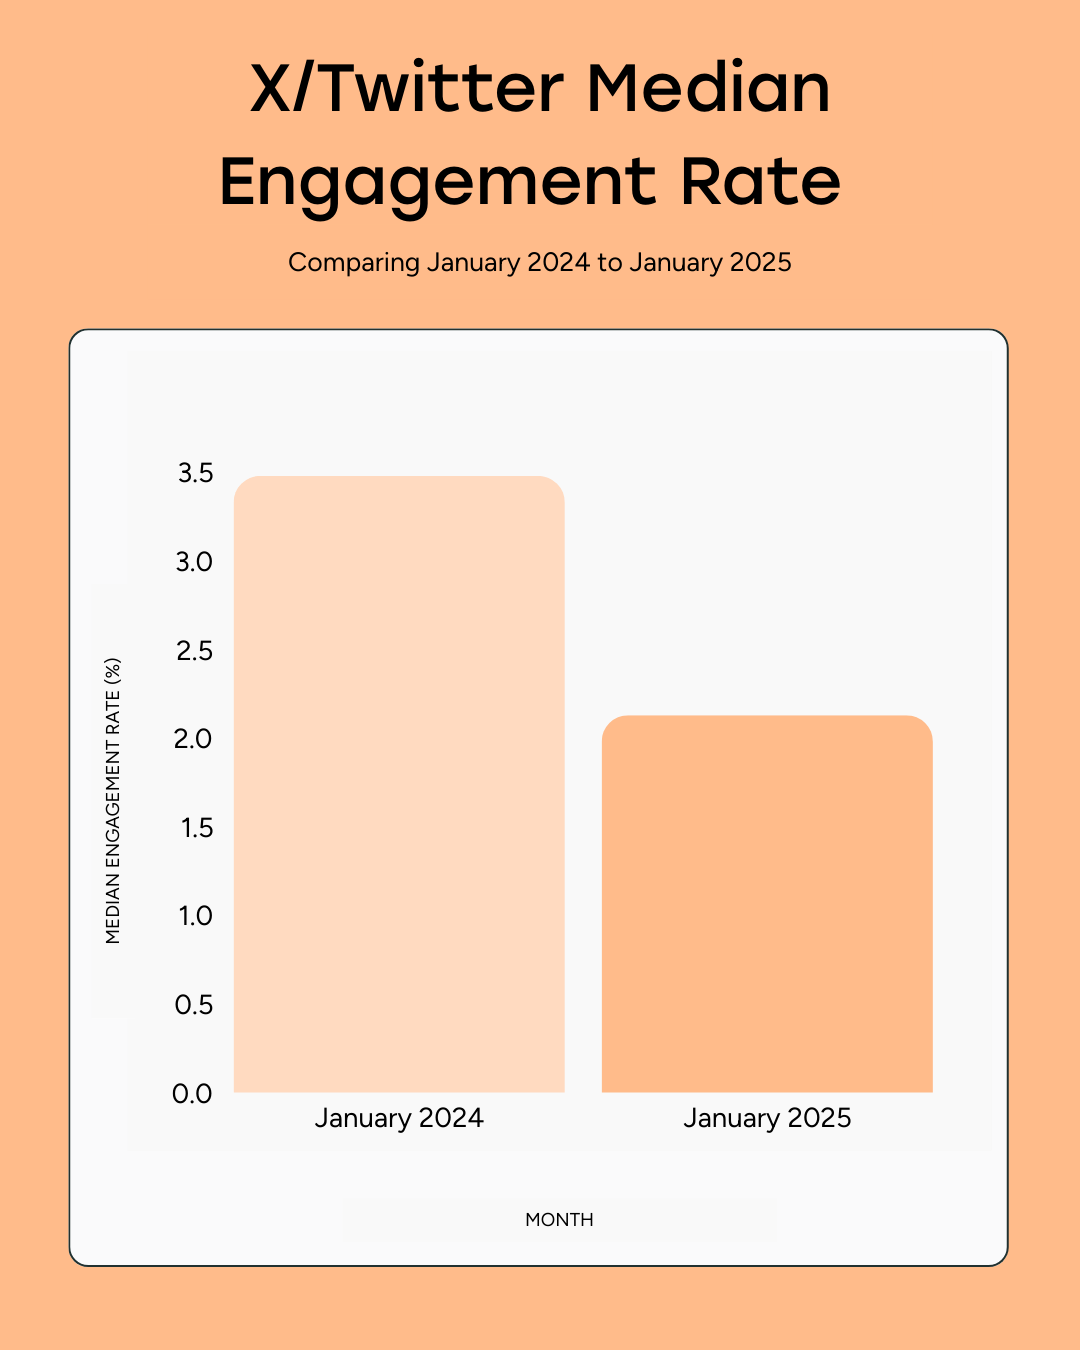
8. X/Twitter engagement continues to decline
X (formerly Twitter) has dropped from 3.47% in January 2024 to 2.15% in January 2025, making it the second-lowest platform for engagement after Instagram.
What’s driving the decline?
- Algorithm changes have reduced organic reach.** X is prioritizing paid subscribers and recommended content, making organic engagement harder to achieve.
- More users are lurking rather than engaging. Many users consume content without liking, commenting, or reposting, leading to lower engagement rates.
- Platform instability is affecting creator investment. With frequent policy shifts and monetization changes, fewer creators are prioritizing X.
Unless you’re focused on news, politics, or real-time commentary, engagement on X will require more effort and consistency to maintain.
What the data means for your content strategy
Knowing where engagement is highest is one thing — figuring out how to use that insight in your strategy is another.
A high engagement rate doesn’t automatically make a platform the best fit for you. The key question is: What are your goals, and which platform aligns with them?
Here’s how to refine your approach based on the data.
1. Pick the platform that aligns with your goals
Not all engagement is equal, and different platforms serve different purposes. Here's how you can adjust based on what you're trying to achieve:
- For high engagement per post: Focus on LinkedIn, Facebook, and Pinterest. LinkedIn and Facebook have strong engagement through comments and community-driven content. Pinterest excels at evergreen content, driving steady engagement long after posting.
- For massive reach potential: Go with Instagram and TikTok. While Instagram’s engagement rate may be lower, it offers vast reach, and TikTok’s discovery algorithm allows even smaller accounts to go viral.
- For video-focused engagement: TikTok and YouTube Shorts are the best platforms. Short-form video drives some of the highest engagement rates, and repurposing video across platforms (TikTok, YouTube, Instagram) can boost your reach without extra work.
- For real-time conversations: If your goal is immediate interactions, go with Threads or X (Twitter). Both excel in real-time discussions, with Threads gaining traction for organic engagement and X still being key for news-driven content.
Takeaway: Instead of trying to be everywhere, focus on the platforms that align with your specific goals. Don’t just chase high engagement rates — consider how each platform fits your content objectives.
2. Adapt your content format for each platform
Each platform prioritizes different formats based on user behavior. Here’s how you can tailor your content:
- LinkedIn is about conversation starters. Use long-form posts, carousels, and documents to encourage discussions and showcase expertise.
- Instagram’s engagement is increasingly happening behind the scenes — so focus on Reels that generate saves and shares, not just likes.
- TikTok favors content that keeps people watching. Go for quick hooks and engaging narratives that are visually compelling from the start.
- Pinterest excels with evergreen content that gets better over time. High-quality visuals, step-by-step guides, and search-optimized content will perform best here.
Takeaway: Tailor your content to the platform—what works on Instagram doesn’t necessarily work on LinkedIn. Focus on creating platform-first content that aligns with user expectations and engagement behaviors.
3. Fine-tune your posting strategy for maximum engagement
Engagement isn’t just about what you post — it’s about when and how often you post. Each platform rewards different posting behaviors, so optimizing your frequency is key.
- For LinkedIn and Facebook: Focus on quality over quantity. Posts that sustain engagement over time tend to do better, so one well-crafted post a few times a week can be enough.
- For Instagram, TikTok, and YouTube Shorts: These platforms thrive on frequency. Post daily to increase visibility and maintain engagement, but always prioritize quality content that resonates with your audience.
- For Threads and X: Engage in real-time conversations — post multiple times a day if possible, but engage actively with others’ content to build a community.
Takeaway: Match your posting frequency to the platform’s algorithm. Some platforms reward quality posts over consistency (LinkedIn, Facebook), while others, like TikTok and Instagram, reward daily posts that build momentum.
Play to the strengths of each platform
A high engagement rate doesn’t automatically mean a platform is the right fit for you. What matters most is how well a platform aligns with your goals — whether that’s visibility, deep engagement, video performance, or real-time interaction.
Instead of trying to be everywhere at once, focus on the platforms that play to your strengths and audience behaviors. Adapt your content format, posting strategy, and engagement approach to work with the strengths of each platform rather than against them.