Get started with managed collection (original) (raw)
This document describes how to set up Google Cloud Managed Service for Prometheus with managed collection. The setup is a minimal example of working ingestion, using a Prometheus deployment that monitors an example application and stores collected metrics in Monarch.
This document shows you how to do the following:
- Set up your environment and command-line tools.
- Set up managed collection for your cluster.
- Configure a resource for target scraping and metric ingestion.
- Migrate existing prometheus-operator custom resources.
We recommend that you use managed collection; it reduces the complexity of deploying, scaling, sharding, configuring, and maintaining the collectors. Managed collection is supported for GKE and all other Kubernetes environments.
Managed collection runs Prometheus-based collectors as a Daemonset and ensures scalability by only scraping targets on colocated nodes. You configure the collectors with lightweight custom resources to scrape exporters using pull collection, then the collectors push the scraped data to the central datastore Monarch. Google Cloud never directly accesses your cluster to pull or scrape metric data; your collectors push data to Google Cloud. For more information about managed and self-deployed data collection, see Data collection with Managed Service for Prometheus and Ingestion and querying with managed and self-deployed collection.
Before you begin
This section describes the configuration needed for the tasks described in this document.
Set up projects and tools
To use Google Cloud Managed Service for Prometheus, you need the following resources:
- A Google Cloud project with the Cloud Monitoring API enabled.
- If you don't have a Google Cloud project, then do the following:
1. In the Google Cloud console, go to New Project:
Create a New Project
2. In the Project Name field, enter a name for your project and then click Create.
3. Go to Billing:
Go to Billing
4. Select the project you just created if it isn't already selected at the top of the page.
5. You are prompted to choose an existing payments profile or to create a new one.
The Monitoring API is enabled by default for new projects.
- If you already have a Google Cloud project, then ensure that the Monitoring API is enabled:
1. Go to APIs & services:
Go to APIs & services
2. Select your project.
3. Click Enable APIs and Services.
4. Search for "Monitoring".
5. In the search results, click through to "Cloud Monitoring API".
6. If "API enabled" is not displayed, then click the Enable button.
- If you don't have a Google Cloud project, then do the following:
- A Kubernetes cluster. If you do not have a Kubernetes cluster, then follow the instructions in the Quickstart for GKE.
You also need the following command-line tools:
gcloudkubectl
The gcloud and kubectl tools are part of the Google Cloud CLI. For information about installing them, see Managing Google Cloud CLI components. To see the gcloud CLI components you have installed, run the following command:
gcloud components list
Configure your environment
To avoid repeatedly entering your project ID or cluster name, perform the following configuration:
- Configure the command-line tools as follows:
- Configure the gcloud CLI to refer to the ID of your Google Cloud project:
gcloud config set project PROJECT_ID - If running on GKE, use gcloud CLI to set your cluster:
gcloud container clusters get-credentials CLUSTER_NAME --location LOCATION --project PROJECT_ID - Otherwise, use the
kubectlCLI to set your cluster:
kubectl config set-cluster CLUSTER_NAME
For more information about these tools, see the following: - gcloud CLI overview
- kubectl commands
- Configure the gcloud CLI to refer to the ID of your Google Cloud project:
Set up a namespace
Create the NAMESPACE_NAME Kubernetes namespace for resources you create as part of the example application. We recommend using the namespace namegmp-test when using this documentation to configure an example Prometheus setup.
Create the namespace by running the following:
kubectl create ns NAMESPACE_NAME
You can use managed collection on both GKE and non-GKE Kubernetes clusters.
After managed collection is enabled, the in-cluster components will be running but no metrics are generated yet. PodMonitoring or ClusterPodMonitoring resources are needed by these components to correctly scrape the metrics endpoints. You must either deploy these resources with valid metrics endpoints or enable one of the managed metrics packages, for example,Kube state metrics, built into GKE. For troubleshooting information, seeIngestion-side problems.
Enabling managed collection installs the following components in your cluster:
- The
gmp-operatorDeployment, which deploys the Kubernetes operator for Managed Service for Prometheus. - The
rule-evaluatorDeployment, which is used to configure and run alerting and recording rules. - The
collectorDaemonSet, which horizontally scales collection by scraping metrics only from pods running on the same node as each collector. - The
alertmanagerStatefulSet, which is configured to send triggered alerts to your preferred notification channels.
For reference documentation about the Managed Service for Prometheus operator, see themanifests page.
Enable managed collection: GKE
Managed collection is enabled by default for the following:
- GKE Autopilot clustersrunning GKE version 1.25 or greater.
- GKE Standard clustersrunning GKE version 1.27 or greater. You can override this default when creating the cluster; see Disable managed collection.
If you are running in a GKE environment that does not enable managed collection by default, then seeEnable managed collection manually.
Managed collection on GKE is automatically upgraded when new in-cluster component versions are released.
Managed collection on GKE uses permissions granted to the default Compute Engine service account. If you have a policy that modifies the standard permissions on the default node service account, you might need to add the Monitoring Metric Writer roleto continue.
Enable managed collection manually
If you are running in a GKE environment that does not enable managed collection by default, then you can enable managed collection by using the following:
- The Managed Prometheus Bulk Cluster Enablement dashboard in Cloud Monitoring.
- The Kubernetes Engine page in the Google Cloud console.
- The Google Cloud CLI. To use the gcloud CLI, you must be running GKE version 1.21.4-gke.300 or newer.
- Terraform for Google Kubernetes Engine. To use Terraform to enable Managed Service for Prometheus, you must be running GKE version 1.21.4-gke.300 or newer.
Managed Prometheus Bulk Cluster Enablement dashboard
You can do the following by using the Managed Prometheus Bulk Cluster Enablement dashboard in Cloud Monitoring.
- Determine whether Managed Service for Prometheus is enabled on your clusters and whether you are using managed or self-deployed collection.
- Enable managed collection on clusters in your project.
- View other information about your clusters.
To view the Managed Prometheus Bulk Cluster Enablement dashboard, do the following:
- In the Google Cloud console, go to the Dashboards page:
Go to Dashboards
If you use the search bar to find this page, then select the result whose subheading isMonitoring. - Use the filter bar to search for the Managed Prometheus Bulk Cluster Enablement entry, then select it.
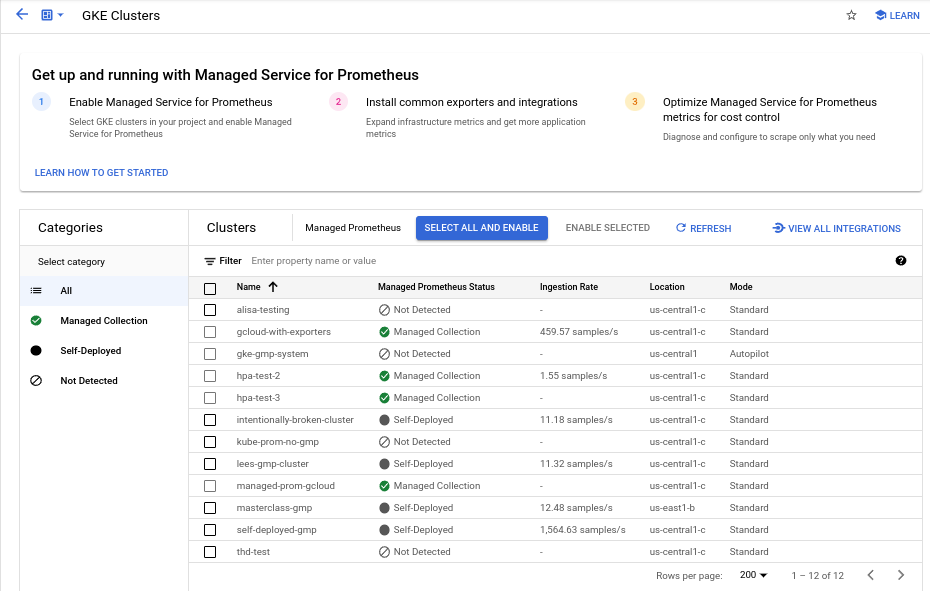
To enable managed collection on one or more GKE clusters by using the Managed Prometheus Bulk Cluster Enablement dashboard, do the following:
- Select the checkbox for each GKE cluster on which you want to enable managed collection.
- Select Enable Selected.
Kubernetes Engine UI
You can do the following by using the Google Cloud console:
- Enable managed collection on an existing GKE cluster.
- Create a new GKE cluster with managed collection enabled.
To update an existing cluster, do the following:
- In the Google Cloud console, go to the Kubernetes clusters page:
Go to Kubernetes clusters
If you use the search bar to find this page, then select the result whose subheading isKubernetes Engine. - Click on the name of the cluster.
- In the Features list, locate the Managed Service for Prometheusoption. If it is listed as disabled, clickEdit, and then select Enable Managed Service for Prometheus.
- Click Save changes.
To create a cluster with managed collection enabled, do the following:
- In the Google Cloud console, go to the Kubernetes clusters page:
Go to Kubernetes clusters
If you use the search bar to find this page, then select the result whose subheading isKubernetes Engine. - Click Create.
- Click Configure for the Standard option.
- In the navigation panel, click Features.
- In the Operations section, select Enable Managed Service for Prometheus.
- Click Save.
gcloud CLI
You can do the following by using the gcloud CLI:
- Enable managed collection on an existing GKE cluster.
- Create a new GKE cluster with managed collection enabled.
These commands might take up to 5 minutes to complete.
First, set your project:
gcloud config set project PROJECT_ID
To update an existing cluster, run one of the followingupdate commands based on whether your cluster is zonal or regional:
- gcloud container clusters update CLUSTER_NAME --enable-managed-prometheus --zone ZONE
- gcloud container clusters update CLUSTER_NAME --enable-managed-prometheus --region REGION
To create a cluster with managed collection enabled, run the following command:
gcloud container clusters create CLUSTER_NAME --zone ZONE --enable-managed-prometheus
GKE Autopilot
Managed collection is on by default inGKE Autopilot clustersrunning GKE version 1.25 or greater. You can't turn off managed collection.
If your cluster fails to enable managed collection automatically when upgrading to 1.25, you can manually enable it by running the update command in the gcloud CLI section.
Terraform
For instructions on configuring managed collection using Terraform, see theTerraform registry for google_container_cluster.
For general information about using Google Cloud with Terraform, seeTerraform with Google Cloud.
Disable managed collection
If you want to disable managed collection on your clusters, then you can use one of the following methods:
Kubernetes Engine UI
You can do the following by using the Google Cloud console:
- Disable managed collection on an existing GKE cluster.
- Override the automatic enabling of managed collection when creating a new GKE Standard cluster running GKE version 1.27 or greater.
To update an existing cluster, do the following:
- In the Google Cloud console, go to the Kubernetes clusters page:
Go to Kubernetes clusters
If you use the search bar to find this page, then select the result whose subheading isKubernetes Engine. - Click on the name of the cluster.
- In the Features section, locate the Managed Service for Prometheus option. Click Edit, and clear Enable Managed Service for Prometheus.
- Click Save changes.
To override the automatic enabling of managed collection when creating a new GKE Standard cluster (version 1.27 or greater), do the following:
- In the Google Cloud console, go to the Kubernetes clusters page:
Go to Kubernetes clusters
If you use the search bar to find this page, then select the result whose subheading isKubernetes Engine. - Click Create.
- Click Configure for the Standard option.
- In the navigation panel, click Features.
- In the Operations section, clear Enable Managed Service for Prometheus.
- Click Save.
gcloud CLI
You can do the following by using the gcloud CLI:
- Disable managed collection on an existing GKE cluster.
- Override the automatic enabling of managed collection when creating a new GKE Standard cluster running GKE version 1.27 or greater.
These commands might take up to 5 minutes to complete.
First, set your project:
gcloud config set project PROJECT_ID
To disable managed collection on an existing cluster, run one of the followingupdate commands based on whether your cluster is zonal or regional:
- gcloud container clusters update CLUSTER_NAME --disable-managed-prometheus --zone ZONE
- gcloud container clusters update CLUSTER_NAME --disable-managed-prometheus --region REGION
To override the automatic enabling of managed collection when creating a new GKE Standard cluster (version 1.27 or greater), run the following command:
gcloud container clusters create CLUSTER_NAME --zone ZONE --no-enable-managed-prometheus
GKE Autopilot
You can't turn off managed collection inGKE Autopilot clustersrunning GKE version 1.25 or greater.
Terraform
To disable managed collection, set the enabled attribute in themanaged_prometheus configuration block to false. For more information about this configuration block, see theTerraform registry for google_container_cluster.
For general information about using Google Cloud with Terraform, seeTerraform with Google Cloud.
Enable managed collection: non-GKE Kubernetes
If you are running in a non-GKE environment, then you can enable managed collection using the following:
- The
kubectlCLI. - VMware or bare metal on-premises deployments running version 1.12 or newer.
kubectl CLI
To install managed collectors when you are using a non-GKE Kubernetes cluster, run the following commands to install the setup and operator manifests:
kubectl apply -f https://raw.githubusercontent.com/GoogleCloudPlatform/prometheus-engine/v0.17.2/manifests/setup.yaml
kubectl apply -f https://raw.githubusercontent.com/GoogleCloudPlatform/prometheus-engine/v0.17.2/manifests/operator.yaml
On-premises
For information about configuring managed collection for on-premises clusters, see the documentation for your distribution:
Deploy the example application
The example application emits the example_requests_total counter metric and the example_random_numbershistogram metric (among others) on its metrics port. The manifest for the application defines three replicas.
To deploy the example application, run the following command:
kubectl -n NAMESPACE_NAME apply -f https://raw.githubusercontent.com/GoogleCloudPlatform/prometheus-engine/v0.17.2/examples/example-app.yaml
Configure a PodMonitoring resource
To ingest the metric data emitted by the example application, Managed Service for Prometheus uses target scraping. Target scraping and metrics ingestion are configured using Kubernetes custom resources. The managed service usesPodMonitoring custom resources (CRs).
A PodMonitoring CR scrapes targets only in the namespace the CR is deployed in. To scrape targets in multiple namespaces, deploy the same PodMonitoring CR in each namespace. You can verify the PodMonitoring resource is installed in the intended namespace by running kubectl get podmonitoring -A.
For reference documentation about all the Managed Service for Prometheus CRs, see the prometheus-engine/doc/api reference.
The following manifest defines a PodMonitoring resource,prom-example, in the NAMESPACE_NAME namespace. The resource uses a Kubernetes label selector to find all pods in the namespace that have the label app.kubernetes.io/name with the value prom-example. The matching pods are scraped on a port named metrics, every 30 seconds, on the /metrics HTTP path.
apiVersion: monitoring.googleapis.com/v1 kind: PodMonitoring metadata: name: prom-example spec: selector: matchLabels: app.kubernetes.io/name: prom-example endpoints:
- port: metrics interval: 30s
To apply this resource, run the following command:
kubectl -n NAMESPACE_NAME apply -f https://raw.githubusercontent.com/GoogleCloudPlatform/prometheus-engine/v0.17.2/examples/pod-monitoring.yaml
Your managed collector is now scraping the matching pods. You can view the status of your scrape target byenabling the target status feature.
To configure horizontal collection that applies to a range of pods across all namespaces, use the ClusterPodMonitoringresource. The ClusterPodMonitoring resource provides the same interface as the PodMonitoring resource but does not limit discovered pods to a given namespace.
If you are running on GKE, then you can do the following:
- To query the metrics ingested by the example application using PromQL in Cloud Monitoring, see Query using Cloud Monitoring.
- To query the metrics ingested by the example application using Grafana, seeQuery using Grafana or any Prometheus API consumer.
- To learn about filtering exported metrics and adapting your prom-operator resources, see Additional topics for managed collection.
If you are running outside of GKE, then you need to create a service account and authorize it to write your metric data, as described in the following section.
Provide credentials explicitly
When running on GKE, the collecting Prometheus server automatically retrieves credentials from the environment based on the node's service account. In non-GKE Kubernetes clusters, credentials must be explicitly provided through the OperatorConfig resource in the gmp-public namespace.
- Set the context to your target project:
gcloud config set project PROJECT_ID - Create a service account:
gcloud iam service-accounts create gmp-test-sa - Grant the required permissions to the service account:
gcloud projects add-iam-policy-binding PROJECT_ID\
--member=serviceAccount:gmp-test-sa@PROJECT_ID.iam.gserviceaccount.com \
--role=roles/monitoring.metricWriter - Create and download a key for the service account:
gcloud iam service-accounts keys create gmp-test-sa-key.json \
--iam-account=gmp-test-sa@PROJECT_ID.iam.gserviceaccount.com - Add the key file as a secret to your non-GKE cluster:
kubectl -n gmp-public create secret generic gmp-test-sa \
--from-file=key.json=gmp-test-sa-key.json - Open the OperatorConfig resource for editing:
kubectl -n gmp-public edit operatorconfig config- Add the text shown in bold to the resource:
apiVersion: monitoring.googleapis.com/v1
kind: OperatorConfig
metadata:
namespace: gmp-public
name: config
collection:
credentials:
name: gmp-test-sa
key: key.json
Make sure you also add these credentials to the rules sectionso that managed rule evaluation works. - Save the file and close the editor. After the change is applied, the pods are re-created and start authenticating to the metric backend with the given service account.
- Add the text shown in bold to the resource:
Additional topics for managed collection
This section describes how to do the following:
* Enable the target status feature for easier debugging.
* Configure target scraping using Terraform.
* Filter the data you export to the managed service.
* Scrape Kubelet and cAdvisor metrics.
* Convert your existing prom-operator resources for use with the managed service.
* Run managed collection outside of GKE.
### Enabling the target status feature
Managed Service for Prometheus provides a way to check whether your targets are being properly discovered and scraped by the collectors. This target status report is meant to be a tool for debugging acute problems. We strongly recommend only enabling this feature to investigate immediate issues. Leaving target status reporting on in large clusters might cause the operator to run out of memory and crash loop.
You can check the status of your targets in your PodMonitoring or ClusterPodMonitoring resources by setting the features.targetStatus.enabledvalue within the OperatorConfig resource to true, as shown in the following:
apiVersion: monitoring.googleapis.com/v1
kind: OperatorConfig
metadata:
namespace: gmp-public
name: config
features:
targetStatus:
enabled: true
After a few seconds, the Status.Endpoint Statuses field appears on every valid PodMonitoring or ClusterPodMonitoring resource, when configured.
If you have a PodMonitoring resource with the name prom-examplein the NAMESPACE_NAME namespace, then you can check the status by running the following command:
kubectl -n NAMESPACE_NAME describe podmonitorings/prom-example
The output looks like the following:
API Version: monitoring.googleapis.com/v1 Kind: PodMonitoring ... Status: Conditions: ... Status: True Type: ConfigurationCreateSuccess Endpoint Statuses: Active Targets: 3 Collectors Fraction: 1 Last Update Time: 2023-08-02T12:24:26Z Name: PodMonitoring/custom/prom-example/metrics Sample Groups: Count: 3 Sample Targets: Health: up Labels: Cluster: CLUSTER_NAME Container: prom-example Instance: prom-example-589ddf7f7f-hcnpt:metrics Job: prom-example Location: REGION Namespace: NAMESPACE_NAME Pod: prom-example-589ddf7f7f-hcnpt project_id: PROJECT_ID Last Scrape Duration Seconds: 0.020206416 Health: up Labels: ... Last Scrape Duration Seconds: 0.054189485 Health: up Labels: ... Last Scrape Duration Seconds: 0.006224887
The output includes the following status fields:
* Status.Conditions.Status is true when Managed Service for Prometheus acknowledges and processes the PodMonitoring or ClusterPodMonitoring.
* Status.Endpoint Statuses.Active Targets shows the number of scrape targets that Managed Service for Prometheus counts on all collectors for this PodMonitoring resource. In the example application, the prom-exampledeployment has three replicas with a single metric target, so the value is 3. If there are unhealthy targets, the Status.Endpoint Statuses.Unhealthy Targets field appears.
* Status.Endpoint Statuses.Collectors Fraction shows a value of 1(meaning 100%) if all of the managed collectors are reachable by Managed Service for Prometheus.
* Status.Endpoint Statuses.Last Update Time shows the last updated time. When the last update time is significantly longer than your desired scrape interval time, the difference might indicate issues with your target or cluster.
* Status.Endpoint Statuses.Sample Groups field shows sample targets grouped by common target labels injected by the collector. This value is useful for debugging situations where your targets are not discovered. If all targets are healthy and being collected, then the expected value for the Healthfield is up and the value for the Last Scrape Duration Seconds field is the usual duration for a typical target.
For more information about these fields, see theManaged Service for Prometheus API document.
Any of the following might indicate a problem wth your configuration:
* There is no Status.Endpoint Statuses field in your PodMonitoring resource.
* The value of the Last Scrape Duration Seconds field is too old.
* You see too few targets.
* The value of the Health field indicates that the target is down.
For more information about debugging target discovery issues, see Ingestion-side problems in the troubleshooting documentation.
If your scrape target requires authorization, you can set up the collector to use the correct authorization type and provide any relevant secrets.
Google Cloud Managed Service for Prometheus supports the following authorization types:
* mTLS
* BasicAuth
* HTTP Authorization Header
* OAuth 2
#### mTLS
mTLS is commonly configured within zero trust environments, such as Istio service mesh or Cloud Service Mesh.
To enable scraping endpoints secured using mTLS, set theSpec.Endpoints[].Scheme field in your PodMonitoring resource to https. While not recommended, you can set the Spec.Endpoints[].tls.insecureSkipVerify field in your PodMonitoring resource to true to skip verifying the certificate authority. Alternatively, you can configure Managed Service for Prometheus to load certificates and keys from secret resources.
For example, the following Secret resource contains keys for the client (cert), private key (key), and certificate authority (ca) certificates:
kind: Secret
metadata:
name: secret-example
stringData:
cert: ********
key: ********
ca: ********
Grant the Managed Service for Prometheus collector permission to access that Secret resource:
apiVersion: rbac.authorization.k8s.io/v1
kind: Role
metadata:
name: secret-example-read
rules:
- resources:
- secrets
apiGroups: [""]
verbs: ["get", "list", "watch"]
resourceNames: ["secret-example"]
apiVersion: rbac.authorization.k8s.io/v1
kind: RoleBinding
metadata:
name: gmp-system:collector:secret-example-read
namespace: default
roleRef:
name: secret-example-read
kind: Role
apiGroup: rbac.authorization.k8s.io
subjects:
- name: collector
namespace: gmp-system
kind: ServiceAccount
On GKE Autopilot clusters, this looks like:
apiVersion: rbac.authorization.k8s.io/v1
kind: Role
metadata:
name: secret-example-read
rules:
- resources:
- secrets
apiGroups: [""]
verbs: ["get", "list", "watch"]
resourceNames: ["secret-example"]
apiVersion: rbac.authorization.k8s.io/v1
kind: RoleBinding
metadata:
name: gmp-system:collector:secret-example-read
namespace: default
roleRef:
name: secret-example-read
kind: Role
apiGroup: rbac.authorization.k8s.io
subjects:
- name: collector
namespace: gke-gmp-system
kind: ServiceAccount
To configure a PodMonitoring resource that uses the prior Secret resource, modify your resource to add a scheme and tls section:
apiVersion: monitoring.googleapis.com/v1
kind: PodMonitoring
metadata:
name: prom-example
spec:
selector:
matchLabels:
app.kubernetes.io/name: prom-example
endpoints:
- port: metrics
interval: 30s
scheme: https
tls:
ca:
secret:
name: secret-example
key: ca
cert:
secret:
name: secret-example
key: cert
key:
secret:
name: secret-example
key: key
For reference documentation about all the Managed Service for Prometheus mTLS options, see theAPI reference documentation.
#### BasicAuth
To enable scraping endpoints secured using BasicAuth, set theSpec.Endpoints[].BasicAuth field in your PodMonitoring resource with your username and password. For other HTTP Authorization Header types, seeHTTP Authorization Header.
For example, the following Secret resource contains a key to store the password:
kind: Secret
metadata:
name: secret-example
stringData:
password: ********
Grant the Managed Service for Prometheus collector permission to access that Secret resource:
apiVersion: rbac.authorization.k8s.io/v1
kind: Role
metadata:
name: secret-example-read
rules:
- resources:
- secrets
apiGroups: [""]
verbs: ["get", "list", "watch"]
resourceNames: ["secret-example"]
apiVersion: rbac.authorization.k8s.io/v1
kind: RoleBinding
metadata:
name: gmp-system:collector:secret-example-read
namespace: default
roleRef:
name: secret-example-read
kind: Role
apiGroup: rbac.authorization.k8s.io
subjects:
- name: collector
namespace: gmp-system
kind: ServiceAccount
On GKE Autopilot clusters, this looks like:
apiVersion: rbac.authorization.k8s.io/v1
kind: Role
metadata:
name: secret-example-read
rules:
- resources:
- secrets
apiGroups: [""]
verbs: ["get", "list", "watch"]
resourceNames: ["secret-example"]
apiVersion: rbac.authorization.k8s.io/v1
kind: RoleBinding
metadata:
name: gmp-system:collector:secret-example-read
namespace: default
roleRef:
name: secret-example-read
kind: Role
apiGroup: rbac.authorization.k8s.io
subjects:
- name: collector
namespace: gke-gmp-system
kind: ServiceAccount
To configure a PodMonitoring resource that uses the prior Secret resource and a username of foo, modify your resource to add a basicAuth section:
apiVersion: monitoring.googleapis.com/v1
kind: PodMonitoring
metadata:
name: prom-example
spec:
selector:
matchLabels:
app.kubernetes.io/name: prom-example
endpoints:
- port: metrics
interval: 30s
basicAuth:
username: foo
password:
secret:
name: secret-example
key: password
For reference documentation about all the Managed Service for Prometheus BasicAuth options, see theAPI reference documentation.
To enable scraping endpoints secured using HTTP Authorization Headers, set theSpec.Endpoints[].Authorization field in your PodMonitoring resource with the type and credentials. For BasicAuth endpoints, use theBasicAuth configuration instead.
For example, the following Secret resource contains a key to store the credentials:
kind: Secret
metadata:
name: secret-example
stringData:
credentials: ********
Grant the Managed Service for Prometheus collector permission to access that Secret resource:
apiVersion: rbac.authorization.k8s.io/v1
kind: Role
metadata:
name: secret-example-read
rules:
- resources:
- secrets
apiGroups: [""]
verbs: ["get", "list", "watch"]
resourceNames: ["secret-example"]
apiVersion: rbac.authorization.k8s.io/v1
kind: RoleBinding
metadata:
name: gmp-system:collector:secret-example-read
namespace: default
roleRef:
name: secret-example-read
kind: Role
apiGroup: rbac.authorization.k8s.io
subjects:
- name: collector
namespace: gmp-system
kind: ServiceAccount
On GKE Autopilot clusters, this looks like:
apiVersion: rbac.authorization.k8s.io/v1
kind: Role
metadata:
name: secret-example-read
rules:
- resources:
- secrets
apiGroups: [""]
verbs: ["get", "list", "watch"]
resourceNames: ["secret-example"]
apiVersion: rbac.authorization.k8s.io/v1
kind: RoleBinding
metadata:
name: gmp-system:collector:secret-example-read
namespace: default
roleRef:
name: secret-example-read
kind: Role
apiGroup: rbac.authorization.k8s.io
subjects:
- name: collector
namespace: gke-gmp-system
kind: ServiceAccount
To configure a PodMonitoring resource that uses the prior Secret resource and a type of Bearer, modify your resource to add an authorization section:
apiVersion: monitoring.googleapis.com/v1
kind: PodMonitoring
metadata:
name: prom-example
spec:
selector:
matchLabels:
app.kubernetes.io/name: prom-example
endpoints:
- port: metrics
interval: 30s
authorization:
type: Bearer
credentials:
secret:
name: secret-example
key: credentials
For reference documentation about all the Managed Service for Prometheus HTTP Authorization Header options, see theAPI reference documentation.
#### OAuth 2
To enable scraping endpoints secured using OAuth 2, you must set theSpec.Endpoints[].OAuth2 field in your PodMonitoring resource.
For example, the following Secret resource contains a key to store the client secret:
kind: Secret
metadata:
name: secret-example
stringData:
clientSecret: ********
Grant the Managed Service for Prometheus collector permission to access that Secret resource:
apiVersion: rbac.authorization.k8s.io/v1
kind: Role
metadata:
name: secret-example-read
rules:
- resources:
- secrets
apiGroups: [""]
verbs: ["get", "list", "watch"]
resourceNames: ["secret-example"]
apiVersion: rbac.authorization.k8s.io/v1
kind: RoleBinding
metadata:
name: gmp-system:collector:secret-example-read
namespace: default
roleRef:
name: secret-example-read
kind: Role
apiGroup: rbac.authorization.k8s.io
subjects:
- name: collector
namespace: gmp-system
kind: ServiceAccount
On GKE Autopilot clusters, this looks like:
apiVersion: rbac.authorization.k8s.io/v1
kind: Role
metadata:
name: secret-example-read
rules:
- resources:
- secrets
apiGroups: [""]
verbs: ["get", "list", "watch"]
resourceNames: ["secret-example"]
apiVersion: rbac.authorization.k8s.io/v1
kind: RoleBinding
metadata:
name: gmp-system:collector:secret-example-read
namespace: default
roleRef:
name: secret-example-read
kind: Role
apiGroup: rbac.authorization.k8s.io
subjects:
- name: collector
namespace: gke-gmp-system
kind: ServiceAccount
To configure a PodMonitoring resource that uses the prior Secret resource with a client ID offooand token URL ofexample.com/token, modify your resource to add anoauth2section:
apiVersion: monitoring.googleapis.com/v1
kind: PodMonitoring
metadata:
name: prom-example
spec:
selector:
matchLabels:
app.kubernetes.io/name: prom-example
endpoints:- port: metrics
interval: 30s
oauth2:
clientID: foo
clientSecret:
secret:
name: secret-example
key: password
tokenURL: example.com/token
For reference documentation about all the Managed Service for Prometheus OAuth 2 options, see the API reference documentation.
- port: metrics
Configuring target scraping using Terraform
You can automate the creation and management of PodMonitoring and ClusterPodMonitoring resources by using the kubernetes_manifest Terraform resource type or the kubectl_manifestTerraform resource type, either of which lets you specify arbitrary custom resources.
For general information about using Google Cloud with Terraform, see Terraform with Google Cloud.
Filter exported metrics
If you collect a lot of data, you might want to prevent some time series from being sent to Managed Service for Prometheus to keep down costs. You can do this by using Prometheus relabeling ruleswith a keep action for an allowlist or a drop action for a denylist. For managed collection, this rule goes in the metricRelabeling section of yourPodMonitoring or ClusterPodMonitoringresource.
For example, the following metric relabeling rule will filter out any metric that begins with foo_bar_, foo_baz_, or foo_qux_:
metricRelabeling:
- action: drop
regex: foo_(bar|baz|qux)_.+
sourceLabels: [name]
The Cloud Monitoring Metrics Management page provides information that can help you control the amount you spend on billable metrics without affecting observability. The Metrics Management page reports the following information:
- Ingestion volumes for both byte- and sample-based billing, across metric domains and for individual metrics.
- Data about labels and cardinality of metrics.
- Number of reads for each metric.
- Use of metrics in alerting policies and custom dashboards.
- Rate of metric-write errors.
You can also use the Metrics Management page toexclude unneeded metrics, eliminating the cost of ingesting them. For more information about the Metrics Management page, seeView and manage metric usage.
For additional suggestions on how to lower your costs, see Cost controls and attribution.
Scraping Kubelet and cAdvisor metrics
The Kubelet exposes metrics about itself as well as cAdvisor metrics about containers running on its node. You can configure managed collection to scrape Kubelet and cAdvisor metrics by editing the OperatorConfig resource. For instructions, see the exporter documentation forKubelet and cAdvisor.
Convert existing prometheus-operator resources
You can usually convert your existing prometheus-operator resources to Managed Service for Prometheus managed collection PodMonitoring and ClusterPodMonitoring resources.
For example, the ServiceMonitor resourcedefines monitoring for a set of services. The PodMonitoring resource serves a subset of the fields served by the ServiceMonitor resource. You can convert a ServiceMonitor CR to a PodMonitoring CR by mapping the fields as described in the following table:
| monitoring.coreos.com/v1 ServiceMonitor | Compatibility | monitoring.googleapis.com/v1 PodMonitoring |
|---|---|---|
| .ServiceMonitorSpec.Selector | Identical | .PodMonitoringSpec.Selector |
| .ServiceMonitorSpec.Endpoints[] | .TargetPort maps to .Port .Path: compatible .Interval: compatible .Timeout: compatible | .PodMonitoringSpec.Endpoints[] |
| .ServiceMonitorSpec.TargetLabels | PodMonitor must specify: .FromPod[].From pod label .FromPod[].To target label | .PodMonitoringSpec.TargetLabels |
| The following is a sample ServiceMonitor CR; the content in bold type is replaced in the conversion, and the content in italic type maps directly: | ||
| apiVersion: monitoring.coreos.com/v1 | ||
| kind: ServiceMonitor | ||
| metadata: | ||
| name: example-app | ||
| spec: | ||
| selector: |
matchLabels:
  app: example-app
endpoints:
- targetPort: web
path: /stats
interval: 30s
targetLabels:
- foo
The following is the analogous PodMonitoring CR, assuming that your service and its pods are labeled withapp=example-app. If this assumption does not apply, then you need to use the label selectors of the underlying Service resource.
The content in bold type has been replaced in the conversion:
apiVersion: monitoring.googleapis.com/v1
kind: PodMonitoring
metadata:
name: example-app
spec:
selector:
matchLabels:
app: example-app
endpoints: - port: web
path: /stats
interval: 30s
targetLabels:
fromPod:
- from: foo # pod label from example-app Service pods.
to: foo
You can always continue to use your existing prometheus-operator resources and deployment configs by using self-deployed collectors instead of managed collectors. You can query metrics sent from both collector types, so you might want to use self-deployed collectors for your existing Prometheus deployments while using managed collectors for new Prometheus deployments.
Reserved labels
Managed Service for Prometheus automatically adds the following labels to all metrics collected. These labels are used to uniquely identify a resource in Monarch:
project_id: The identifier of the Google Cloud project associated with your metric.location: The physical location (Google Cloud region) where the data is stored. This value is typically the region of your GKE cluster. If data is collected from an AWS or on-premises deployment, then the value might be the closest Google Cloud region.cluster: The name of the Kubernetes cluster associated with your metric.namespace: The name of the Kubernetes namespace associated with your metric.job: The job label of the Prometheus target, if known; might be empty for rule-evaluation results.instance: The instance label of the Prometheus target, if known; might be empty for rule-evaluation results.
While not recommended when running on Google Kubernetes Engine, you can override theproject_id,location, andclusterlabels by adding them as args to the Deployment resource withinoperator.yaml. If you use any reserved labels as metric labels, Managed Service for Prometheus automatically relabels them by adding the prefixexported_. This behavior matches how upstream Prometheus handlesconflicts with reserved labels.
Compress configurations
If you have many PodMonitoring resources, you might run out of ConfigMap space. To fix this, enable gzip compression in yourOperatorConfig resource:
apiVersion: monitoring.googleapis.com/v1
kind: OperatorConfig
metadata:
namespace: gmp-public
name: config
features:
config:
compression: gzip
Enable vertical pod autoscaling (VPA) for managed collection
If you are encountering Out of Memory (OOM) errors for the collector pods in your cluster or if the default resource requests and limits for the collectors otherwise don't meet your needs, then you can use vertical pod autoscaling to dynamically allocate resources.
When you set the field scaling.vpa.enabled: true on the OperatorConfigresource, the operator deploys a VerticalPodAutoscaler manifest in the cluster that allows theresource requests and limitsof the collector pods to be set automatically, based on usage.
To enable VPA for collector pods in Managed Service for Prometheus, run the following command:
kubectl -n gmp-public patch operatorconfig/config -p '{"scaling":{"vpa":{"enabled":true}}}' --type=merge
If the command completes successfully, then the operator sets up vertical pod autoscaling for the collector pods. Out Of Memory errors result in an immediate increase to the resource limits. If there are no OOM errors, then the first adjustment to the resource requests and limits of the collector pods typically occurs within 24 hours.
You might receive this error when attempting to enable VPA:vertical pod autoscaling is not available - install vpa support and restart the operator
To resolve this error, you need to first enable vertical pod autoscaling at the cluster level:
- Go to the Kubernetes Engine - Clusters page in the Google Cloud console.
In the Google Cloud console, go to the Kubernetes clusters page:
Go to Kubernetes clusters
If you use the search bar to find this page, then select the result whose subheading isKubernetes Engine. - Select the cluster you want to modify.
- In the Automation section, edit the value of the Vertical Pod Autoscaling option.
- Select the Enable Vertical Pod Autoscaling checkbox, and then clickSave changes. This change restarts your cluster. The operator restarts as a part of this process.
- Retry the following command:
kubectl -n gmp-public patch operatorconfig/config -p '{"scaling":{"vpa":{"enabled":true}}}' --type=mergeto enable VPA for Managed Service for Prometheus.
To confirm that theOperatorConfigresource is edited successfully, open it using the commandkubectl -n gmp-public edit operatorconfig config. If successful, yourOperatorConfigincludes the following section in bold:
apiVersion: monitoring.googleapis.com/v1
kind: OperatorConfig
metadata:
namespace: gmp-public
name: config
scaling:
vpa:
enabled: true
If you have already enabled vertical pod autoscaling at the cluster level and are still seeing thevertical pod autoscaling is not available - install vpa support and restart the operatorerror, then thegmp-operatorpod might need to re-evaluate the cluster configuration. Do one of the following:
- If you are running a Standard cluster, run the following command to recreate the pod:
kubectl -n gmp-system rollout restart deployment/gmp-operator
After thegmp-operatorpod has restarted, follow the steps above to patch theOperatorConfigonce again. - If you are running an Autopilot cluster, then you can't restart the
gmp-operatorpod manually. When you enable VPA for the managed collectors in an Autopilot cluster, VPA automatically evicts and recreates the collector pods to apply the new resource requests; no cluster restart is required. If you see thevertical pod autoscaling is not availableerror after enabling VPA, or encounter other issues with VPA activation for Managed Service for Prometheus, thencontact support.
Vertical pod autoscaling works best when ingesting steady numbers of samples, divided equally across nodes. If the metrics load is irregular or spiky, or if metrics load varies greatly between nodes, VPA might not be an efficient solution.
For more information, seevertical pod autoscaling in GKE.
Configure statsd_exporter and other exporters that report metrics centrally
If you use the statsd_exporter for Prometheus, Envoy for Istio, the SNMP exporter, the Prometheus Pushgateway, kube-state-metrics, or you otherwise have a similar exporter that intermediates and reports metrics on behalf of other resources running in your environment, then you need to make some small changes for your exporter to work with Managed Service for Prometheus.
For instructions on configuring these exporters, see this note in the Troubleshooting section.
Teardown
To disable managed collection deployed using gcloud or the GKE UI, you can do either of the following:
- Run the following command:
gcloud container clusters update CLUSTER_NAME --disable-managed-prometheus - Use the GKE UI:
1. Select Kubernetes Engine in the Google Cloud console, then selectClusters.
2. Locate the cluster for which you want to disable managed collection and click its name.
3. On the Details tab, scroll down to Features and change the state toDisabled by using the edit button.
To disable managed collection deployed by using Terraform, specifyenabled = false in the managed_prometheus section of thegoogle_container_cluster resource.
To disable managed collection deployed by using kubectl, run the following command:
kubectl delete -f https://raw.githubusercontent.com/GoogleCloudPlatform/prometheus-engine/v0.17.2/manifests/operator.yaml
Disabling managed collection causes your cluster to stop sending new data to Managed Service for Prometheus. Taking this action does not delete any existing metrics data already stored in the system.
Disabling managed collection also deletes the gmp-public namespace and any resources within it, including any exporters installed in that namespace.
Run managed collection outside of GKE
In GKE environments, you can run managed collection without further configuration. In other Kubernetes environments, you need to explicitly provide credentials, a project-id value to contain your metrics, a location value (Google Cloud region) where your metrics will be stored, and a cluster value to save the name of the cluster in which the collector is running.
As gcloud does not work outside of Google Cloud environments, you need todeploy using kubectl instead. Unlike with gcloud, deploying managed collection using kubectl does not automatically upgrade your cluster when a new version is available. Remember to watch the releases page for new versions and manually upgrade by re-running the kubectl commands with the new version.
You can provide a service account key by modifying the OperatorConfig resource within operator.yaml as described in Provide credentials explicitly. You can provideproject-id, location, and cluster values by adding them as args to the Deployment resource within operator.yaml.
We recommend choosing project-id based on your planned tenancy model for reads. Pick a project to store metrics in based on how you plan to organize reads later with metrics scopes. If you don't care, you can put everything into one project.
For location, we recommend choosing the nearest Google Cloud region to your deployment. The further the chosen Google Cloud region is from your deployment, the more write latency you'll have and the more you'll be affected by potential networking issues. You might want to consult this list of regions across multiple clouds. If you don't care, you can put everything into one Google Cloud region. You can't use global as your location.
For cluster, we recommend choosing the name of the cluster in which the operator is deployed.
When properly configured, your OperatorConfig should look like this:
apiVersion: monitoring.googleapis.com/v1
kind: OperatorConfig
metadata:
namespace: gmp-public
name: config
collection:
credentials:
name: gmp-test-sa
key: key.json
rules:
credentials:
name: gmp-test-sa
key: key.json
And your Deployment resource should look like this:
apiVersion: apps/v1
kind: Deployment
...
spec:
...
template:
...
spec:
...
containers:
- name: operator
...
args:
- ...
- "--project-id=PROJECT_ID"
- "--cluster=CLUSTER_NAME"
- "--location=REGION"
This example assumes you have set the REGION variable to a value likeus-central1, for example.
Running Managed Service for Prometheus outside of Google Cloud incurs data transfer fees. There are fees to transfer data into Google Cloud, and you might incur fees to transfer data out of another cloud. You can minimize these costs by enabling gzip compression over the wire through the OperatorConfig. Add the text shown in bold to the resource:
apiVersion: monitoring.googleapis.com/v1
kind: OperatorConfig
metadata:
namespace: gmp-public
name: config
collection:
compression: gzip
...
Further reading on managed collection custom resources
For reference documentation about all the Managed Service for Prometheus custom resources, see theprometheus-engine/doc/api reference.