Bioconductor Code: EnrichedHeatmap (original) (raw)
# Make Enriched Heatmaps [\](https://github.com/jokergoo/EnrichedHeatmap/actions) [\](https://codecov.io/github/jokergoo/EnrichedHeatmap) [\](https://bioconductor.org/packages/stats/bioc/EnrichedHeatmap/) [\](https://bioconductor.org/packages/stats/bioc/EnrichedHeatmap/) [\](http://bioconductor.org/packages/devel/bioc/html/EnrichedHeatmap.html) Enriched heatmap is a special type of heatmap which visualizes the enrichment of genomic signals on specific target regions. It is broadly used to visualize e.g. how histone marks are enriched to specific sites. There are several tools that can make such heatmap (e.g. [ngs.plot](https://github.com/shenlab-sinai/ngsplot) or [deepTools](https://github.com/fidelram/deepTools)). Here we implement Enriched heatmap by [ComplexHeatmap](https://github.com/jokergoo/ComplexHeatmap) package. Since this type of heatmap is just a normal heatmap but with some fixed settings, with the functionality of ComplexHeatmap, it would be much easier to customize the heatmap as well as concatenating a list of heatmaps to show correspondance between differnet data sources. ### Citation Zuguang Gu, et al., EnrichedHeatmap: an R/Bioconductor package for comprehensive visualization of genomic signal associations, 2018. BMC Genomics. [link](https://bmcgenomics.biomedcentral.com/articles/10.1186/s12864-018-4625-x) ### Install **EnrichedHeatmap** is available on [Bioconductor](http://bioconductor.org/packages/devel/bioc/html/EnrichedHeatmap.html), you can install it by: ```{r} if (!requireNamespace("BiocManager", quietly=TRUE)) install.packages("BiocManager") BiocManager::install("EnrichedHeatmap") ``` If you want the latest version, install it directly from GitHub: ```{r} library(devtools) install_github("jokergoo/ComplexHeatmap") install_github("jokergoo/EnrichedHeatmap") ``` ### Example Like other tools, the task involves two steps: 1. Normalize the accosiations between genomic signals and target regions to a matrix. 2. Draw heatmaps. ```{r} mat1 = normalizeToMatrix(H3K4me3, tss, value_column = "coverage", extend = 5000, mean_mode = "w0", w = 50) mat2 = normalizeToMatrix(meth, tss, value_column = "meth", mean_mode = "absolute", extend = 5000, w = 50, background = NA, smooth = TRUE) ``` ```{r} partition = kmeans(mat1, centers = 3)$cluster lgd = Legend(at = c("cluster1", "cluster2", "cluster3"), title = "Clusters", type = "lines", legend_gp = gpar(col = 2:4)) ht_list = Heatmap(partition, col = structure(2:4, names = as.character(1:3)), name = "partition", show_row_names = FALSE, width = unit(3, "mm")) + EnrichedHeatmap(mat1, col = c("white", "red"), name = "H3K4me3", row_split = partition, top_annotation = HeatmapAnnotation(lines = anno_enriched(gp = gpar(col = 2:4))), column_title = "H3K4me3") + EnrichedHeatmap(mat2, name = "methylation", top_annotation = HeatmapAnnotation(lines = anno_enriched(gp = gpar(col = 2:4))), column_title = "Methylation") + Heatmap(log2(rpkm+1), col = c("white", "orange"), name = "log2(rpkm+1)", show_row_names = FALSE, width = unit(5, "mm")) draw(ht_list, main_heatmap = "H3K4me3", gap = unit(c(2, 10, 2), "mm")) ```  Also when signals are discreate values. E.g. chromatin states:  Actually you can generate rather complex heatmaps: 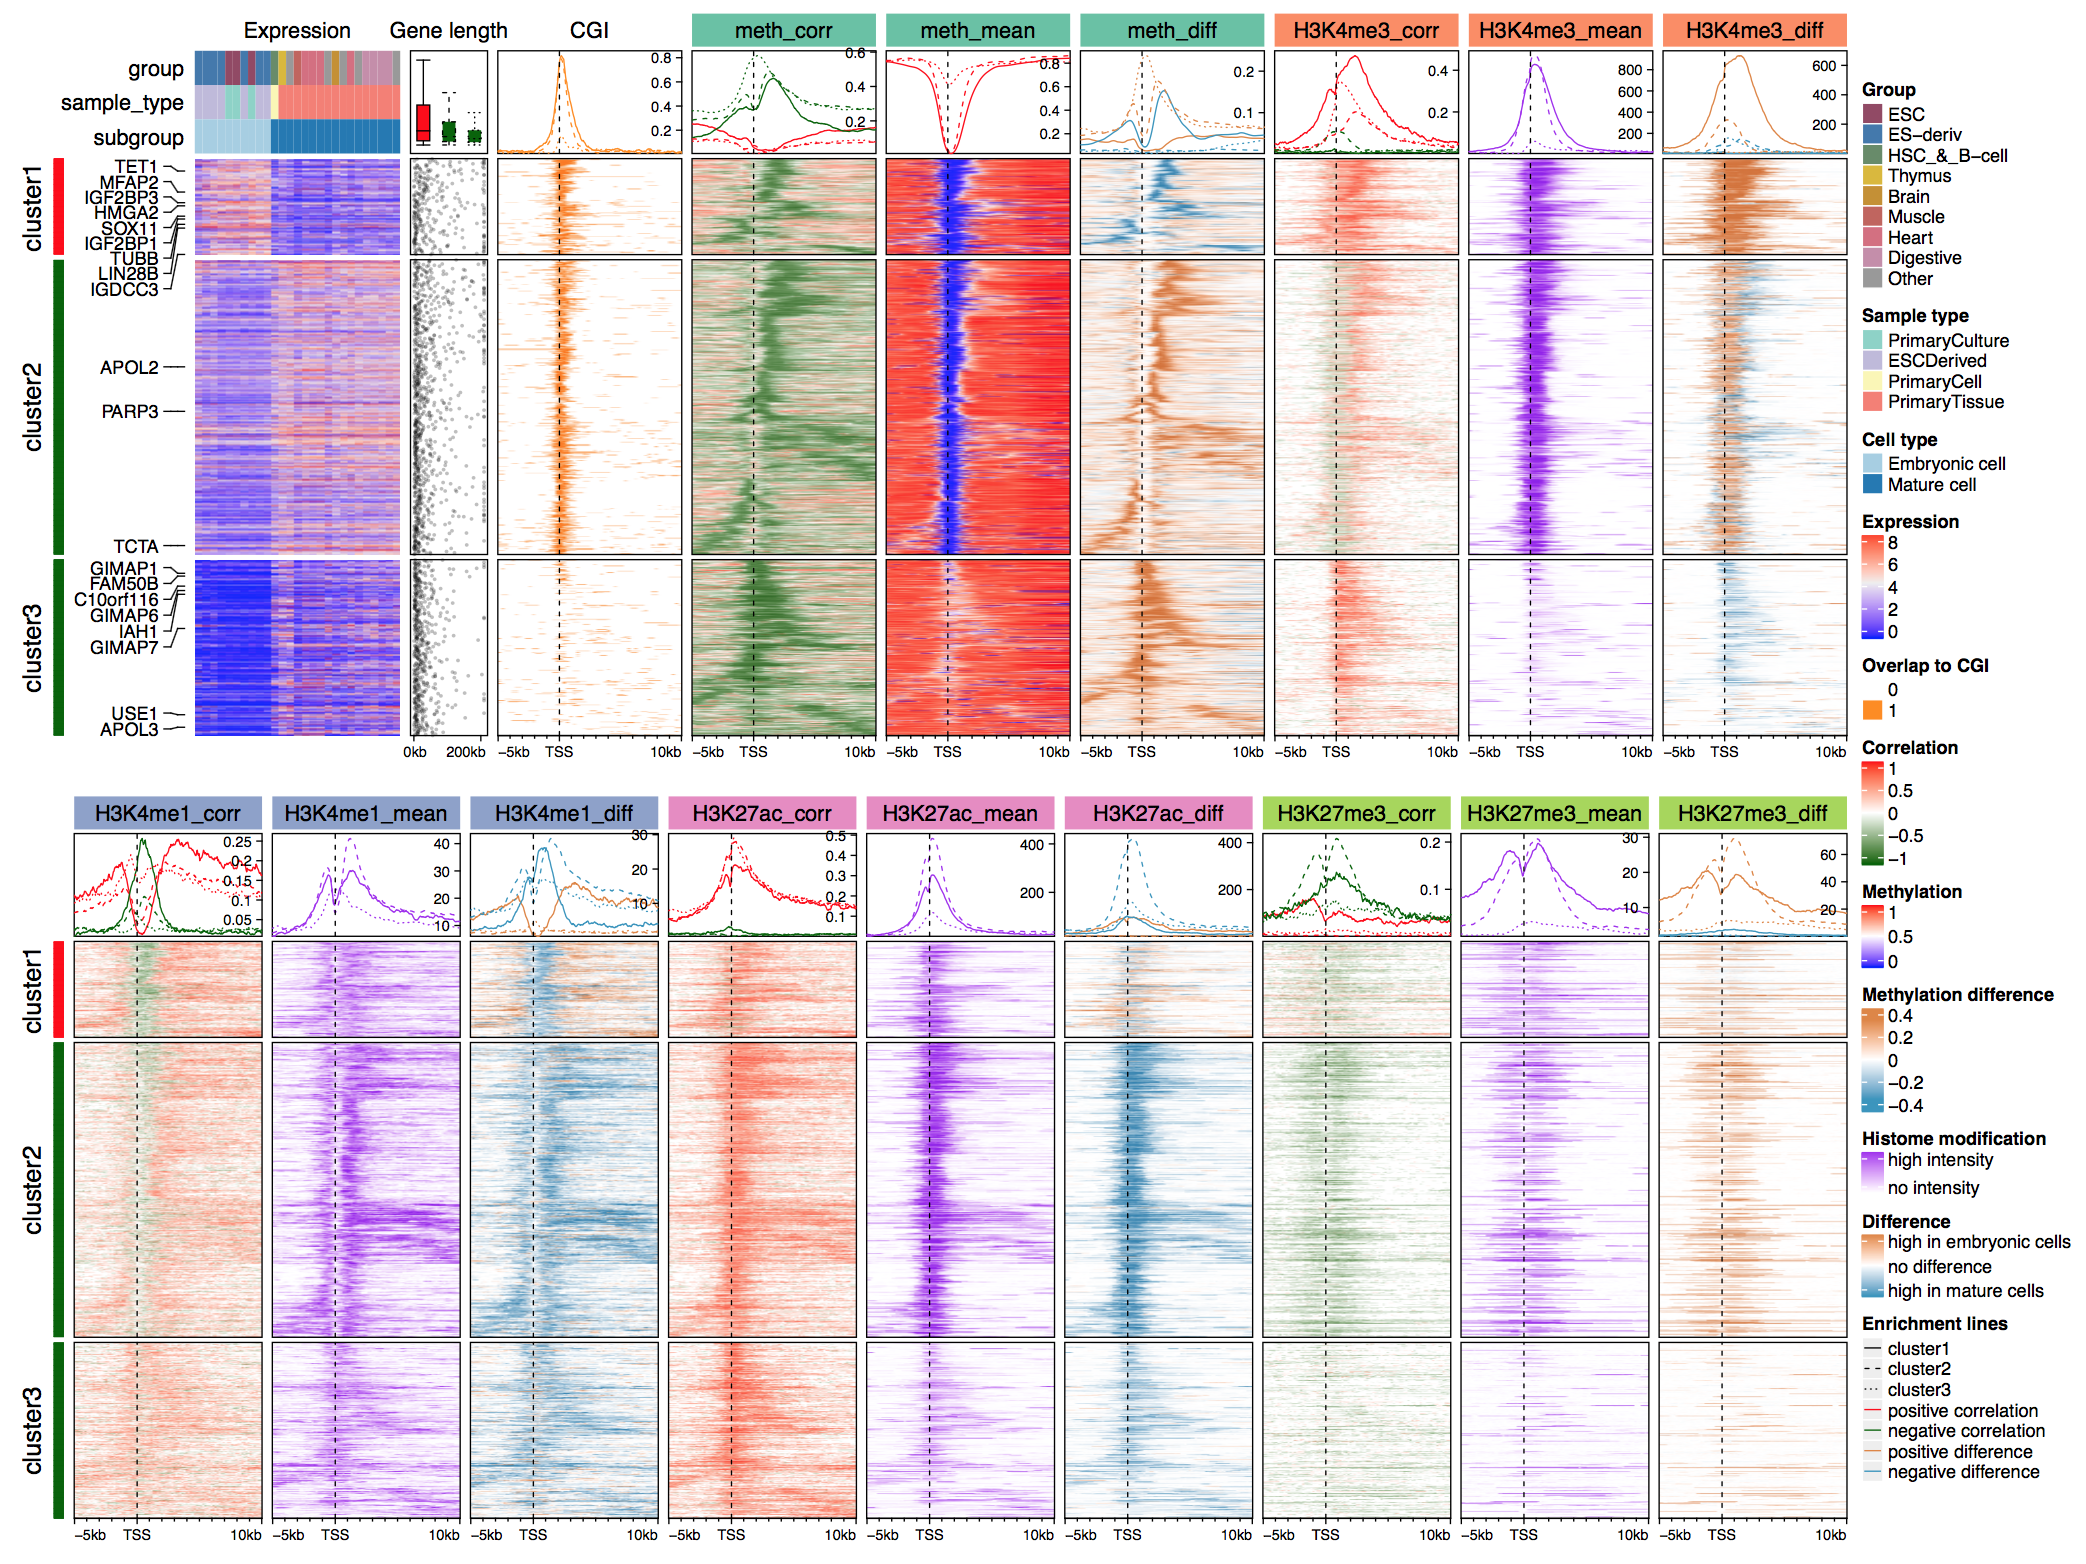 ### License MIT @ Zuguang Gu
](https://github.com/jokergoo/EnrichedHeatmap/workflows/R-CMD-check/badge.svg)\](https://github.com/jokergoo/EnrichedHeatmap/actions))
](https://img.shields.io/codecov/c/github/jokergoo/EnrichedHeatmap.svg)\](https://codecov.io/github/jokergoo/EnrichedHeatmap))
](https://bioconductor.org/shields/downloads/devel/EnrichedHeatmap.svg)\](https://bioconductor.org/packages/stats/bioc/EnrichedHeatmap/))
](http://www.bioconductor.org/shields/years-in-bioc/EnrichedHeatmap.svg)\](http://bioconductor.org/packages/devel/bioc/html/EnrichedHeatmap.html))