Must-Have Web Analytics Dashboard Templates | Databox (original) (raw)
Track some of the most common Web Analytics metrics and KPIs and analyze your Web Analytics performance with just a few clicks.
What is a Web Analytics Dashboard?
A web analytics dashboard displays your most important website data in one place and provides quick insights into how well your website is performing.
With the help of a web metrics dashboard, marketing and SEO teams are able to determine what’s happening on their site, which CTAs are most effective, and more, ultimately enabling them to make better data-driven decisions.
What Should Be Included in a WebAnalytics Dashboard?
A comprehensive web analytics dashboard should include any web data related to monitoring the performance of your website such as time spent on site, unique page visitors, page views, traffic sources, and bounce rate.
A carefully crafted web metrics dashboard should help inform your marketing and SEO strategy by answering how many people are seeing your website and pages, how many people are clicking from search engines to your pages, what is their average time on the page, and more.
How to Create a Web Analytics Dashboard
Create a new dashboard using our Designer tool
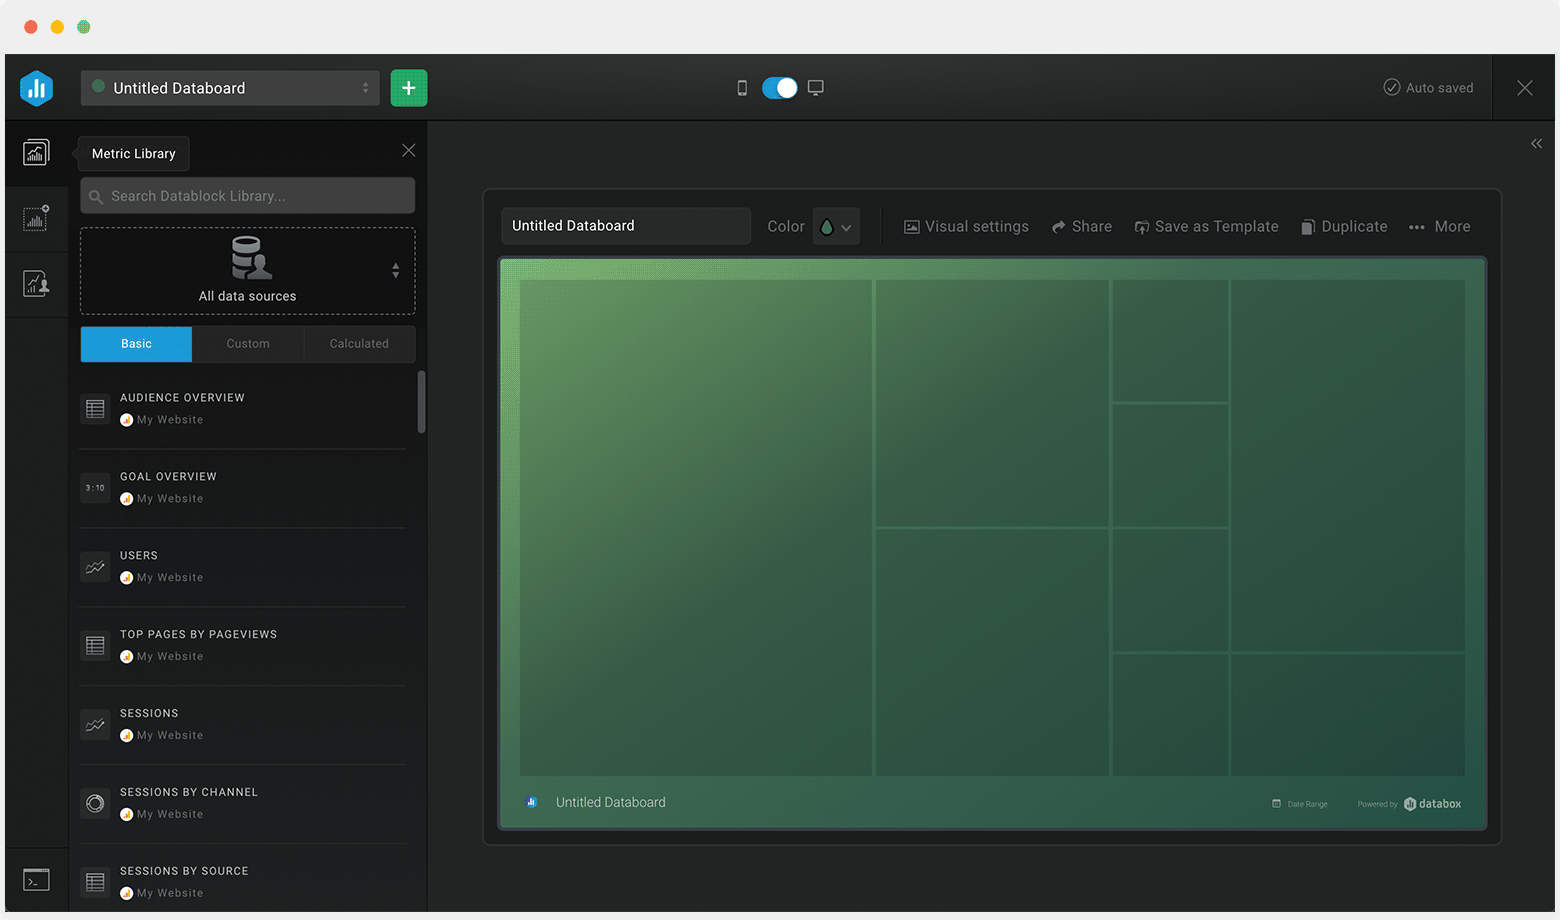
Create a new dashboard using our Designer tool
Name your dashboard
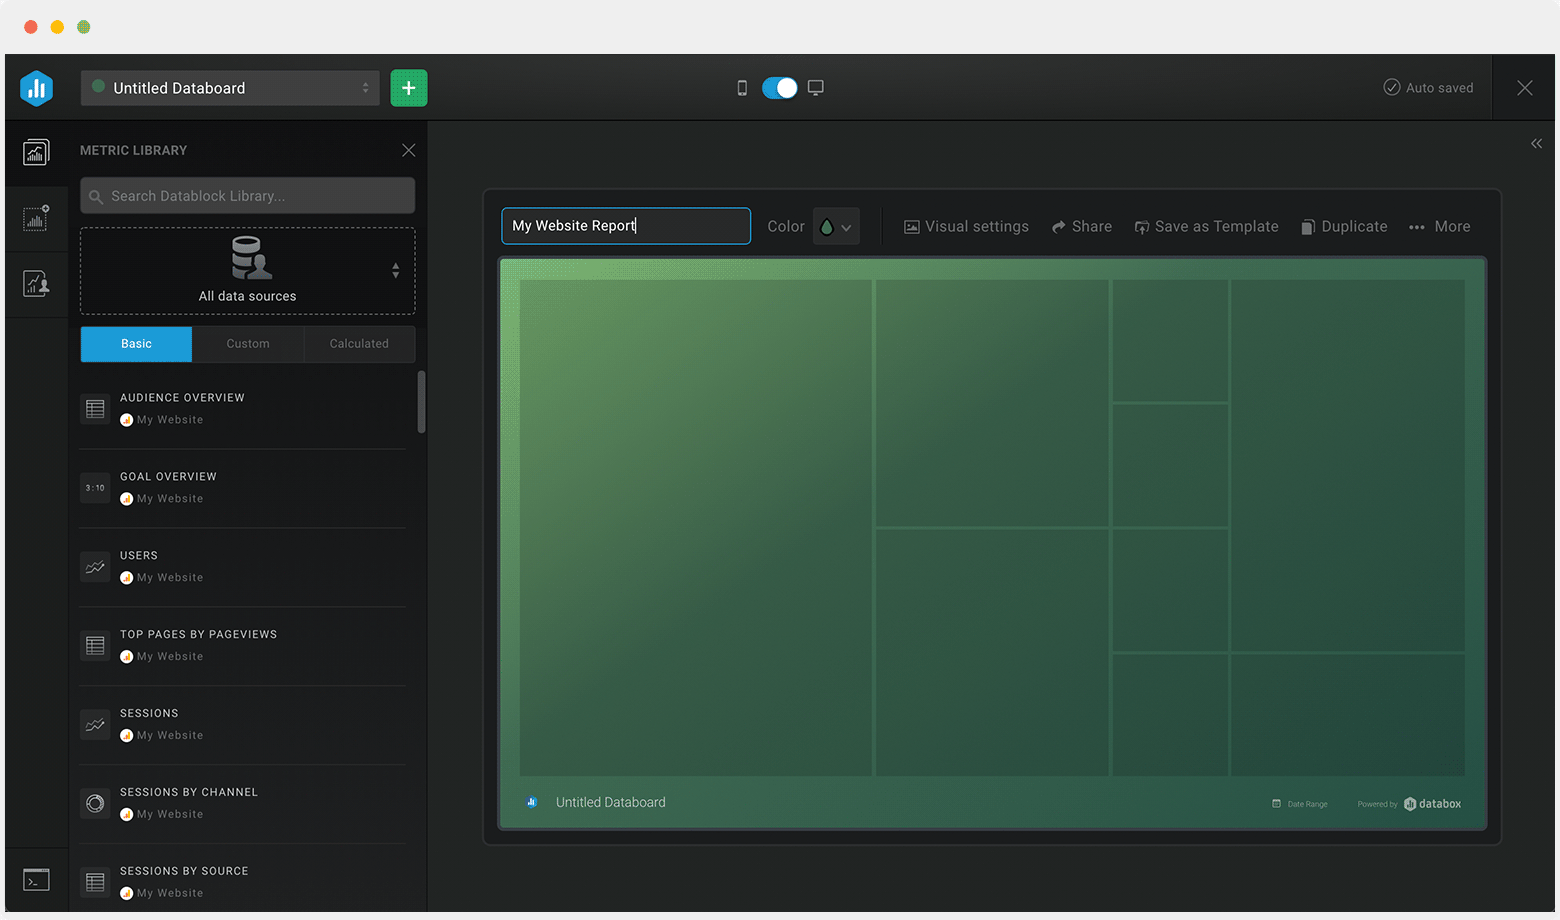
Name your dashboard
Select a data source
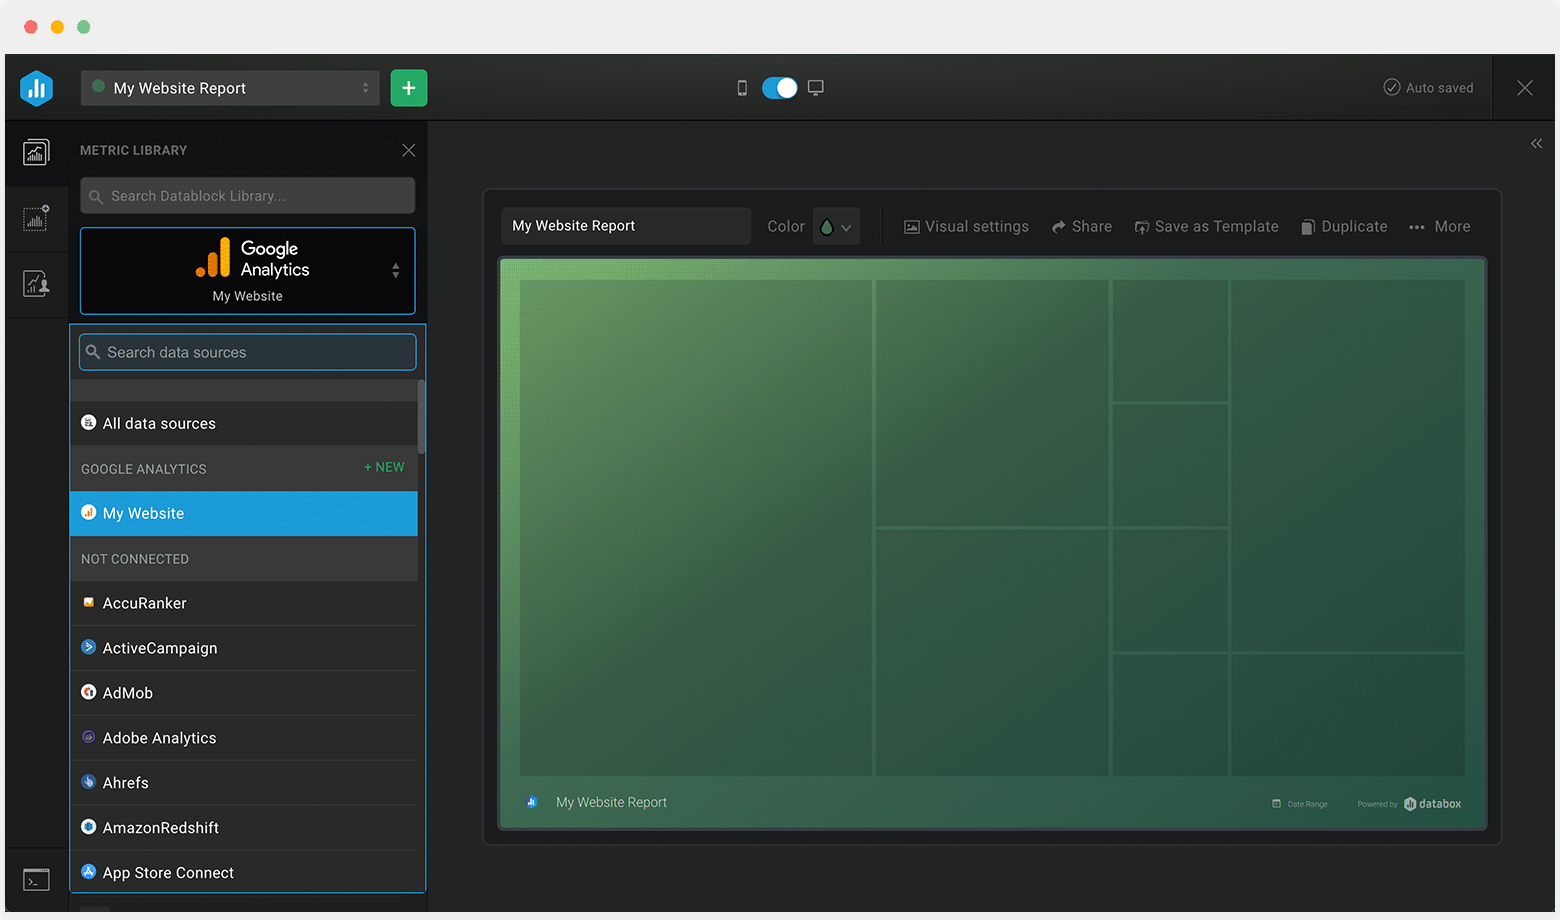
Select a data source
Drag-and-drop pre-built metrics from that source to your dashboard
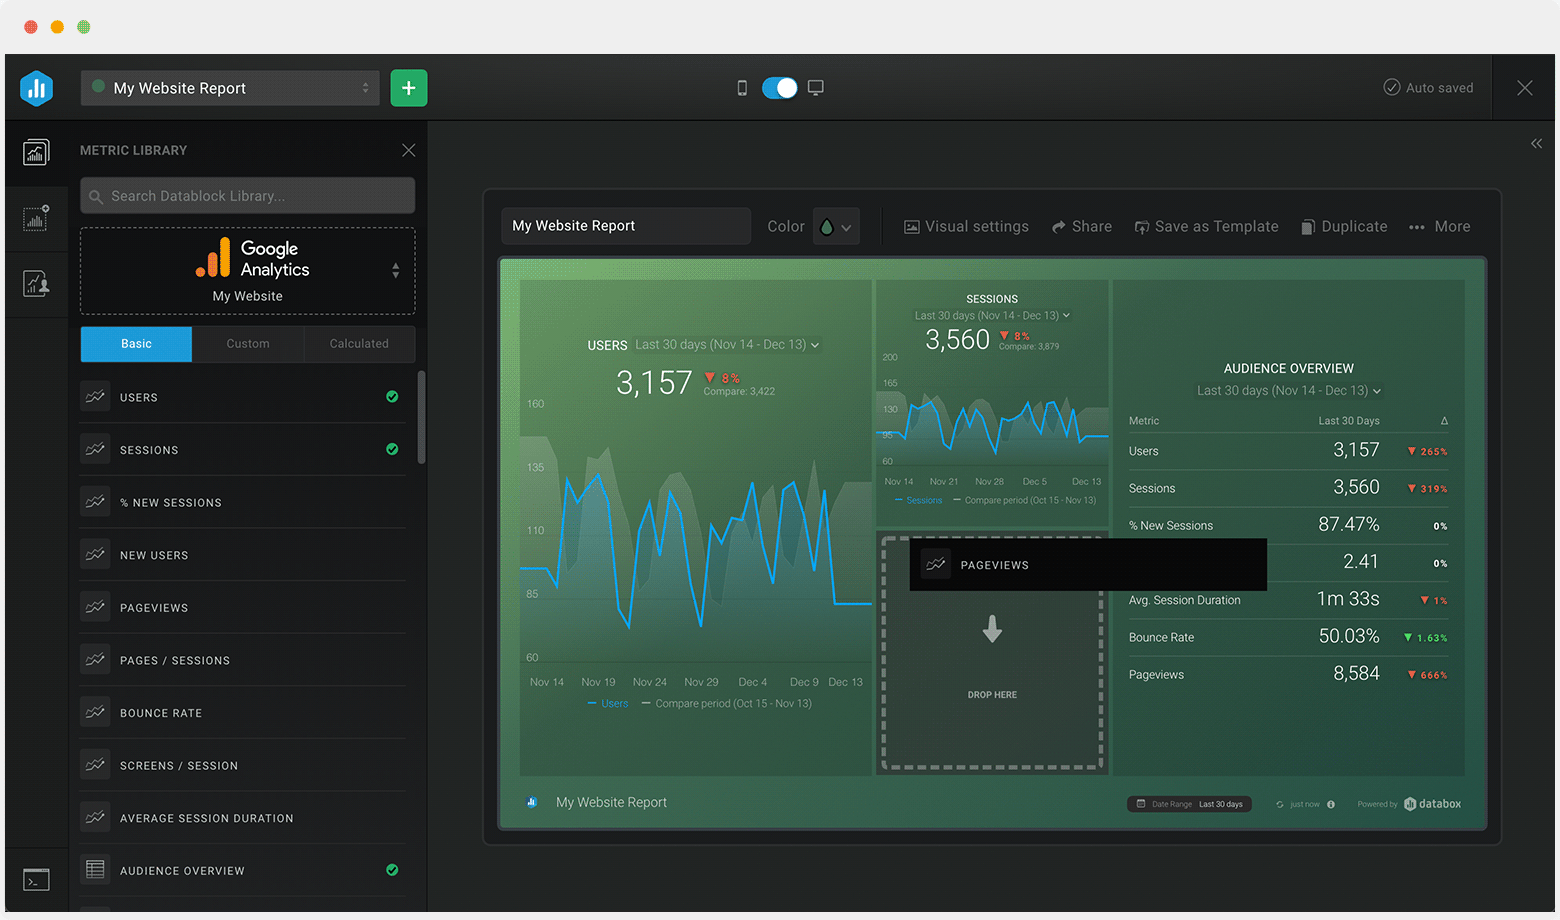
Drag-and-drop pre-built metrics from that source to your dashboard
Customize each metric block
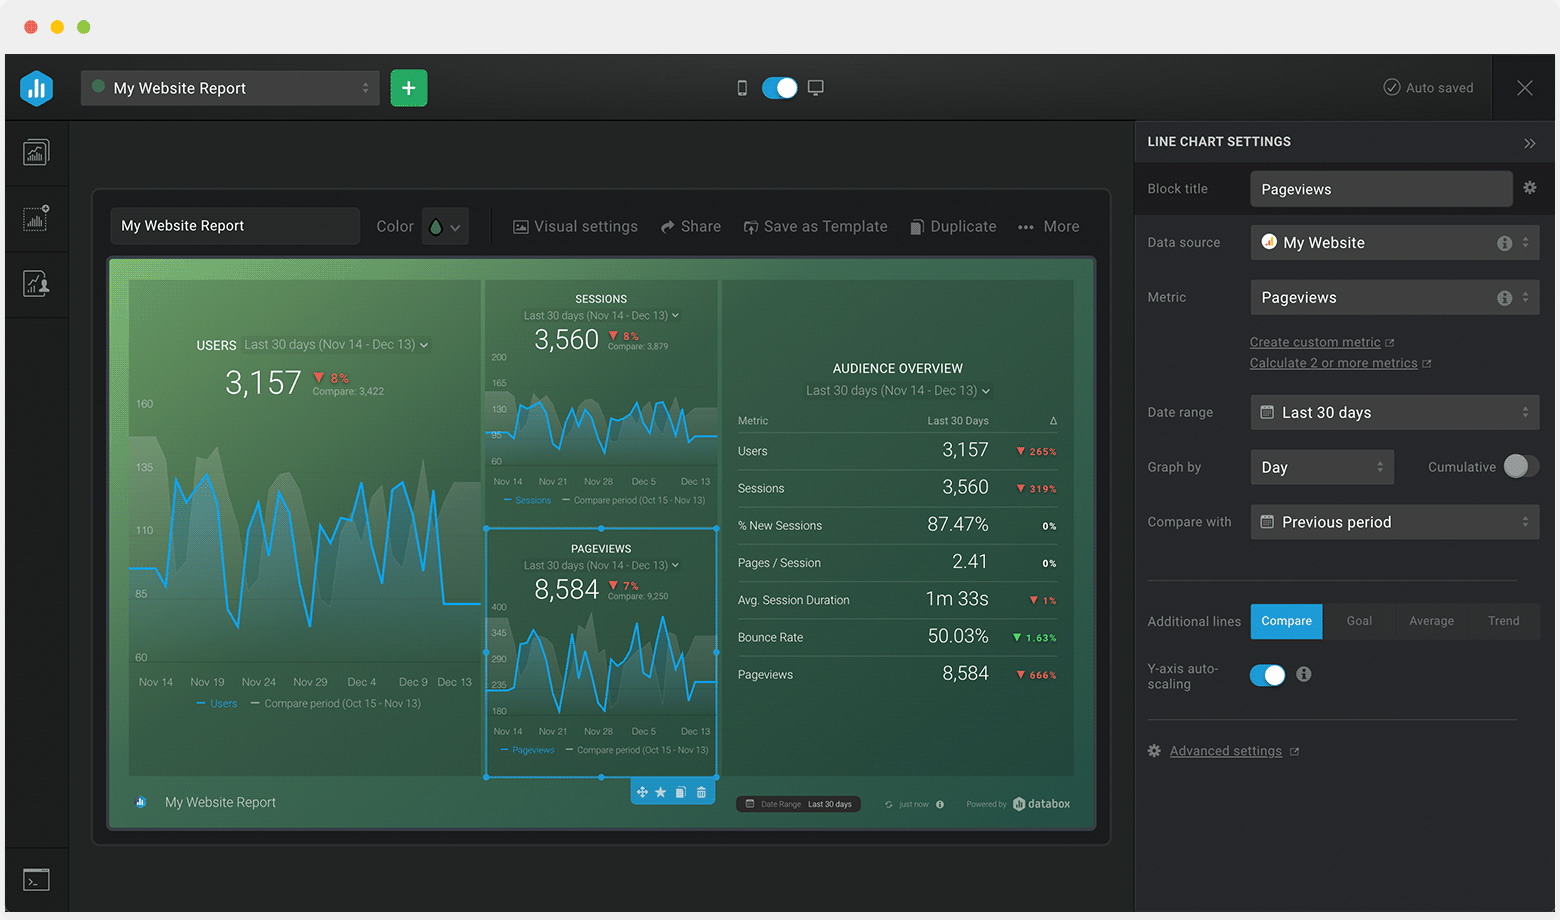
Customize each metric block