Dashboard Software for Growing Businesses | Databox (original) (raw)
Trusted by 20,000+ growing businesses
Create custom dashboards
in minutes, without code
FLEXIBLE VISUALIZATIONS
Find the perfect visualization to help viewers understand performance more clearly, and spot insights they couldn't see before.
CUSTOMIZABLE BRANDING
Add your own colors, logo, and background images, or white label your dashboards if you're sharing them with clients.
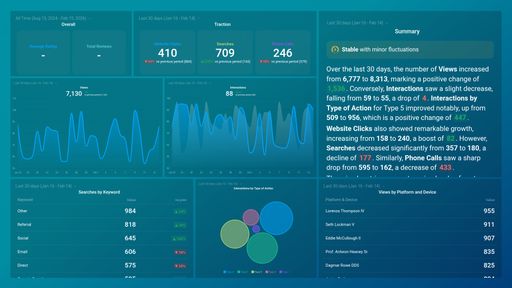
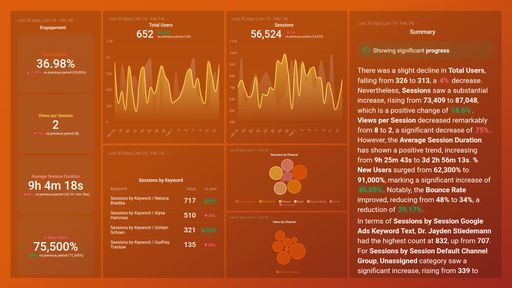
AI-POWERED SUMMARY
Our AI-powered summaries provide viewers more context on how performance has changed over time, along with ideas to improve.
FILTER BY DIMENSION
Quickly break down and filter dashboards by dimensions for deeper analysis.
METRIC DRILL-DOWN
Click any metric built from a dataset to reveal the row-level data behind it.
MULTIPLE PERIOD COMPARISON
Look back at multiple previous time periods, so you can do deeper analysis.
MOBILE APP
View how your team is performing anywhere, with our mobile app.
STREAM TO TV (UNIQUE TO DATABOX)
Share dashboards on TV screens to continuously display real-time performance, or present to your team or clients.
Databox is easy to use and allows us to use templates or create our own completely custom dashboards to track KPIs from many sources. It's a great way for our team to get an overview of marketing performance and identify trends quickly.

NO-CODE DESIGNER
Create powerful dashboards, without code
Just drag and drop the metrics you want to visualize, then toggle between visualizations or compare performance to other timelines in a few clicks.

- Drag & drop your metrics
- No-code editor
- Fully customizable
Other Features
- Use looped databoards to group 2 or more dashboards together. For example, loop your SEO, ads, and brand dashboards to better report your overall marketing performance.
- Protect your data with Force SSO, Two-Factor Authentication, Advanced Password Protection, and more.
- Share performance updates automatically, by sending a snapshot image of any dashboard via email or Slack.
- Add short text notes to specific dates to provide important context. Explain spikes or dips, or share when an event occurred that altered performance.
- Keep dashboards private, or make them visible to selected users, or let anyone access them if you need to share them publicly.
Create your first dashboard in 1 click
Start with one of our popular dashboard templates and customize it to your needs.
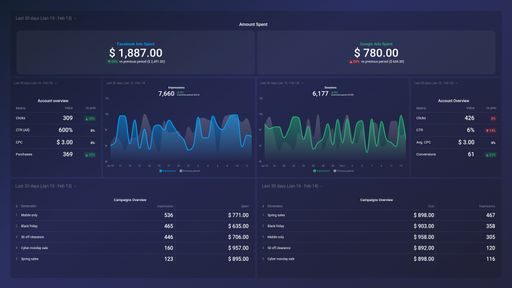
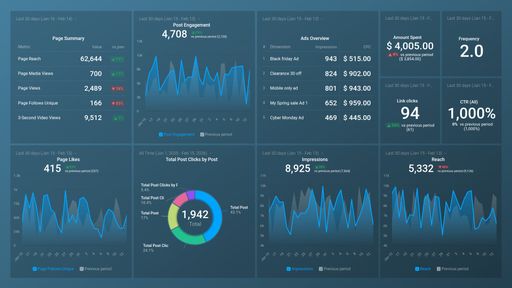
Facebook Ads Performance Overview
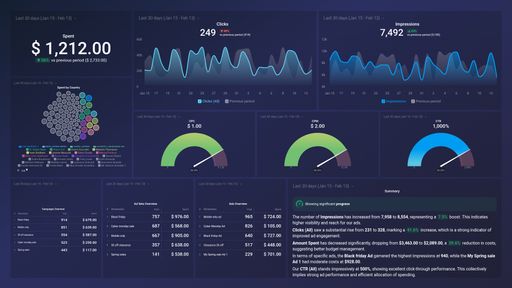
Facebook Ads dashboard template provides you with insights about ad engagement, click activity, money spent and more. You can discover which campaigns need improvement.

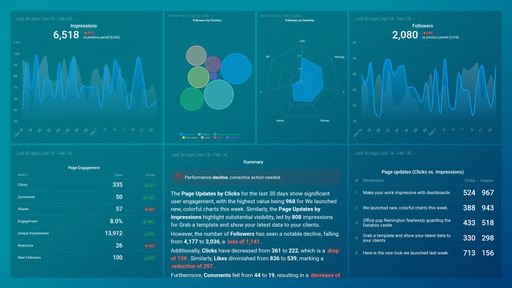
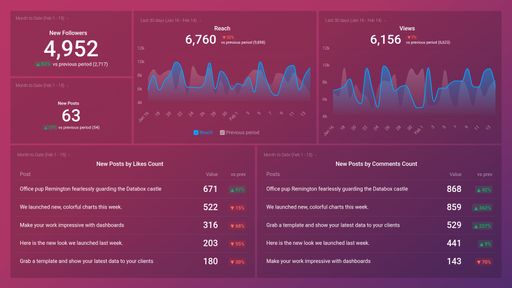
Facebook Page Insights
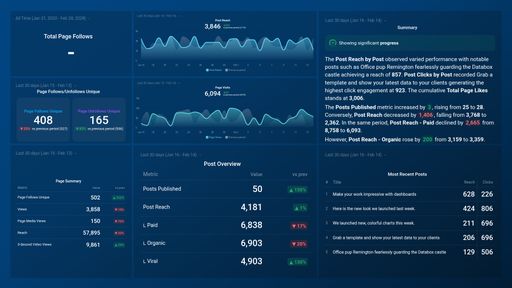
Facebook dashboard template provides you with insights about page views, likes post reach which will help you to know more about page followers.

Google Ads Performance Overview
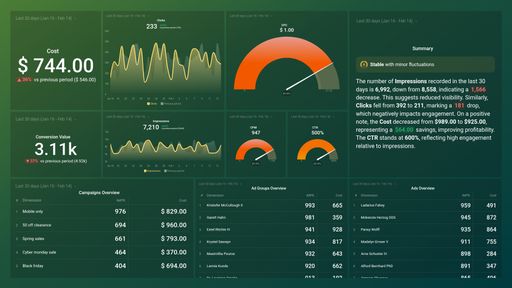
Analyze your campaigns, ad groups, keywords and engagement metrics to improve your return on investment (ROI).

Website Engagement Overview
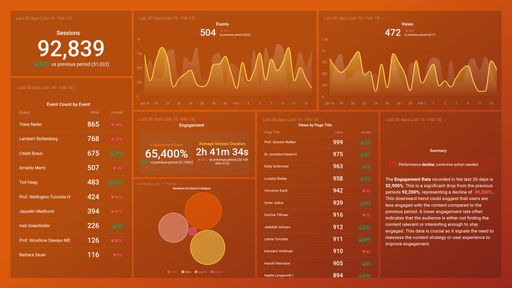
Download this dashboard to measure the overall engagement of your website and app visitors. Get insights into how visitors interact with your most important pages, which actions are they taking, how much of their time they're giving you and more

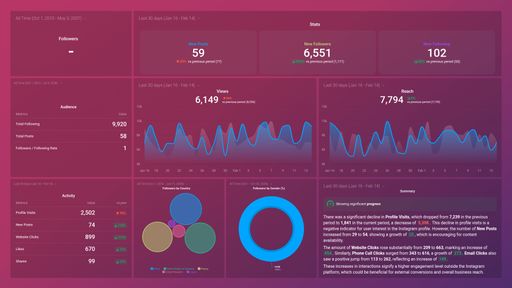
Instagram Business Profile Overview
Instagram dashboard template provides you with insights about your overall account health and performance and will help you to know more about your Instagram followers.

LinkedIn Company Pages Overview
LinkedIn Company pages dashboard template provides you with insights about followers growth, reach, engagement and more.

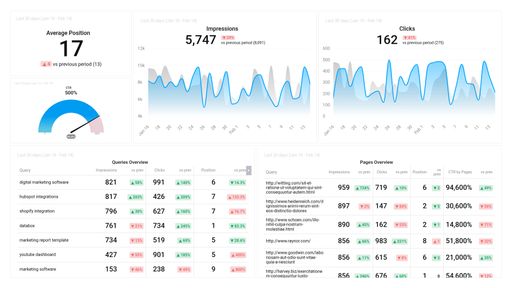
Google Search Console Performance
The Search Console Basics dashboard reveals which pages are most visible on SERPs and which ones actually drive organic traffic.

HubSpot CRM Overview Performance
HubSpot CRM dashboard template provides you with insights about deals and sales pipelines which will help you to track, and grow your pipelines.

Google Business Profile Performance
This template will provide you with greater visibility and more control over how your business is displayed in search results.

HubSpot Marketing Performance
HubSpot Marketing dashboard template provides you with insights to increase traffic, convert leads, and prove ROI.

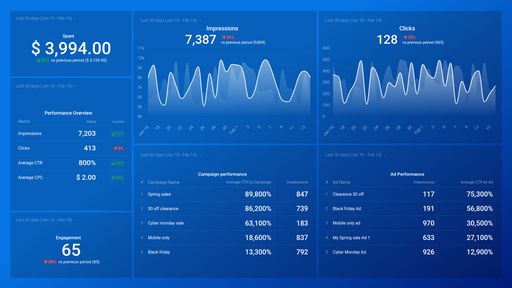
Facebook Ads & Google Ads Dashboard
The Facebook Ads & Google AdWords template allows you to monitor both your Facebook and Google campaigns at the same time to track your progress and areas to improve upon.
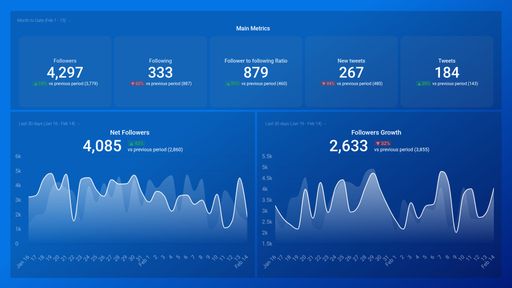
X (Twitter) Account Overview
The Twitter dashboard template shows how your followers engage with your Tweets. It will track growth in likes, comments, follows, mentions and retweets.

Google Analytics 4 Website traffic
Google Analytics 4 dashboard template which will give you insights about your users, sessions, referrals and more.
Shopify Sales Performance
Shopify dashboard template which will give you insights and a complete control over your Shopify store.

Website Acquisition Overview
Download this Google Analytics 4 Acquisitions dashboard template to dig deeper into your traffic sources, monitor user behavior, and keep an eye on how it all impacts your revenue.
Mailchimp Campaign Performance
Mailchimp dashboard template provides you with insights about your subscribers growth, audience and campaign performance to grow your business—all in one place.

Facebook Pages & Facebook Ads: Engagement Summary
This Dashboard gives a clear overview of your Reach, Campaign Performance and Community Activity based on Facebook Pages and Facebook Ads metrics.
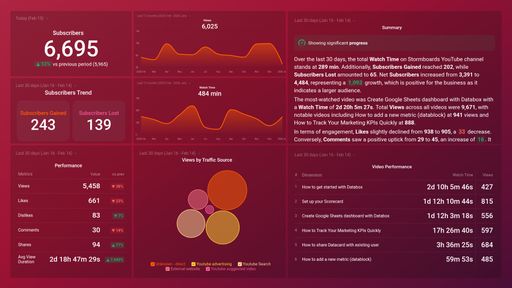
YouTube Channel Performance
The YouTube Channel Performance dashboard makes it easy to measure video engagement with multiple metrics.

LinkedIn Ads Account Overview
This dashboard shows a high-level overview of your Linkedin Ads performance so you can track ROI.

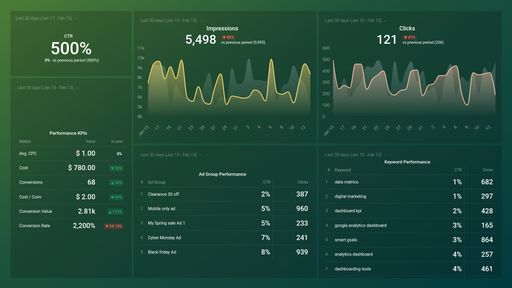
Google Ads PPC Performance
The AdWords PPC dashboard template gives a complete view of all the fundamental ad metrics, including cost-per-click, click-through rate and impressions.
Instagram Business Post Performance
This template looks at the actions and performance of your posts. It will help you or your team focus on what matters - engaging more followers.
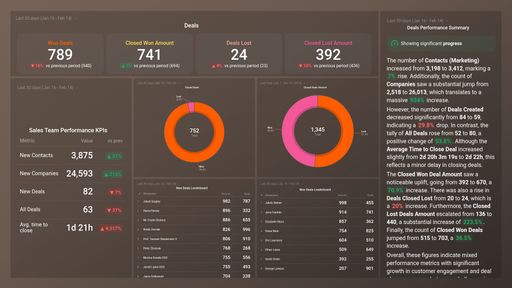
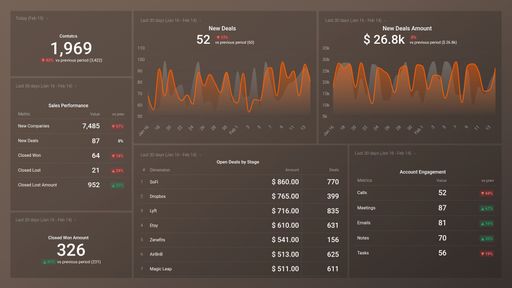
HubSpot CRM Deals Performance
A visual snapshot of monthly performance by the sales team.
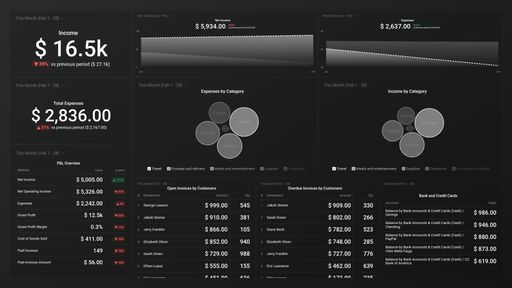
Quickbooks Income & Expenses Cash Overview
Quickbooks dashboard template provides you with insights about cash flow, bank accounts, sales and expenses enterred in Quickbooks to stay on top of your business.

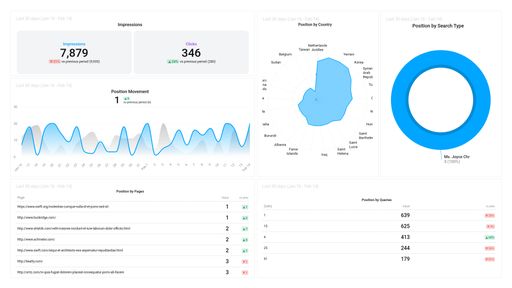
Google Search Position Overview
Improve your Google Search position by gaining deeper insights into which pages have the best opportunity to rank on page 1 of Google.
Get more out of your dashboard tool
Use your dashboards with other tools in our platform
Visualize all your metrics and KPIs side by side
Add dashboards to your automated reports
Customer stories
Learn how other growing businesses are using dashboards to inform decisions, create plans, and drive growth.

How Novi Digital Improved Client Reports and Improved Their Business Tenfold
Read story

Palram Reduces Cost Per Lead by Up to 20% Using Databox
Read story

![]()
How ClickLearn Secured 10x More Ad Spend by Proving ROI with Databox
Read story


Digital Wasabi Cut Client Onboarding Time by 90% and Improved Retention with Databox
Read story
Explore dashboard examples
Use your dashboards with other tools in our platform
Frequently asked questions
Yes! Everyone starts with a free 14-day trial of the Growth plan. After your trial, choose to purchase any plan that best suits your needs.
How can I share my dashboard?
In Databox, you have multiple sharing options.
- Shareable Link:Dashboards can easily be shared and accessed through a link. It will display your dashboard(s) with the same date range options and visualizations you have set in your account. Shareable Links are best for sharing live data with your teams, executives, or clients.
- Scheduled Snapshots:You canexport your dashboards into PDFs or JPGs at regular time intervals. Scheduled Snapshots are best for sharing static views of your data (regularly) with the relevant recipients. The best part is that recipients don’t need to be Databox users.
- Embeds:You can embed your dashboards on web pages or tools like ClickUp/Notion. Embeds allow you to incorporate your insights directly into your existing workflow.
- Stream To TV: With Databox, you caneasily stream your dashboard on a Smart TV. This option is valuable for sharing insights in office settings, team meetings, or presentations.
Are dashboards interactive?
Yes, dashboards in Databox are interactive. Here are a few ways you can engage with the data:
- Hovering over data points to view specific values.
- Adjusting date ranges for individual visualizations.
- Updating visualizations with a single click.
- Choosing which lines (metrics, trend, goals) to view on charts.
Can I create dashboards combining data from different sources?
Yes!
In fact, we recommend doing this to get a comprehensive view of performance. Inside the dashboard builder, you can swap through different data sources you’ve connected and pull whatever metrics you need right into your dashboard. Here’s how you can create a dashboard using data from multiple data sources.
Can I change the logo and customize my dashboard?
Yes, you can change the colors of your dashboards and charts. And customize the logo on your dashboards to reflect your brand. Even better, you can provide create a fully branded experience with the white-label add-on. Personalize the login screen, URL, mobile app, and much more.
Can I combine multiple dashboards?
Yes! Dashboard Loops allows you to group multiple dashboards together to tell a more comprehensive story with your data. They’ll be joined together on one Shareable link that you can then share with your team and/or clients. You can add up to 20 dashboards to a loop.
How many dashboards can I create?
All plans offer an unlimited number of dashboards. Learn more about plans and packaging here.
Can I view my dashboards on my phone?
Yes, using our Databox mobile app for iOS and Android. And, you can receive your daily scorecards, weekly summaries, and performance alerts directly to your mobile phone.