Introducing C++ Build Insights - C++ Team Blog (original) (raw)
C++ builds should always be faster. In Visual Studio 2019 16.2, we’ve shown our commitment to this ideal by speeding up the linker significantly. Today, we are thrilled to announce a new collection of tools that will give you the power to make improvements of your own. If you’ve ever had time for breakfast while building C++, then you may have asked yourself: what is the compiler doing? C++ Build Insights is our latest take at answering this daunting question and many others. By combining new tools with tried-and-tested Event Tracing for Windows (ETW), we’re making timing information for our C++ toolchain more accessible than ever before. Use it to make decisions tailored to your build scenarios and improve your build times.
Getting started
C++ Build Insights makes use of vcperf, a tool that allows you to capture a trace of your build and to view it in the Windows Performance Analyzer (WPA). The latest version of vcperf is available in Visual Studio 2019, but WPA must be obtained separately.
1. Follow these steps to obtain and configure vcperf and WPA:
- Download and install the latest Visual Studio 2019.
- Obtain WPA by downloading and installing the latest Windows ADK.
- Copy the perf_msvcbuildinsights.dll file from your Visual Studio 2019’s MSVC installation directory to your newly installed WPA directory. This file is the C++ Build Insights WPA add-in, which must be available to WPA for correctly displaying the C++ Build Insights events.
- MSVC’s installation directory is typically:
C:\Program Files (x86)\Microsoft Visual Studio\2019\{Edition}\VC\Tools\MSVC\{Version}\bin\Hostx64\x64. - WPA’s installation directory is typically:
C:\Program Files (x86)\Windows Kits\10\Windows Performance Toolkit.
- MSVC’s installation directory is typically:
- Open the perfcore.ini file in your WPA installation directory and add an entry for the perf_msvcbuildinsights.dll file. This tells WPA to load the C++ Build Insights add-in on startup.
You can also obtain the latest vcperf and WPA add-in by cloning and building the vcperf GitHub repository. Feel free to use your built copy in conjunction with Visual Studio 2019!
2. Follow these steps to collect a trace of your build:
- Open an elevated x64 Native Tools Command Prompt for VS 2019.
- Obtain a trace of your build:
- Run the following command:
vcperf /start MySessionName. - Build your C++ project from anywhere, even from within Visual Studio (vcperf collects events system-wide).
- Run the following command:
vcperf /stop MySessionName outputFile.etl. This command will stop the trace, analyze all events, and save everything in the outputFile.etl trace file.
- Run the following command:
- Open the trace you just collected in WPA.
At the crux of the matter with the Build Explorer
Central to understanding a build is having an overview of what happened through time. The Build Explorer is a core element of C++ Build Insights that we designed for this purpose. Drag it from the Graph Explorer panel on the left onto the main analysis window in WPA. Use it to diagnose parallelism issues, detect bottlenecks, and determine if your build is dominated by parsing, code generation, or linking.
A thousand scoffs for the thousand cuts: aggregated statistics
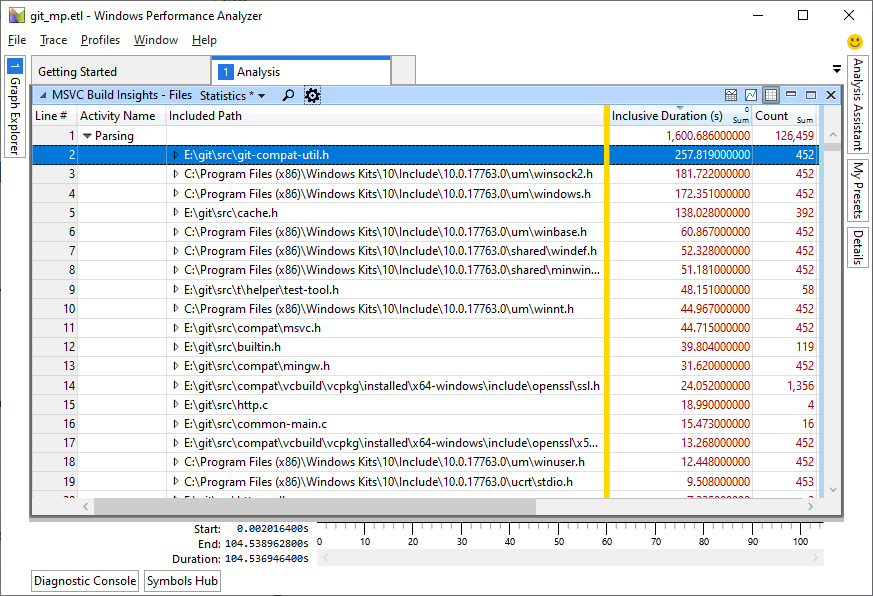
The most insidious of build time problems are the ones that strike you little by little until the damage is so large that you wonder what hit you. A common example is the repetitive parsing of the same header file due to its inclusion in many translation units. Each inclusion may not have a large impact by itself but may have devastating effects on build times when combined with others. C++ Build Insights provides aggregated statistics to assist you in warding off such threats. An example of this capability is illustrated below, where file parsing statistics are aggregated over an entire build to determine the most time-consuming headers. To view this information for your build, choose the Files view from the Graph Explorer panel on the left in WPA. Drag it to the analysis window.

What information can you get?
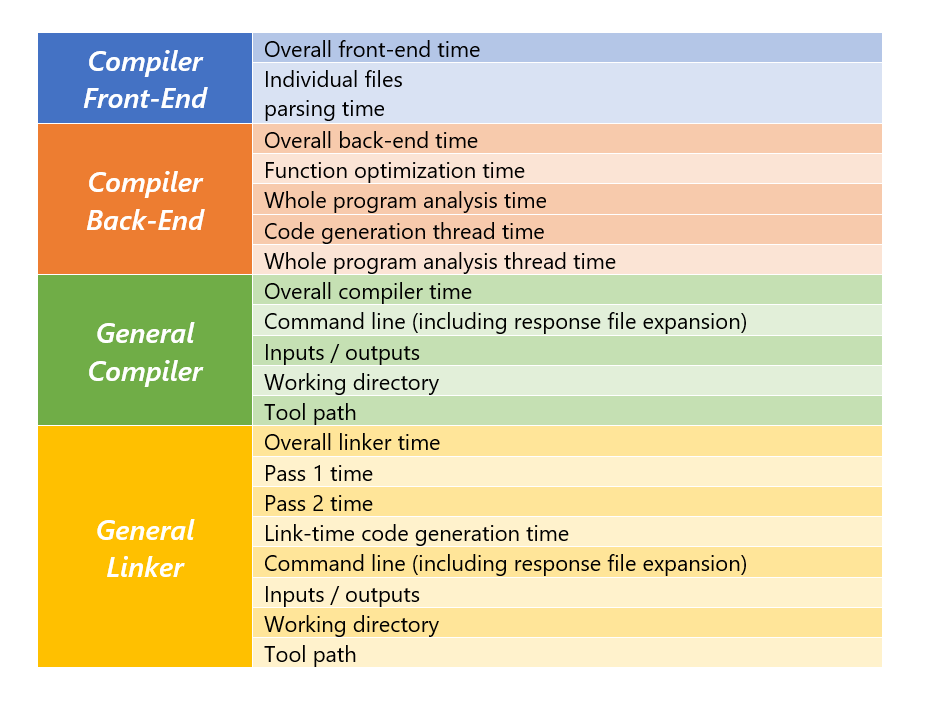
With C++ Build Insights, expect to be able to obtain the following information for all your compiler and linker invocations.

Tell us what you think!
Download your copy of the latest Visual Studio 2019, and get started with C++ Build Insights today! For a complete set of documentation, see the Get started with C++ Build Insights page.
In this article, we shared two features with you, but there is much more to come! Stay tuned for more blog posts detailing specific ways in which you can use C++ Build Insights to improve your builds.
We look forward to hearing from you on how you used vcperf and WPA to understand and optimize your builds. Are there any other pieces of information you would like to be able to get from C++ Build Insights? Tell us what you think in the comments below. You can also get in touch with us at visualcpp@microsoft.com, or on Twitter @VisualC.
Author
Engineer working on MSVC.