Introducing vcperf /timetrace for C++ build time analysis - C++ Team Blog (original) (raw)
The following blog post was written by guest author Carlos Fraguas from Mercury Steam Entertainment. He describes how he used the C++ Build Insights SDK to add the new /timetrace option in vcperf, and how he also used it to build custom tools tailored to his team’s needs. You can follow Carlos on Twitter using handle @MetanoKid.
Hello! I’m Carlos Fraguas and I work as a Gameplay Programmer at Mercury Steam Entertainment. Let’s look at how the C++ Build Insights SDK helped me create tools to decrease build times and how I ended up adding a new visualization option into vcperf.
Background
There’s one thing programmers dislike the most: waiting for the project to compile. Well, yes, we’ve all laughed with this XKCD comic:
Source: XKCD.com (https://xkcd.com/303/) License: https://xkcd.com/license.html
But it’s really frustrating just watching a progress bar moving up! Long build times discourage iterations in both your project’s features and architecture (i.e. refactoring is costly), so we could argue that keeping your iteration cycle short is key for your team.
Some time ago I started worrying about slow build times and tried to find some tools that could help me find bottlenecks in our build process. It wasn’t until the C++ Build Insights SDK and vcperf were released that I could start making real and informed progress towards speeding them up!
There was an issue, though: by the time I started investigating, I wasn’t as familiar with MSVC as my Engine Programmer teammates. And that’s where vcperf truly shined: by giving me a visual representation of the build! I could then understand the amount of work that the compiler and linker are doing, and how it’s structured.
However, now that the SDK was available, I wanted to give it a try myself and create some custom reports, tailored for our team and projects. It felt astonishingly easy to set up and get useful info. And yes, it’s as straightforward as Kevin explains in his posts about finding build bottlenecks or profiling metaprograms!
Among those reports, and inspired by Aras Pranckevičius, I set myself to add an alternative visualization output for vcperf.
/timetrace
The new /timetrace option lets you build a flame graph viewable in any Chromium-based browser, like the new Microsoft Edge. These are some of its key features:
- Easily visualize execution hierarchies: related activities are kept close together.
- See what’s going on in the compiler’s front-end and back-end: which files are getting included or how slow code generation is.
- Outline expensive function and template instantiations: if it’s on the graph, it may be an issue!
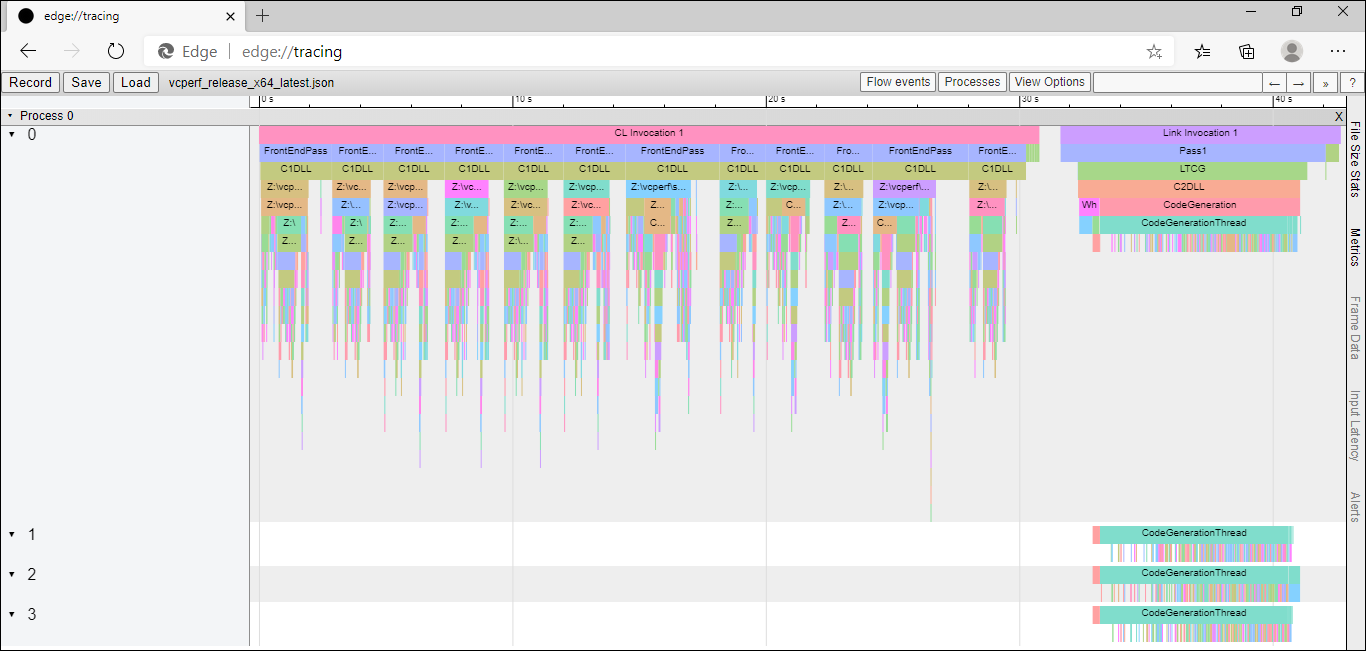
A flame graph showing _vcperf_’s build:
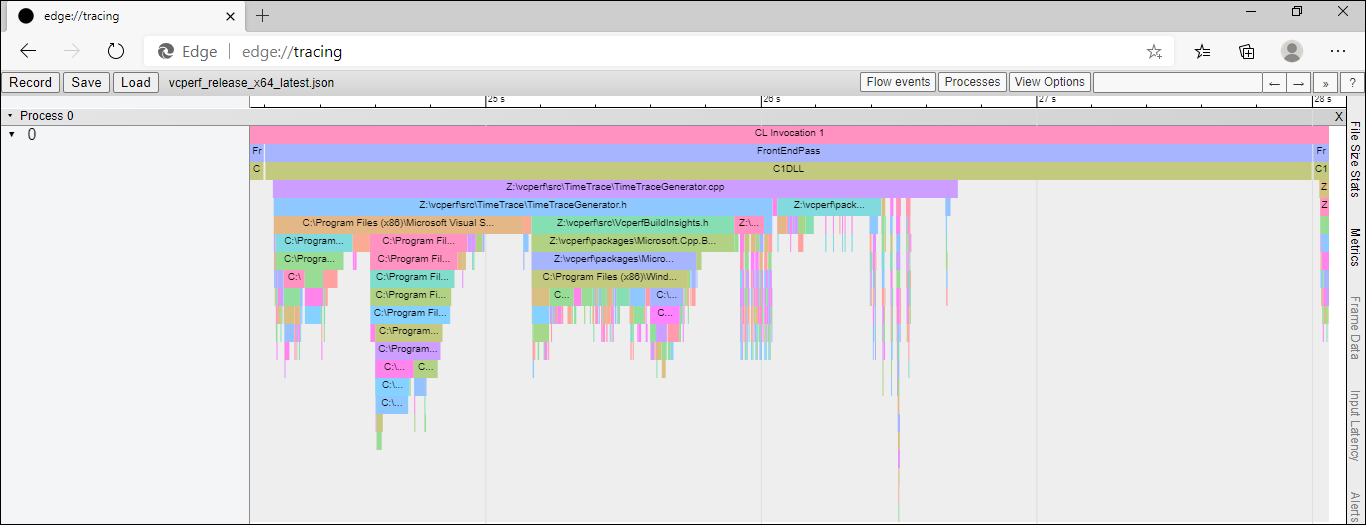
A zoom into one of the files in _vcperf_’s build:
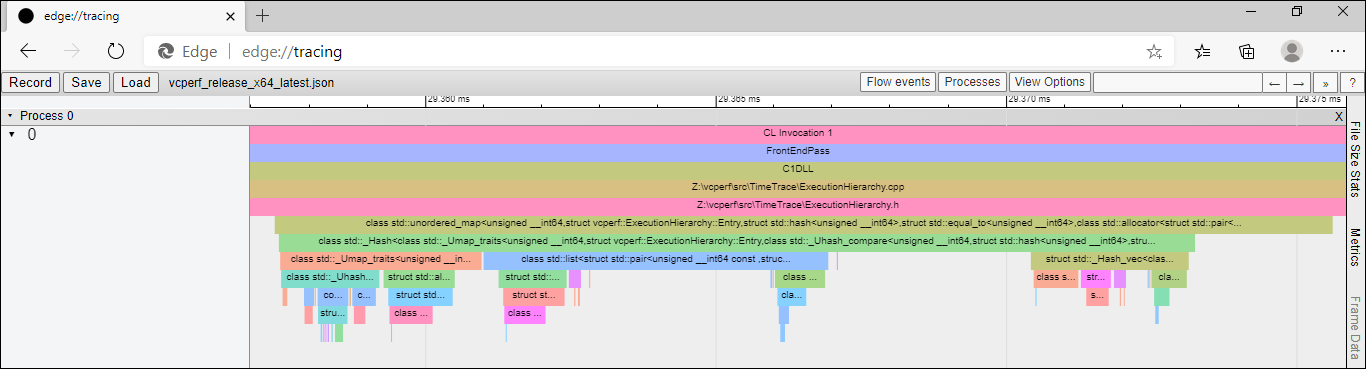
A zoom into _vcperf_’s build showing template instantiations:
To generate these graphs yourself, follow these steps:
- Clone vcperf from GitHub.
- Obtain a trace of your build:
- Open an elevated command-line prompt.
- Run the following command:
vcperf /start SessionName - Build your C++ project from anywhere, even from within Visual Studio (vcperf collects events system-wide).
- Run the following command:
vcperf /stop SessionName /timetrace outputFile.json. This command will stop the trace, analyze all events and save the flame graph in the outputFile.json trace file.
- Open the trace you just collected by navigating to edge://tracing in Microsoft Edge and start exploring!
This is what /timetrace does under the hood:
- Loads up the trace.
- Subscribes to SDK’s OnStartActivity and OnStopActivity to build hierarchies using parent-child relationships.
- Applies filters to keep relevant data only (i.e. functions that compile very quickly may not be interesting).
- Calculates new process and thread IDs to keep hierarchies together (instead of using the raw IDs).
- Outputs the graph in the expected format.
How the SDK helped us
Using the C++ Build Insights SDK wasn’t useful just for visualizing our build process. We’ve managed to create a number of small tools to keep analyzing future builds. These were some specific cases where the SDK helped us:
- We found a particular default constructor, defined by the compiler, that was taking ~3% of our total build time. That file was included hundreds of times so the constructor got defined once per inclusion. We ended up implementing it ourselves in the cpp file to cut that number to one!
- We detected unnecessary #include clauses in header files. These were in turn including a lot of headers and that made them slow to be processed by the front-end. We were able to convert a lot of them to forward declarations and reduced coupling!
- We built inclusion graphs for our files using the .dgml format. Again, visualizing data really helps!
- We decreased the number of compilation batches within a project by unifying compiler options for all of its files (except PCH!), effectively increasing compilation parallelism. In particular, we had two files that ended up creating .obj files with the same name. We had fixed it by modifying the ObjectFileName to $(IntDir)\%(RelativeDir)\. However, this created as many compilation batches as folders (which usually had a small number of files and yielded idle cores waiting for the next batch to kick off). We solved it by renaming one of the files and restoring the original ObjectFileName to go back to having a single batch!
- We were warned about missing /MP flags in some third-party libraries that we compile as part of the build process.
- We found template classes that were expensive to generate and we could refactor.
As you can see, the information provided by the SDK helped us in several areas!
Final words
Before we finish, I wanted to thank the team behind the C++ Build Insights SDK and vcperf for these tools, and Kevin Cadieux in particular for all the time and effort put into reviewing /timetrace.
I hope this new feature helps you make more informed decisions when investigating your build times and empowers you to create your own tools. Feel free to clone the vcperf repo, explore /timetrace and tweak it to your needs!
Thanks for reading!
Carlos.
Author

Engineer working on MSVC.