Understanding Exceptions while debugging with Visual Studio - Azure DevOps Blog (original) (raw)
January 7th, 2015
 1 reaction

Partner Director of Product
This post has been updated to reflect *the experience while using Visual Studio 2015.* If you have spent any time coding, odds are that you have had to deal with Exception Handling. In Visual Studio, when exceptions are thrown or end up unhandled, the debugger can help you debug these by breaking just like it breaks when a breakpoint is hit. In this blog post we will look at the different classifications of exceptions and how to configure when the debugger will break for those exceptions.
Classifications of Exceptions We will start by looking at the classification types of exceptions in the debugger. The debugger classifies exceptions in the following ways:
- **First Chance Exceptions: **When an exception is first thrown in the application, this is classified as a “first chance” exception. At this point the debugger does not know if the exception will be caught (handled) by the application. All exceptions start as first chance exceptions.
- The debugger gets notified every time an exception is thrown. You can see these notifications in the Output window and in IntelliTrace.
- You can tell the debugger what first chance exceptions to break for, just like enabling a breakpoint.
- Once broken due to a first chance exception, you can continue debugging by stepping or pressing Continue. When you continue, your code has the opportunity to handle this exception, if it doesn’t then the exception now falls under one of the classifications listed below.
- **User-unhandled Exceptions: **When a first chance exception is not caught (handled) in user code and is caught in “External Code” on the call stack, this is classified as a “user-unhandled” exception. This classification is only applicable when debugging Managed or JavaScript applications with Just My Codeenabled.
- By default, the debugger will break for all user-unhandled exceptions.
- Once broken due to a user-unhandled exception, you can continue debugging by stepping or pressing Continue. The exception may be handled somewhere in “External Code” on the call stack, and if it isn’t, then it becomes an unhandled exception.
- You can change the default, but in most cases you will likely not need to change this setting. Most frameworks, like ASP.NET, implement global exception handlers so that your application will not crash, but the exception has not really been dealt with properly. The debugger provides breaking for user-unhandled exceptions to notify you in these cases.
- **Unhandled Exceptions: **When a first chance exception is not caught (handled) by the application and reaches the system default handler, this is classified as an “unhandled” exception.
- An unhandled exception will crash the application.
- The debugger will break for all unhandled exceptions so that you get a chance to examine the state of your application that lead to the crash.
- Once broken due to a completely unhandled exception, you cannot continue debugging.
Configuring the debugger to break for first chance exceptions To change when the debugger breaks, go to Debug->Windows->Exception Settings

When you first open this window you will see that there is a tree grid with one column and checkboxes.
- Break when Thrown. This includes a default list of exceptions known by the debugger, grouped by category. Note: The possible exceptions that could break from this list is determined by the runtime you are debugging. For example, if you are using managed-only debugging then the debugger will never break for C++, Win32 Exceptions, etc. even if they are configured to break when thrown.
- Checkboxes. If you check the box for a category, then the debugger will break for all First Chance Exceptions while debugging. If you don’t want to enable all First Chance Exceptions, you can find the specific exception types that you wish to configure by using the search box. Using the context menu, you can show the Additional Actions column and also configure the behavior for user-unhandled exceptions.
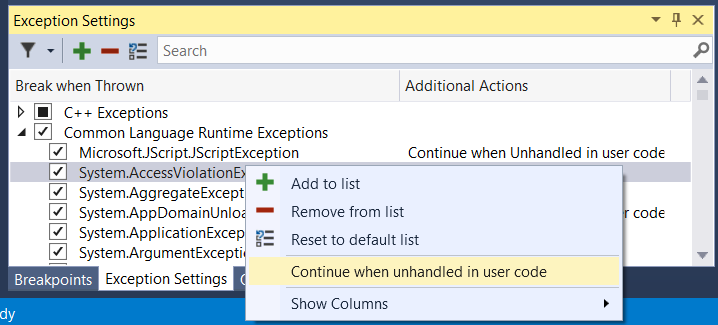 * Additional Actions. This column is only available if Just My Code is enabled. User-unhandled exceptions only make sense for Common Language Runtime Exceptions and JavaScript Runtime Exceptions, the option to configure this for other runtimes is not available because the debugger does not make distinctions between user code and External Code. As per my earlier comments, you typically do not want to turn this off. If you do wish to turn this off, you can do so by selecting “Continue when unhandled in user code” from the context menu. This list is not an exhaustive master list of every possible exception. You can use Add and Remove to manage exceptions in this default list. This configuration is saved with your solution. You can also use search to locate all of the exceptions with specific keywords, e.g. “null”. Lastly you can use Reset All to restore the list to its default state.
Example For this example we are using a simple WPF app that is supposed to draw a shape in the window when the user clicks a button. This app has been implemented to display “Failure” text in the view when something goes wrong and “Success” when everything has gone right. You can follow along with the
code attached to this post. Let’s pretend I was given this app to test out and make sure everything was working. * I start debugging (F5) to run the app. * Click on “Draw Half Octagon”. * Observe Failure Message.

The app did not crash and the debugger did not break, but I am seeing the app’s failure message and no half octagon shape, so what happened? I could start by going to the Output window or IntelliTrace to investigate. Let me start with the Output window and at the end of the post I’ll diagnose the issue with IntelliTrace.
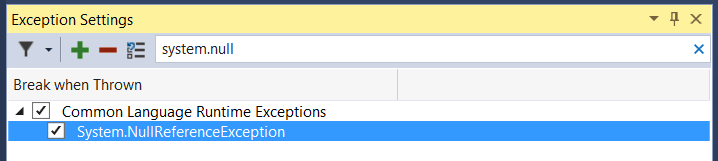
TIP: the output window and IntelliTrace are great places to start when you think something has gone wrong.  In the output window, I see that “A first chance exception of type ‘System.NullReferenceException’ occurred…” If I press “Draw Half Octagon” again I do not see any more first chance exceptions occurring, so I conclude that this exception occurred on the startup path. But where exactly did it occur? * I could use code inspection to try to hunt down the issue, or step through the initialization logic. * Instead I will open the Exception Settings (Ctrl+Alt+E), and configure the debugger to break for the first chance System.NullReference Exception. I use the search box to find the “System.NullReferenceException”.
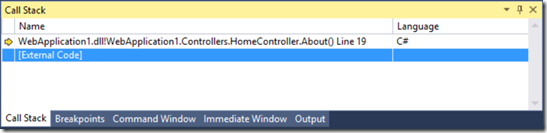
 I check the box to break when this exception type is thrown. TIP: From the search box, you can press the down arrow to select items in the list and then use the space bar to toggle the checkbox state. After I restart debugging, the debugger breaks when the exception was thrown and I can quickly verify that the exception was “handled” by an empty catch block and not really dealt with, which is what lead to the “Failure” message in my application. TIP: The *Exception Assistant can provide you with useful information if you are unfamiliar with a particular type of exception. Notice that I can also configure my exception setting from here by using the “break when this exception type is thrown” checkbox.*
 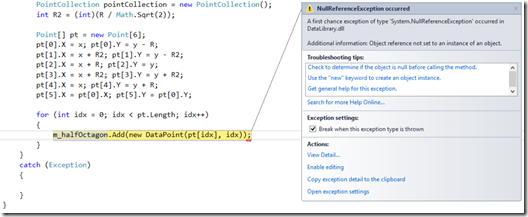 Since I am broken on this first chance exception, I can go to the Locals window where I can see that the value of “m_halfOctagon” is null. Looking at the code, I see that the variable was never initialized.
 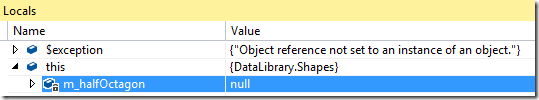 I add one line of code to initialize the variable.
 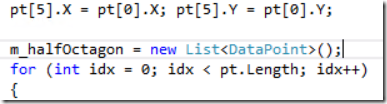 Then I restart debugging and observe that my application is working successfully.

Using IntelliTrace to Diagnose the Same Issue
The experience described above works for all languages and for all editions/SKUs of Visual Studio. However there are applications which throw exceptions very often and they don’t necessarily represent failure. In those cases it’s much more efficient to use IntelliTrace to diagnose the issue. IntelliTrace is available when using Visual Studio Ultimate edition and also using .NET. Now let me show you how I would use IntelliTrace to find this problem. Let’s pick up from the first time I observe the “Failure” message in the UI. Instead of opening the Output window and looking for first chance exceptions there, I can hit the “Break All” button on the toolbar (the “pause” icon) and then look at the Diagnostic Tools window to view my debugging history


By looking at the IntelliTrace event list, I can see that as soon as my application starts an exception is swallowed. I’m going to start there. Now I select the “Thrown:” event and Activate Historical Debugging.

Historical Debugging takes me to the line of code that threw the exception. I have again found the null reference that caused my application to fail, just like before, but this time because I used IntelliTrace I did not have to repro the issue, restart debugging, or configure the exception to break when thrown!
Your Feedback on Setting Exceptions Please visit
User Voice and vote on what you think needs to be improved about this experience, or create your own suggestion and get others to vote for it. If you run into issues, or have any other feedback you’d like to share, please let me know in the comments below, through Visual Studio’s Send a Smile feature, or in our MSDN forum. WpfShapes.zip
Author
Partner Director of Product
Aaron has been part of the Azure DevOps team since Team Foundation Server 2008, first as a developer and now in product.