Record a system trace (original) (raw)
Record a system trace
A system trace shows you system-wide activities and resource usage, so you can see how your app processes are scheduled and run. The system trace view in the Android Studio Profiler is commonly used to investigate the following:
- How app and system processes are distributed across device cores and threads.
- How smoothly the UI renders.
- Power usage at both the device and app level.
This page provides an overview of the most commonly used visuals in the system trace view. See the chart glossaryfor more details about visualizations not described here. For more detailed examples of what to use a system trace for, see the other pages in this section.
After you record a system trace, you see the following visualizations displayed over a timeline. You should focus on how different system resources are correlated; for example, if you notice a spike in the modem power rail, you should go to the threads section and see what thread activity could be causing the spike at the time.
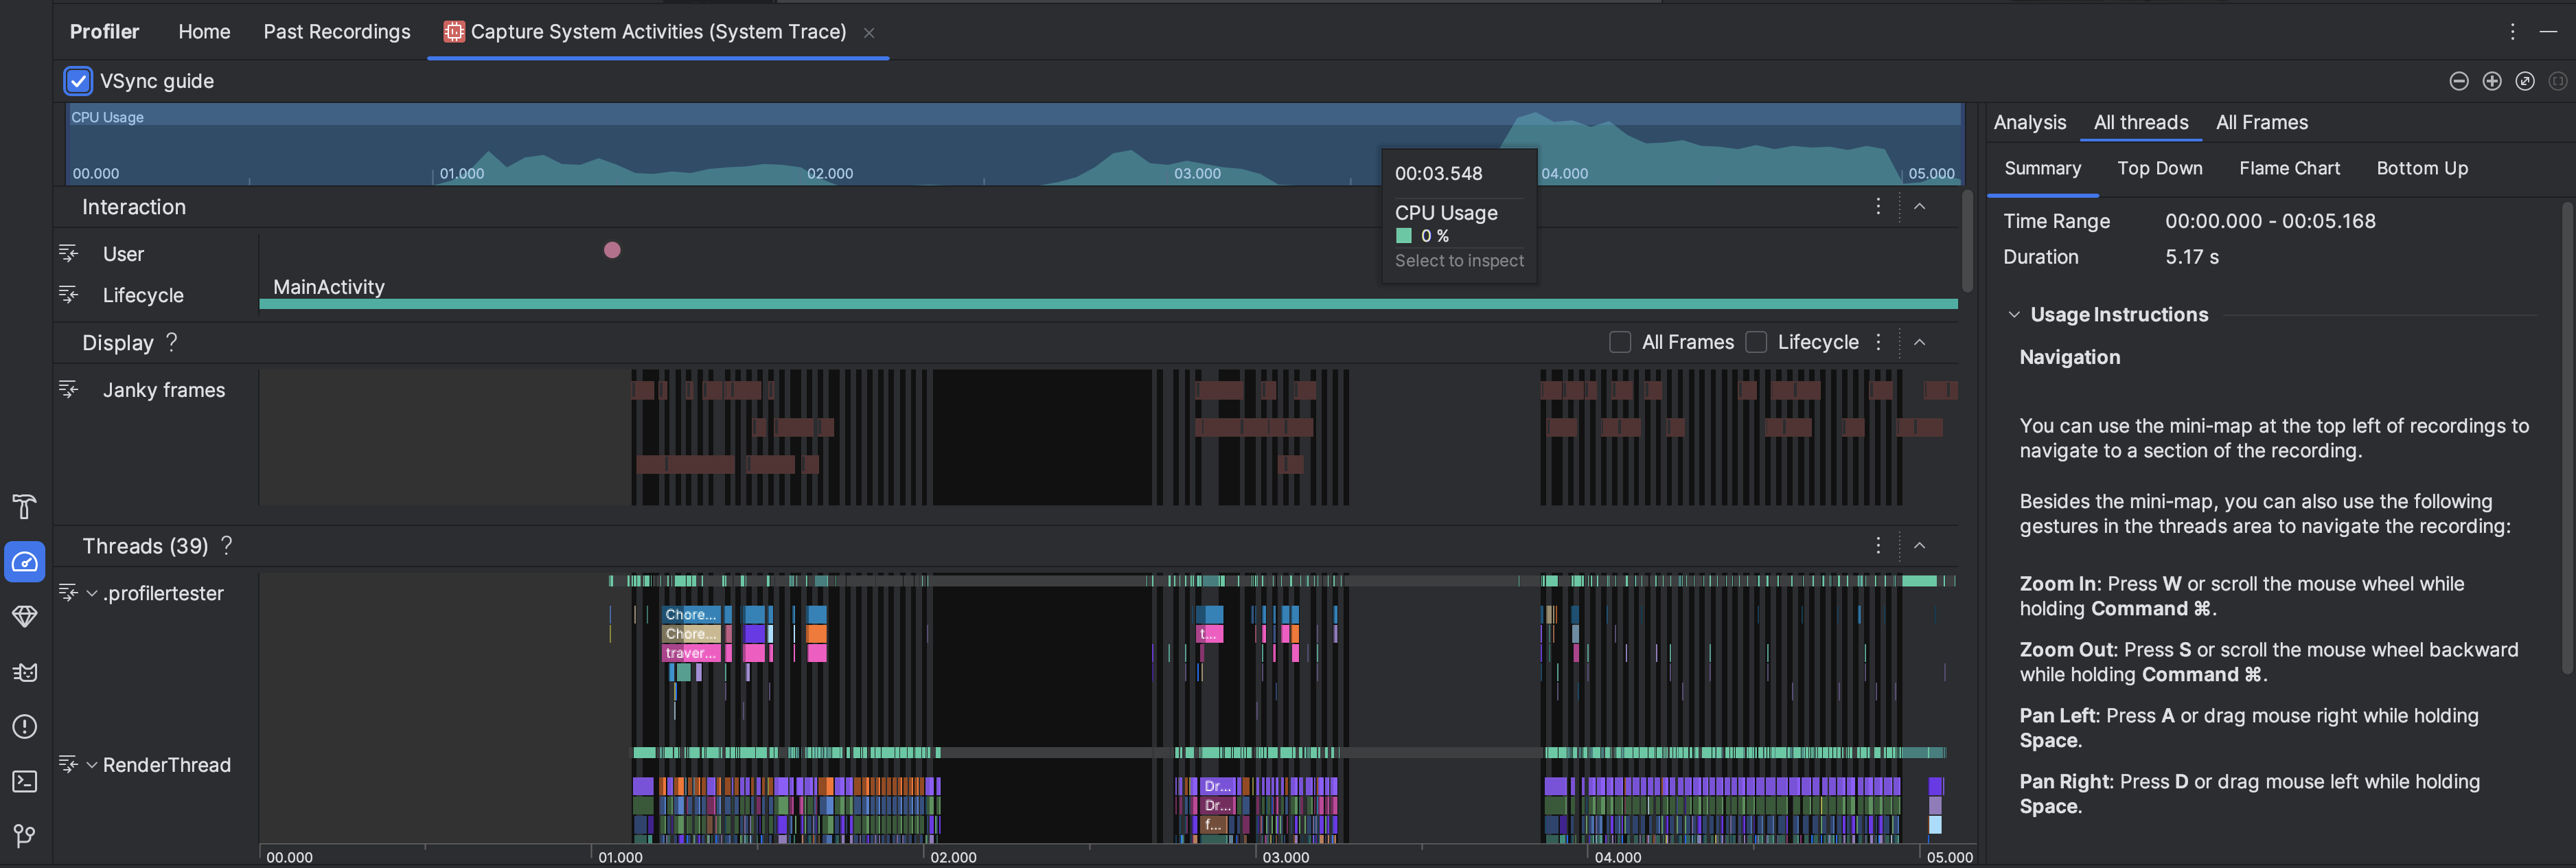
- CPU Usage: Shows CPU usage of your app as a percentage of total available CPU capacity by time. Highlight a section of the timeline to filter to the details for that time period.
- Interactions: Shows user interaction and app lifecycle events along a timeline (requires a debuggableapp process and a device running API level 26 or higher).
- Display: Shows info related to how smooth your app UI renders. SelectLifecycle to inspect how long it takes your app to render each frame on the main thread and
RenderThread. This info is helpful for investigating bottlenecks that cause UI jank and low framerates. - Threads: Shows the threads that your app and various system processes run on. To learn about how to use system traces to investigate and help reduce UI jank, see Detect UI jank.
Tip: When inspecting the Threads timeline, the following shortcuts are available:- Zoom in: Press W or scroll the mouse wheel while holding Ctrl (Command on macOS).
- Zoom out: Press S or scroll the mouse wheel backward while holding Ctrl (Command on macOS).
- Pan left: Press A or drag mouse right while holding Space.
- Pan right: Press D or drag mouse left while holdingSpace.
- Expand or collapse a thread: Double-click the thread name or press Enter while a thread is selected.
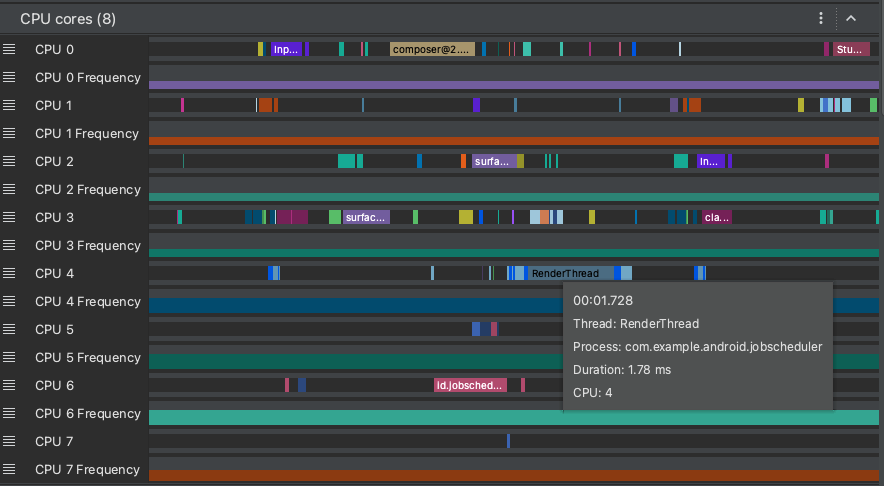
- CPU cores: Shows the activity on each core in your device. Viewing the activity by core might give you an idea of which ones are the "big" or "little" cores in modern mobile processors. Hold the pointer over a thread activity to see which thread this core is running on at that particular time.
- Process Memory (RSS): Shows the amount of physical memory currently in use by the app. For more details, see the chart glossary.
- Power Rails: Appears when you profile on a physical device. For more info, see Inspect power usage.
- Battery: Shows your app's battery usage.
Content and code samples on this page are subject to the licenses described in the Content License. Java and OpenJDK are trademarks or registered trademarks of Oracle and/or its affiliates.
Last updated 2026-03-06 UTC.