Report a bug (original) (raw)
Follow the steps on this page to complete a bug report. There are limited resources to fix bugs, so bugs that have complete information are prioritized. Incomplete bug reports are closed. If that happens, re-submit your bug with additional information.
To help ensure that you are not reporting a bug that has already been fixed, make sure you are using the latest versions of the tools. You can also search for similar issues on theAndroid Studio issue trackerto see whether the issue you are experiencing has already been reported.
How to report a bug
To report a bug, follow these steps:
- To open a bug report from Android Studio, selectHelp > Submit a Bug Report.
This is the easiest way to start a bug, because it populates the bug report with your Android Studio version, Kotlin or Java version, and system information, which are needed to properly reproduce the issue.
You can alsofile your bug hereand add the version information yourself. - Attach a diagnostic report so that we can debug your issue. To generate a diagnostic report zip file, click Help > Collect Logs and Diagnostic Data.
- Describe the exact steps to reproduce the issue. Submit as much information as possible, including code snippets, a GitHub project that can be used to reproduce the bug, and screenshots or recordings of what you are observing.
- Describe the issue in detail. Explain the outcome you expected and what you instead observed.
- Choose a descriptive title for the bug report. Using a more descriptive title makes it easier to sort by issue.
For certain bugs, we need additional information, as described in the following sections:
- Details for Android Studio bugs
- Details for build tools and Gradle bugs
- Details for Android Emulator bugs
Details for Android Studio bugs
To report bugs specific to Android Studio, include additional information as described in this section.
If the IDE hangs
If the IDE itself appears to be very sluggish or completely frozen,generate a couple of thread dumps as described on this page and attach them to the bug report. The thread dumps show what the IDE is doing that is slowing it down.
If the IDE is sluggish but not frozen, attach the idea.log file to your bug report. To attach the file, select Help > Collect Logs and Diagnostic Dataor Help > Show Log in Files (Help > Show Log in Finder on macOS). This file shows whether the IDE is throwing errors into the log.
Use CPU profiles to diagnose slowness
If you are experiencing sluggishness in Android Studio, CPU profiles can sometimes help diagnose the issue.
Follow these steps to capture a CPU profile using the Android Studio Performance Testing plugin:
- Install the plugin.
- In Android Studio, search for "Performance Testing" in the plugin marketplace.
- Alternatively, you can download an Android Studio-compatible version from the plugin website.
- Create the CPU profile.
- When Android Studio seems to be sluggish, choose Start CPU Usage Profiling.
- Repeat a few actions for which latency is problematic (code completion, typing and waiting for highlighting to catch up, and so on).
- Click Stop CPU Usage Profiling.
- Share the profile file.
A balloon appears providing the CPU snapshot filename, which follows the formatsnapshot-NNN. Share that snapshot file in your bug report.
If the IDE runs out of memory
Memory problems in Android Studio are sometimes difficult to reproduce and report. To help solve this problem, Android Studio includes a memory usage report that you can send to the Android Studio team to help identify the source of the memory issues.
Run a memory usage report
To run a memory usage report, follow these steps:
- Click Help > Analyze Memory Usage from the menu bar.
Android Studio dumps the heap and prompts you to restart the IDE. If you restart the IDE, the heap dump analysis starts immediately. Otherwise, the heap dump analysis starts the next time you run Android Studio. In either case, the IDE notifies you once the memory usage report is ready for review, as shown in figure 1.
Figure 1. Memory Use Report notification. - Click Review Report.
Before you send the report, you can review the information that's included: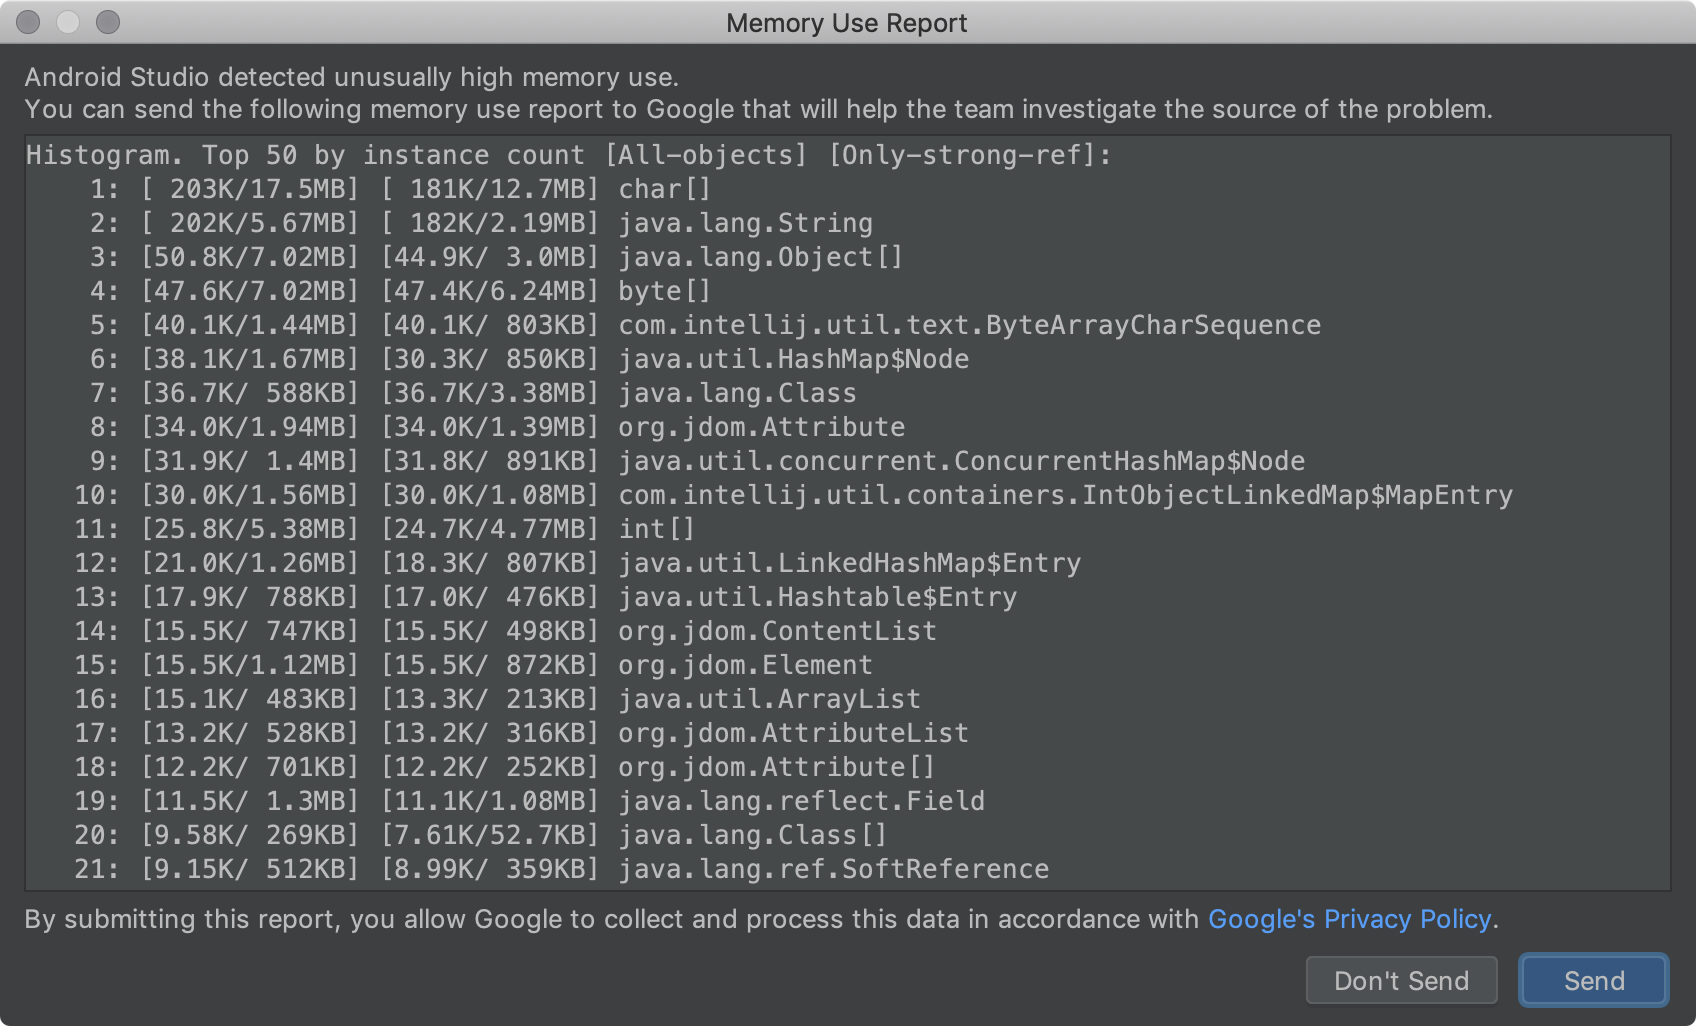
Figure 2. The Memory Use Report analysis. - After you've finished your review, copy the contents of the report into a file and attach that file when youfile your bug.
Submitting the report information this way lets the Android Studio team communicate with you using the issue tracker while investigating your memory issues.
If the IDE crashes or throws exceptions
For other types of crashes, attach the idea.log file found by selectingHelp > Collect Logs and Diagnostic Data or Help > Show Log in Files(Help > Show Log in Finder on macOS).
Generate a thread dump
A thread dump is a printout of all the threads running in the JVM. For each thread, it includes a printout of all the stackframes. This makes it easy to see what the IDE is busy doing, especially if you generate a couple of thread dumps a few seconds apart.
When you report bugs where the IDE is extremely busy with a pegged CPU or where the IDE appears to have frozen, a thread dump can pinpoint either what code is doing a lot of work or which threads are competing for resources and causing a deadlock.
The JDK ships with a tool named jstack that can be used to generate a thread dump. First, find the process ID (PID) of the Android Studio process. To do so, use the jps command:
On Linux or macOS:
jps -mv | grep studio
On Windows:
jps -mv | findstr studio
This prints out a long line, such as:
$ jps -mv | grep studio
37605 -Dfile.encoding=UTF-8 -ea -Dsun.io.useCanonCaches=false -Djava.net.preferIPv4Stack=true -Djna.nosys=true ...
The first number (37605, in this example) is the process ID.
Next, generate a thread dump and save it to a dump.txt file:
jstack -l pid >> dump.txt
If that doesn't work, there are some additional platform-specific ways you can generate a thread dump. For detailed instructions, seeIntelliJ Support.
Details for build tools and Gradle bugs
To report a bug for build tools or Gradle, attach a real or sample project that demonstrates the issue to help ensure that all of the information needed is captured. Remove any sensitive information before sharing.
If you can't share a project, indicate the versions of the tools you're using. (Try to use the latest stable or preview versions before reporting a bug). To find your tool versions, do the following:
- Android Gradle plugin version:
- Select File > Project Structure.
- Click Project.
- Locate Android Gradle Plugin Version.
- Gradle version:
- Select File > Project Structure.
- Click Project.
- Locate Gradle Version.
- Android Studio version:
- Select Help > About.
- Locate Android Studio Version.
Additionally, include the following information where applicable:
- If a behavior has changed unexpectedly from an earlier version to the current version, indicate both versions.
- If the build failed with an error, run the build from the command line with the
--stacktraceoption (such as./gradlew <task> --stacktrace) and provide a stack trace in your bug report. - If the build takes longer than expected, try one of the following:
- Run
./gradlew <task> --scanand share the generatedGradle build scan in your bug report. - Run
./gradlew <task> -Pandroid.enableProfileJson=trueand share theChrome-tracefiles generated under the<root-project>/build/android-profiledirectory.
- Run
Details for Android Emulator bugs
Follow these steps to use the emulator's extended controls to collect information and file a bug:
- In the emulator panel, click More
 .
. - In the Extended controls window, select Bug Report.
This opens a screen with bug report details such as a screenshot, the AVD configuration info, and a bug report log. You can enter the steps to reproduce here or wait and enter them into the report generated in the next step. - Wait for the bug report to finish collecting, then click Send to Google.
A window opens for you to save the bug report in a folder. Your browser also opens to create a report in the Google issue tracker with the necessary emulator details filled in. - In the report, complete any remaining details, such as the steps to reproduce the bug, and attach the files saved when you created the bug report.
Otherwise, manually enter the following details:
- Emulator version
- In the emulator, open the Extended controls.
- Click Help.
- Click the About tab to find the Emulator version.
- Android SDK Tools version
- Select Tools > SDK Manager.
- Click SDK Tools.
- Locate Android SDK Tools.
- Host CPU Model
- On Linux: Open
/proc/cpuinfo. - On Windows: Right-click My Computer and select Properties.
- On macOS: Select the Apple icon and click About This Mac
- On Linux: Open
- Device name
- From the AVD Manager, click to open the menu in the Actionscolumn for the device.
- Select View Details (or open the
$avdname.avd/config.inifile). - Find the entry for hw.device.name. For example:
hw.device.name=Nexus 5.