Monitoring and Management Guide — Celery 5.5.2 documentation (original) (raw)
This document describes the current stable version of Celery (5.5). For development docs,go here.
Introduction
There are several tools available to monitor and inspect Celery clusters.
This document describes some of these, as well as features related to monitoring, like events and broadcast commands.
Workers
Management Command-line Utilities (inspect/control)
celery can also be used to inspect and manage worker nodes (and to some degree tasks).
To list all the commands available do:
or to get help for a specific command do:
$ celery --help
Commands
- shell: Drop into a Python shell.
The locals will include theceleryvariable: this is the current app. Also all known tasks will be automatically added to locals (unless the--without-tasks flag is set).
Uses https://pypi.org/project/Ipython/, https://pypi.org/project/bpython/, or regular python in that order if installed. You can force an implementation using--ipython,--bpython, or--python. - status: List active nodes in this cluster
- result: Show the result of a task
$ celery -A proj result -t tasks.add 4e196aa4-0141-4601-8138-7aa33db0f577
Note that you can omit the name of the task as long as the task doesn’t use a custom result backend.
- purge: Purge messages from all configured task queues.
This command will remove all messages from queues configured in the
CELERY_QUEUESsetting:Warning
There’s no undo for this operation, and messages will be permanently deleted!
You can also specify the queues to purge using the -Q option:
$ celery -A proj purge -Q celery,foo,bar
and exclude queues from being purged using the -X option:
$ celery -A proj purge -X celery
- inspect active: List active tasks
$ celery -A proj inspect active
These are all the tasks that are currently being executed.
- inspect scheduled: List scheduled ETA tasks
$ celery -A proj inspect scheduled
These are tasks reserved by the worker when they have aneta or countdown argument set.
- inspect reserved: List reserved tasks
$ celery -A proj inspect reserved
This will list all tasks that have been prefetched by the worker, and is currently waiting to be executed (doesn’t include tasks with an ETA value set).
- inspect revoked: List history of revoked tasks
$ celery -A proj inspect revoked
- inspect registered: List registered tasks
$ celery -A proj inspect registered
- inspect stats: Show worker statistics (see Statistics)
$ celery -A proj inspect stats
- inspect query_task: Show information about task(s) by id.
Any worker having a task in this set of ids reserved/active will respond with status and information.
$ celery -A proj inspect query_task e9f6c8f0-fec9-4ae8-a8c6-cf8c8451d4f8
You can also query for information about multiple tasks:
$ celery -A proj inspect query_task id1 id2 ... idN
- control enable_events: Enable events
$ celery -A proj control enable_events
- control disable_events: Disable events
$ celery -A proj control disable_events
- migrate: Migrate tasks from one broker to another (EXPERIMENTAL).
$ celery -A proj migrate redis://localhost amqp://localhost
This command will migrate all the tasks on one broker to another. As this command is new and experimental you should be sure to have a backup of the data before proceeding.
Note
All inspect and control commands supports a--timeout argument, This is the number of seconds to wait for responses. You may have to increase this timeout if you’re not getting a response due to latency.
Specifying destination nodes
By default the inspect and control commands operates on all workers. You can specify a single, or a list of workers by using the--destination argument:
$ celery -A proj inspect -d w1@e.com,w2@e.com reserved
$ celery -A proj control -d w1@e.com,w2@e.com enable_events
Flower: Real-time Celery web-monitor
Flower is a real-time web based monitor and administration tool for Celery. It’s under active development, but is already an essential tool. Being the recommended monitor for Celery, it obsoletes the Django-Admin monitor, celerymon and the ncurses based monitor.
Flower is pronounced like “flow”, but you can also use the botanical version if you prefer.
Features
- Real-time monitoring using Celery Events
- Task progress and history
- Ability to show task details (arguments, start time, run-time, and more)
- Graphs and statistics
- Remote Control
- View worker status and statistics
- Shutdown and restart worker instances
- Control worker pool size and autoscale settings
- View and modify the queues a worker instance consumes from
- View currently running tasks
- View scheduled tasks (ETA/countdown)
- View reserved and revoked tasks
- Apply time and rate limits
- Configuration viewer
- Revoke or terminate tasks
- HTTP API
- List workers
- Shut down a worker
- Restart worker’s pool
- Grow worker’s pool
- Shrink worker’s pool
- Autoscale worker pool
- Start consuming from a queue
- Stop consuming from a queue
- List tasks
- List (seen) task types
- Get a task info
- Execute a task
- Execute a task by name
- Get a task result
- Change soft and hard time limits for a task
- Change rate limit for a task
- Revoke a task
- OpenID authentication
Screenshots

More screenshots:
Usage
You can use pip to install Flower:
Running the flower command will start a web-server that you can visit:
The default port is http://localhost:5555, but you can change this using the–port argument:
$ celery -A proj flower --port=5555
Broker URL can also be passed through the--broker argument :
$ celery --broker=amqp://guest:guest@localhost:5672// flower or $ celery --broker=redis://guest:guest@localhost:6379/0 flower
Then, you can visit flower in your web browser :
$ open http://localhost:5555
Flower has many more features than are detailed here, including authorization options. Check out the official documentation for more information.
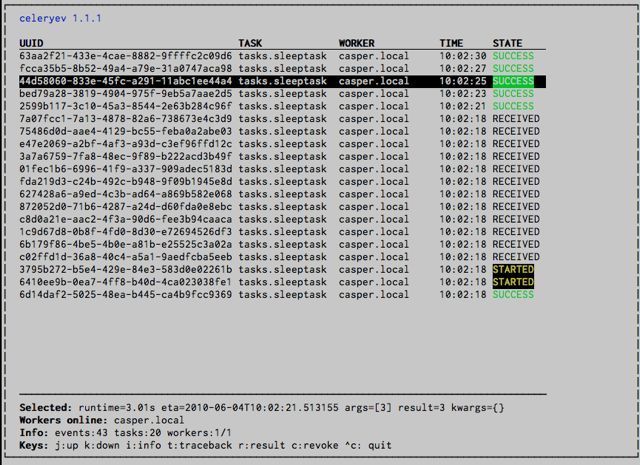
celery events: Curses Monitor
Added in version 2.0.
celery events is a simple curses monitor displaying task and worker history. You can inspect the result and traceback of tasks, and it also supports some management commands like rate limiting and shutting down workers. This monitor was started as a proof of concept, and you probably want to use Flower instead.
Starting:
You should see a screen like:
celery events is also used to start snapshot cameras (seeSnapshots:
$ celery -A proj events --camera= --frequency=1.0
and it includes a tool to dump events to stdout:
$ celery -A proj events --dump
For a complete list of options use --help:
RabbitMQ
To manage a Celery cluster it is important to know how RabbitMQ can be monitored.
RabbitMQ ships with the rabbitmqctl(1) command, with this you can list queues, exchanges, bindings, queue lengths, the memory usage of each queue, as well as manage users, virtual hosts and their permissions.
Note
The default virtual host ("/") is used in these examples, if you use a custom virtual host you have to add the -p argument to the command, for example:rabbitmqctl list_queues -p my_vhost …
Inspecting queues
Finding the number of tasks in a queue:
$ rabbitmqctl list_queues name messages messages_ready
messages_unacknowledged
Here messages_ready is the number of messages ready for delivery (sent but not received), messages_unacknowledgedis the number of messages that’s been received by a worker but not acknowledged yet (meaning it is in progress, or has been reserved).messages is the sum of ready and unacknowledged messages.
Finding the number of workers currently consuming from a queue:
$ rabbitmqctl list_queues name consumers
Finding the amount of memory allocated to a queue:
$ rabbitmqctl list_queues name memory
Tip:
Adding the -q option to rabbitmqctl(1) makes the output easier to parse.
Redis
If you’re using Redis as the broker, you can monitor the Celery cluster using the redis-cli(1) command to list lengths of queues.
Inspecting queues
Finding the number of tasks in a queue:
$ redis-cli -h HOST -p PORT -n DATABASE_NUMBER llen QUEUE_NAME
The default queue is named celery. To get all available queues, invoke:
$ redis-cli -h HOST -p PORT -n DATABASE_NUMBER keys *
Note
Queue keys only exists when there are tasks in them, so if a key doesn’t exist it simply means there are no messages in that queue. This is because in Redis a list with no elements in it is automatically removed, and hence it won’t show up in the keys command output, and llen for that list returns 0.
Also, if you’re using Redis for other purposes, the output of the keys command will include unrelated values stored in the database. The recommended way around this is to use a dedicated DATABASE_NUMBER for Celery, you can also use database numbers to separate Celery applications from each other (virtual hosts), but this won’t affect the monitoring events used by for example Flower as Redis pub/sub commands are global rather than database based.
Munin
This is a list of known Munin plug-ins that can be useful when maintaining a Celery cluster.
rabbitmq-munin: Munin plug-ins for RabbitMQ.celery_tasks: Monitors the number of times each task type has been executed (requires celerymon).celery_tasks_states: Monitors the number of tasks in each state (requires celerymon).
Events
The worker has the ability to send a message whenever some event happens. These events are then captured by tools like Flower, and celery events to monitor the cluster.
Snapshots
Added in version 2.1.
Even a single worker can produce a huge amount of events, so storing the history of all events on disk may be very expensive.
A sequence of events describes the cluster state in that time period, by taking periodic snapshots of this state you can keep all history, but still only periodically write it to disk.
To take snapshots you need a Camera class, with this you can define what should happen every time the state is captured; You can write it to a database, send it by email or something else entirely.
celery events is then used to take snapshots with the camera, for example if you want to capture state every 2 seconds using the camera myapp.Camera you run celery events with the following arguments:
$ celery -A proj events -c myapp.Camera --frequency=2.0
Custom Camera
Cameras can be useful if you need to capture events and do something with those events at an interval. For real-time event processing you should use app.events.Receiver directly, like inReal-time processing.
Here is an example camera, dumping the snapshot to screen:
from pprint import pformat
from celery.events.snapshot import Polaroid
class DumpCam(Polaroid): clear_after = True # clear after flush (incl, state.event_count).
def on_shutter(self, state):
    if not state.event_count:
        # No new events since last snapshot.
        return
    print('Workers: {0}'.format(pformat(state.workers, indent=4)))
    print('Tasks: {0}'.format(pformat(state.tasks, indent=4)))
    print('Total: {0.event_count} events, {0.task_count} tasks'.format(
        state))
See the API reference for celery.events.state to read more about state objects.
Now you can use this cam with celery events by specifying it with the -c option:
$ celery -A proj events -c myapp.DumpCam --frequency=2.0
Or you can use it programmatically like this:
from celery import Celery from myapp import DumpCam
def main(app, freq=1.0): state = app.events.State() with app.connection() as connection: recv = app.events.Receiver(connection, handlers={'*': state.event}) with DumpCam(state, freq=freq): recv.capture(limit=None, timeout=None)
if name == 'main': app = Celery(broker='amqp://guest@localhost//') main(app)
Real-time processing
To process events in real-time you need the following
- An event consumer (this is the
Receiver) - A set of handlers called when events come in.
You can have different handlers for each event type, or a catch-all handler can be used (‘*’)
- State (optional)
app.events.Stateis a convenient in-memory representation of tasks and workers in the cluster that’s updated as events come in.
It encapsulates solutions for many common things, like checking if a worker is still alive (by verifying heartbeats), merging event fields together as events come in, making sure time-stamps are in sync, and so on.
Combining these you can easily process events in real-time:
from celery import Celery
def my_monitor(app): state = app.events.State()
def announce_failed_tasks(event):
    state.event(event)
    # task name is sent only with -received event, and state
    # will keep track of this for us.
    task = state.tasks.get(event['uuid'])

    print('TASK FAILED: %s[%s] %s' % (
        task.name, task.uuid, task.info(),))

with app.connection() as connection:
    recv = app.events.Receiver(connection, handlers={
            'task-failed': announce_failed_tasks,
            '*': state.event,
    })
    recv.capture(limit=None, timeout=None, wakeup=True)
if name == 'main': app = Celery(broker='amqp://guest@localhost//') my_monitor(app)
Note
The wakeup argument to capture sends a signal to all workers to force them to send a heartbeat. This way you can immediately see workers when the monitor starts.
You can listen to specific events by specifying the handlers:
from celery import Celery
def my_monitor(app): state = app.events.State()
def announce_failed_tasks(event):
    state.event(event)
    # task name is sent only with -received event, and state
    # will keep track of this for us.
    task = state.tasks.get(event['uuid'])

    print('TASK FAILED: %s[%s] %s' % (
        task.name, task.uuid, task.info(),))

with app.connection() as connection:
    recv = app.events.Receiver(connection, handlers={
            'task-failed': announce_failed_tasks,
    })
    recv.capture(limit=None, timeout=None, wakeup=True)
if name == 'main': app = Celery(broker='amqp://guest@localhost//') my_monitor(app)
Event Reference
This list contains the events sent by the worker, and their arguments.
Task Events
task-sent
signature:
task-sent(uuid, name, args, kwargs, retries, eta, expires, queue, exchange, routing_key, root_id, parent_id)
Sent when a task message is published and the task_send_sent_event setting is enabled.
task-received
signature:
task-received(uuid, name, args, kwargs, retries, eta, hostname, timestamp, root_id, parent_id)
Sent when the worker receives a task.
task-started
signature:
task-started(uuid, hostname, timestamp, pid)
Sent just before the worker executes the task.
task-succeeded
signature:
task-succeeded(uuid, result, runtime, hostname, timestamp)
Sent if the task executed successfully.
Run-time is the time it took to execute the task using the pool. (Starting from the task is sent to the worker pool, and ending when the pool result handler callback is called).
task-failed
signature:
task-failed(uuid, exception, traceback, hostname, timestamp)
Sent if the execution of the task failed.
task-rejected
signature:
task-rejected(uuid, requeue)
The task was rejected by the worker, possibly to be re-queued or moved to a dead letter queue.
task-revoked
signature:
task-revoked(uuid, terminated, signum, expired)
Sent if the task has been revoked (Note that this is likely to be sent by more than one worker).
terminatedis set to true if the task process was terminated,
and thesignumfield set to the signal used.expiredis set to true if the task expired.
task-retried
signature:
task-retried(uuid, exception, traceback, hostname, timestamp)
Sent if the task failed, but will be retried in the future.
Worker Events
worker-online
signature:
worker-online(hostname, timestamp, freq, sw_ident, sw_ver, sw_sys)
The worker has connected to the broker and is online.
- hostname: Nodename of the worker.
- timestamp: Event time-stamp.
- freq: Heartbeat frequency in seconds (float).
- sw_ident: Name of worker software (e.g.,
py-celery). - sw_ver: Software version (e.g., 2.2.0).
- sw_sys: Operating System (e.g., Linux/Darwin).
worker-heartbeat
signature:
worker-heartbeat(hostname, timestamp, freq, sw_ident, sw_ver, sw_sys, active, processed)
Sent every minute, if the worker hasn’t sent a heartbeat in 2 minutes, it is considered to be offline.
- hostname: Nodename of the worker.
- timestamp: Event time-stamp.
- freq: Heartbeat frequency in seconds (float).
- sw_ident: Name of worker software (e.g.,
py-celery). - sw_ver: Software version (e.g., 2.2.0).
- sw_sys: Operating System (e.g., Linux/Darwin).
- active: Number of currently executing tasks.
- processed: Total number of tasks processed by this worker.
worker-offline
signature:
worker-offline(hostname, timestamp, freq, sw_ident, sw_ver, sw_sys)
The worker has disconnected from the broker.