Using the visualization graph - GitHub Docs (original) (raw)
Every workflow run generates a real-time graph that illustrates the run progress. You can use this graph to monitor and debug workflows.
- On GitHub, navigate to the main page of the repository.
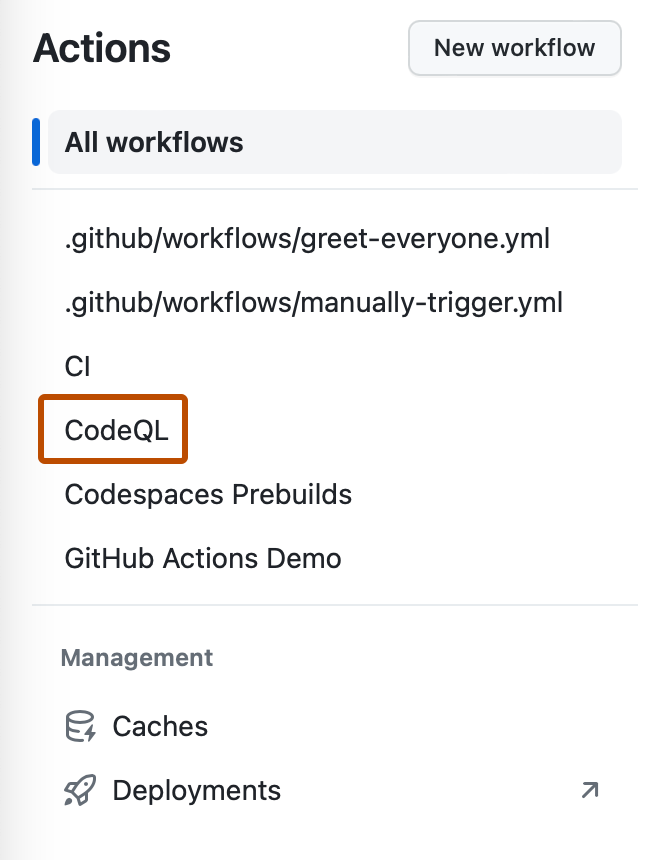
- Under your repository name, click Actions.

- In the left sidebar, click the workflow you want to see.
- From the list of workflow runs, click the name of the run to see the workflow run summary.
- The graph displays each job in the workflow. An icon to the left of the job name indicates the status of the job. Lines between jobs indicate dependencies.

- To view a job's log, click the job.