Tracing | Haystack Documentation (original) (raw)
This page explains how to use tracing in Haystack. It describes how to set up a tracing backend with OpenTelemetry, Datadog, or your own solution. This can help you monitor your app's performance and optimize it.
Traces document the flow of requests through your application and are vital for monitoring applications in production. This helps to understand the execution order of your pipeline components and analyze where your pipeline spends the most time.
Configuring a Tracing Backend
Instrumented applications typically send traces to a trace collector or a tracing backend. Haystack provides out-of-the-box support for OpenTelemetry and Datadog. You can also quickly implement support for additional providers of your choosing.
OpenTelemetry
To use OpenTelemetry as your tracing backend, follow these steps:
- Install the OpenTelemetry SDK:
shell
pip install opentelemetry-sdk
pip install opentelemetry-exporter-otlp - To add traces to even deeper levels of your pipelines, we recommend you check out OpenTelemetry integrations, such as:
- urllib3 instrumentation for tracing HTTP requests in your pipeline,
- OpenAI instrumentation for tracing OpenAI requests.
- There are two options for how to hook Haystack to the OpenTelemetry SDK.
- Run your Haystack applications using OpenTelemetry’s automated instrumentation. Haystack will automatically detect the configured tracing backend and use it to send traces.
First, install theOpenTelemetryCLI:
shell
pip install opentelemetry-distroThen, run your Haystack application using the OpenTelemetry SDK:
shellopentelemetry-instrument \ --traces_exporter console \ --metrics_exporter console \ --logs_exporter console \ --service_name my-haystack-app \ <command to run your Haystack pipeline> - Run your Haystack applications using OpenTelemetry’s automated instrumentation. Haystack will automatically detect the configured tracing backend and use it to send traces.
— or —
- Configure the tracing backend in your Python code:
python
from haystack import tracing
from opentelemetry import trace
from opentelemetry.exporter.otlp.proto.http.trace_exporter import OTLPSpanExporter
from opentelemetry.sdk.trace import TracerProvider
from opentelemetry.sdk.trace.export import BatchSpanProcessor
from opentelemetry.sdk.resources import Resource
from opentelemetry.semconv.resource import ResourceAttributes
# Service name is required for most backends
resource = Resource(attributes={
    ResourceAttributes.SERVICE_NAME: "haystack"  # Correct constant
})
tracer_provider = TracerProvider(resource=resource)
processor = BatchSpanProcessor(OTLPSpanExporter(endpoint="http://localhost:4318/v1/traces"))
tracer_provider.add_span_processor(processor)
trace.set_tracer_provider(tracer_provider)
# Tell Haystack to auto-detect the configured tracer
import haystack.tracing
haystack.tracing.auto_enable_tracing()
# Explicitly tell Haystack to use your tracer
from haystack.tracing import OpenTelemetryTracer
tracer = tracer_provider.get_tracer("my_application")
tracing.enable_tracing(OpenTelemetryTracer(tracer))
Datadog
To use Datadog as your tracing backend, follow these steps:
- Install Datadog’s tracing library ddtrace.
- There are two options for how to hook Haystack to ddtrace.
- Run your Haystack application using the
ddtrace:
shell
ddtrace <command to run your Haystack pipeline - Run your Haystack application using the
— or —
- Configure the Datadog tracing backend in your Python code:
python
from haystack.tracing import DatadogTracer
from haystack import tracing
import ddtrace
tracer = ddtrace.tracer
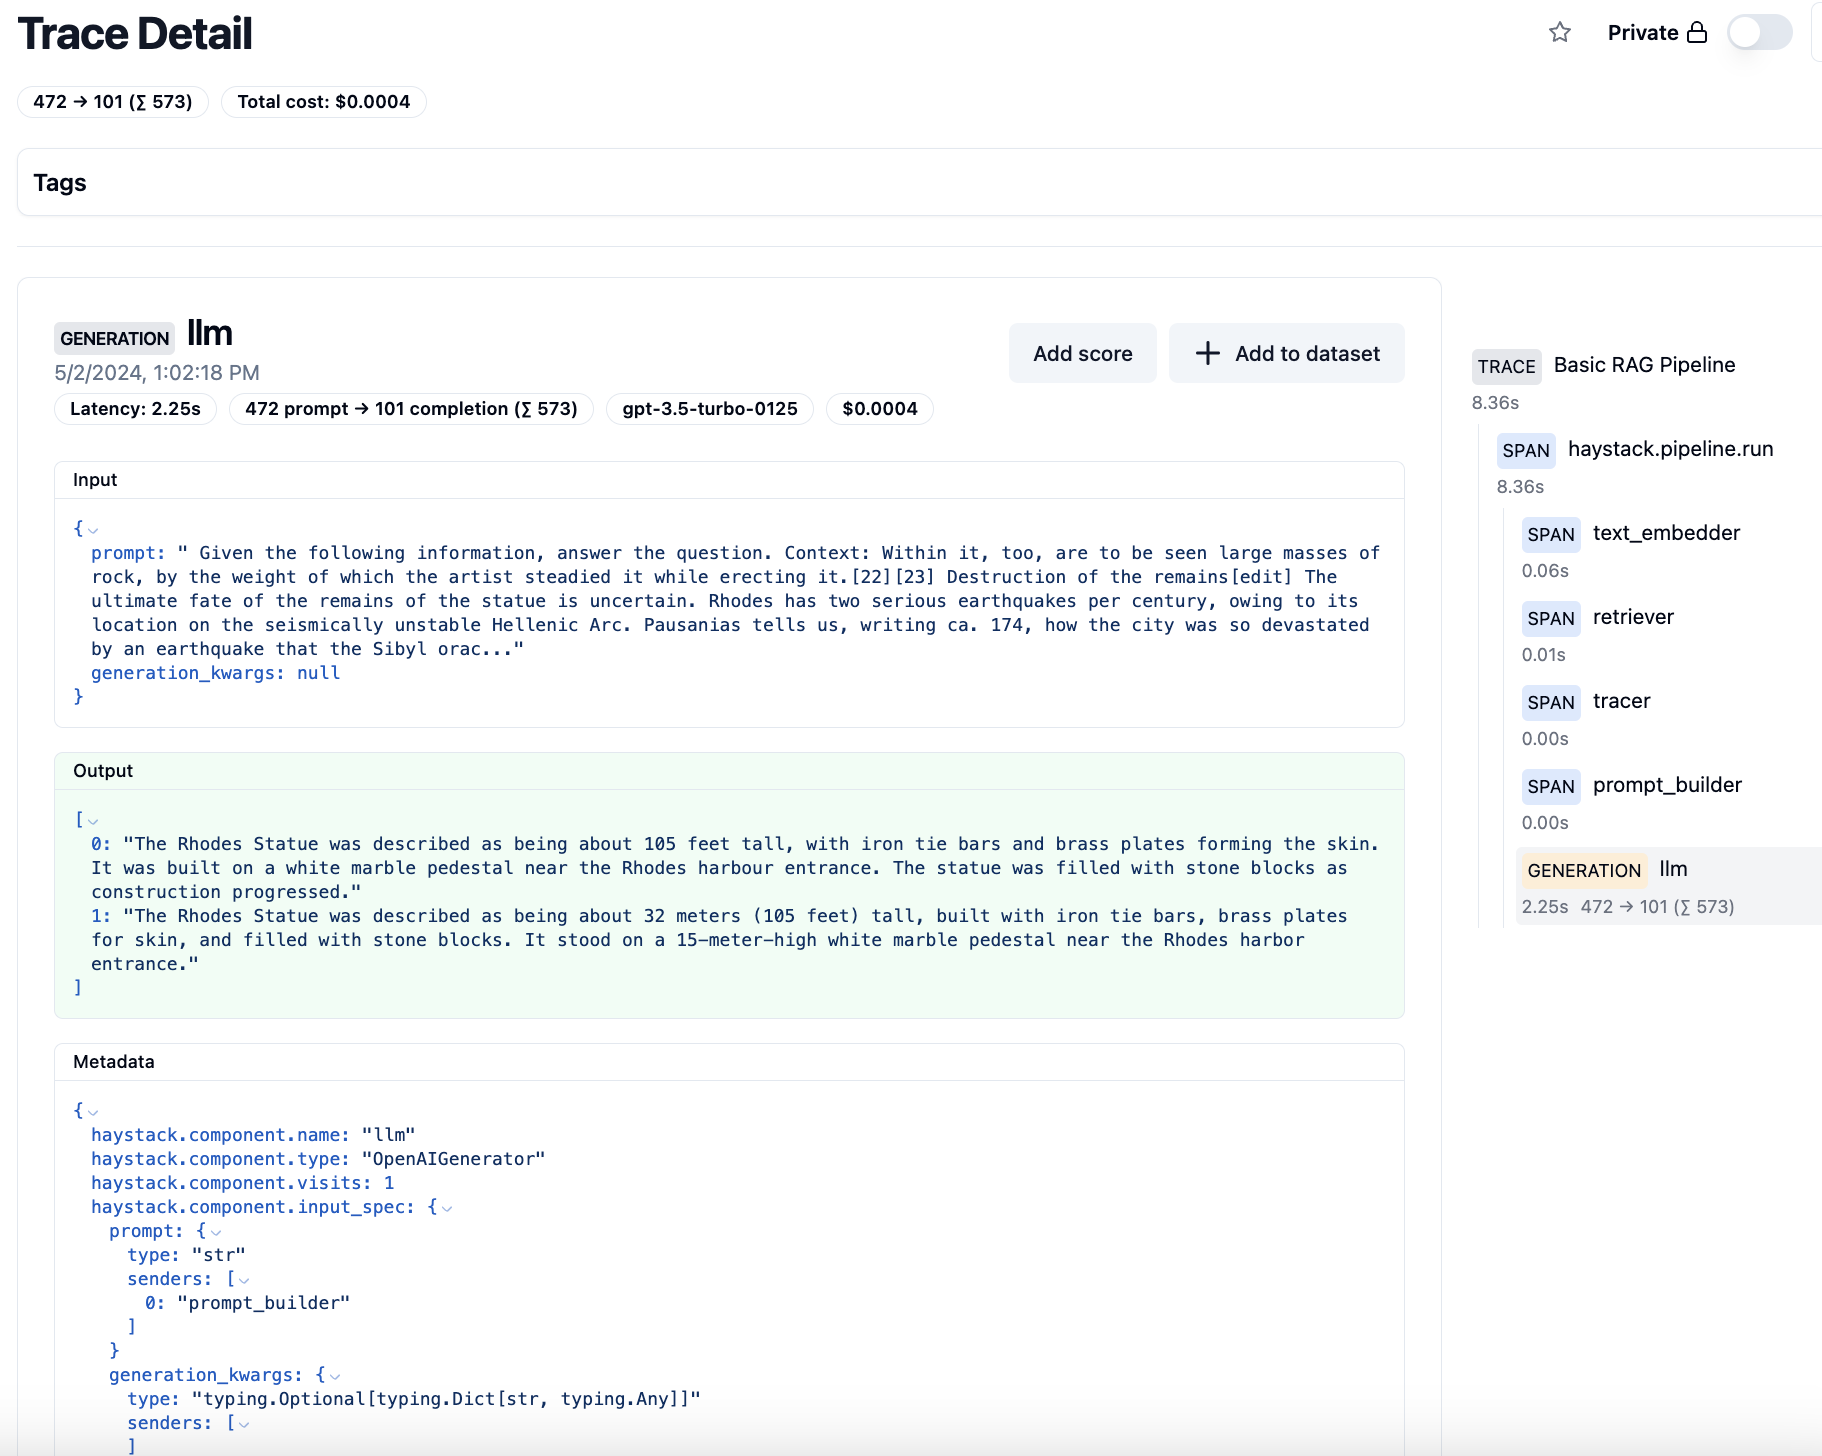
tracing.enable_tracing(DatadogTracer(tracer)) Langfuse
LangfuseConnector component allows you to easily trace your Haystack pipelines with the Langfuse UI.
Simply install the component with pip install langfuse-haystack, then add it to your pipeline.
Weights & Biases Weave
The WeaveConnector component allows you to trace and visualize your pipeline execution in Weights & Biases framework.
You will first need to create a free account on Weights & Biases website and get your API key, as well as install the integration with pip install weights_biases-haystack.
Custom Tracing Backend
To use your custom tracing backend with Haystack, follow these steps:
- Implement the
Tracerinterface. The following code snippet provides an example using the OpenTelemetry package:
python
import contextlib
from typing import Optional, Dict, Any, Iterator
from opentelemetry import trace
from opentelemetry.trace import NonRecordingSpan
from haystack.tracing import Tracer, Span
from haystack.tracing import utils as tracing_utils
import opentelemetry.trace
class OpenTelemetrySpan(Span):
   def __init__(self, span: opentelemetry.trace.Span) -> None:
       self._span = span
   def set_tag(self, key: str, value: Any) -> None:
             # Tracing backends usually don't support any tag value
             # `coerce_tag_value` forces the value to either be a Python
             # primitive (int, float, boolean, str) or tries to dump it as string.
       coerced_value = tracing_utils.coerce_tag_value(value)
       self._span.set_attribute(key, coerced_value)
class OpenTelemetryTracer(Tracer):
   def __init__(self, tracer: opentelemetry.trace.Tracer) -> None:
       self._tracer = tracer
   @contextlib.contextmanager
   def trace(self, operation_name: str, tags: Optional[Dict[str, Any]] = None) -> Iterator[Span]:
       with self._tracer.start_as_current_span(operation_name) as span:
           span = OpenTelemetrySpan(span)
           if tags:
               span.set_tags(tags)
           yield span
   def current_span(self) -> Optional[Span]:
       current_span = trace.get_current_span()
       if isinstance(current_span, NonRecordingSpan):
           return None
return OpenTelemetrySpan(current_span) - Tell Haystack to use your custom tracer:
python
from haystack import tracing
haystack_tracer = OpenTelemetryTracer(tracer)
tracing.enable_tracing(haystack_tracer)
Disabling Auto Tracing
Haystack automatically detects and enables tracing under the following circumstances:
- If
opentelemetry-sdkis installed and configured for OpenTelemetry. - If
ddtraceis installed for Datadog.
To disable this behavior, there are two options:
- Set the environment variable
HAYSTACK_AUTO_TRACE_ENABLEDtofalsewhen running your Haystack application
— or —
- Disable tracing in Python:
python
from haystack.tracing import disable_tracing
disable_tracing()
Content Tracing
Haystack also allows you to trace your pipeline components' input and output values. This is useful for investigating your pipeline execution step by step.
By default, this behavior is disabled to prevent sensitive user information from being sent to your tracing backend.
To enable content tracing, there are two options:
- Set the environment variable
HAYSTACK_CONTENT_TRACING_ENABLEDtotruewhen running your Haystack application
— or —
- Explicitly enable content tracing in Python:
python
from haystack import tracing
tracing.tracer.is_content_tracing_enabled = True
Visualizing Traces During Development
Use Jaeger as a lightweight tracing backend for local pipeline development. This allows you to experiment with tracing without the need for a complex tracing backend.
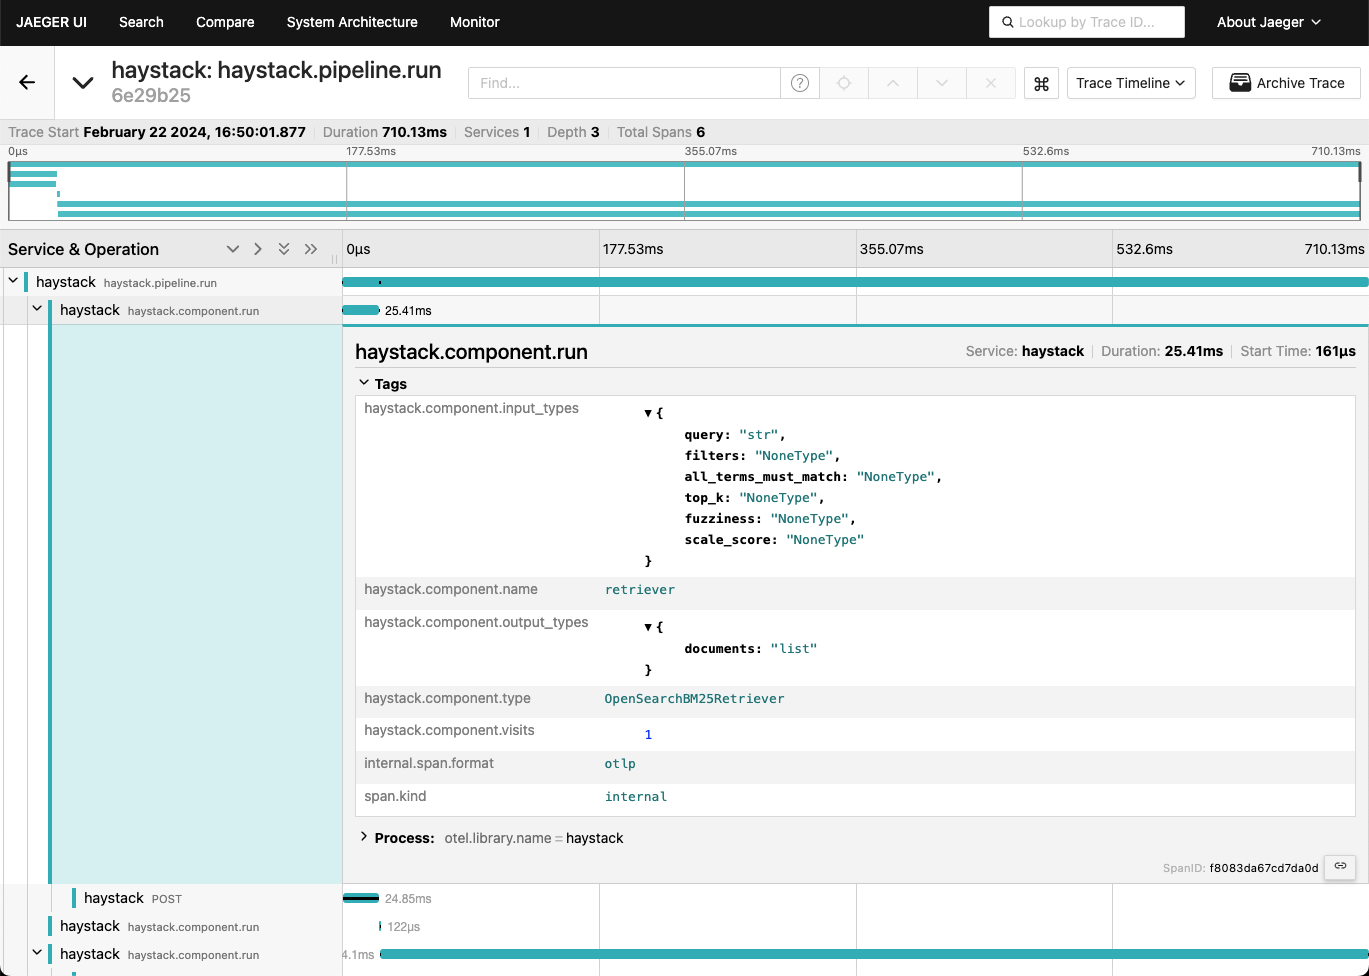
- Run the Jaeger container. This creates a tracing backend as well as a UI to visualize the traces:
shell
docker run --rm -d --name jaeger \
  -e COLLECTOR_ZIPKIN_HOST_PORT=:9411 \
  -p 6831:6831/udp \
  -p 6832:6832/udp \
  -p 5778:5778 \
  -p 16686:16686 \
  -p 4317:4317 \
  -p 4318:4318 \
  -p 14250:14250 \
  -p 14268:14268 \
  -p 14269:14269 \
  -p 9411:9411 \
jaegertracing/all-in-one:latest - Install the OpenTelemetry SDK:
shell
pip install opentelemetry-sdk
pip install opentelemetry-exporter-otlp - Configure
OpenTelemetryto use the Jaeger backend:
python
from opentelemetry.sdk.resources import Resource
from opentelemetry.semconv.resource import ResourceAttributes
from opentelemetry import trace
from opentelemetry.exporter.otlp.proto.http.trace_exporter import OTLPSpanExporter
from opentelemetry.sdk.trace import TracerProvider
from opentelemetry.sdk.trace.export import BatchSpanProcessor
# Service name is required for most backends
resource = Resource(attributes={
    ResourceAttributes.SERVICE_NAME: "haystack"
})
tracer_provider = TracerProvider(resource=resource)
processor = BatchSpanProcessor(OTLPSpanExporter(endpoint="http://localhost:4318/v1/traces"))
tracer_provider.add_span_processor(processor)
trace.set_tracer_provider(tracer_provider) - Tell Haystack to use OpenTelemetry for tracing:
python
import haystack.tracing
haystack.tracing.auto_enable_tracing() - Run your pipeline:
- Inspect the traces in the UI provided by Jaeger at http://localhost:16686.
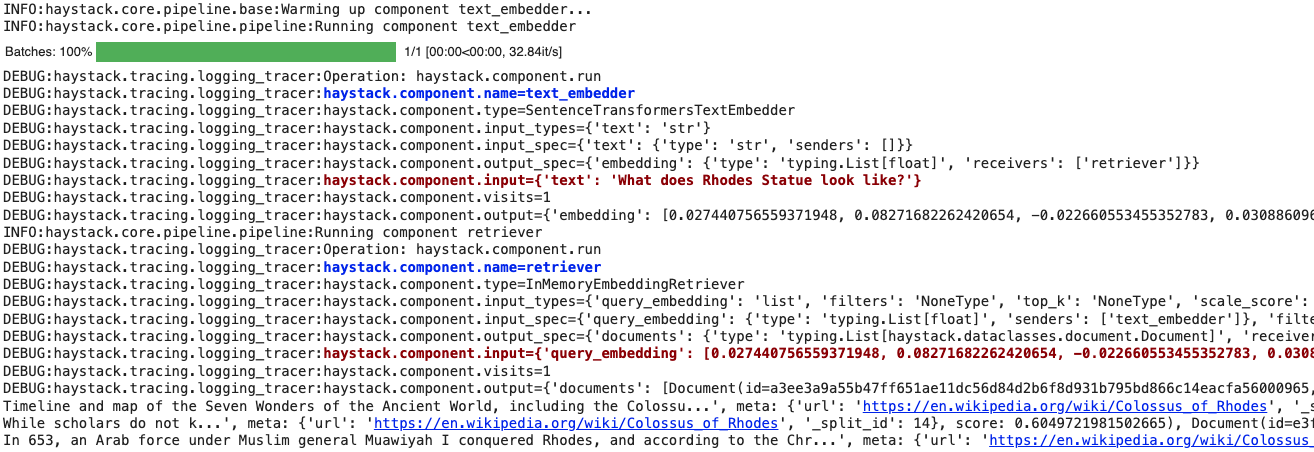
Real-Time Pipeline Logging
Use Haystack's LoggingTracer logs to inspect the data that's flowing through your pipeline in real-time.
This feature is particularly helpful during experimentation and prototyping, as you don’t need to set up any tracing backend beforehand.
Here’s how you can enable this tracer. In this example, we are adding color tags (this is optional) to highlight the components' names and inputs:
python
import logging
from haystack import tracing
from haystack.tracing.logging_tracer import LoggingTracer

logging.basicConfig(format="%(levelname)s - %(name)s -  %(message)s", level=logging.WARNING)
logging.getLogger("haystack").setLevel(logging.DEBUG)

tracing.tracer.is_content_tracing_enabled = True # to enable tracing/logging content (inputs/outputs)
tracing.enable_tracing(LoggingTracer(tags_color_strings={"haystack.component.input": "\x1b[1;31m", "haystack.component.name": "\x1b[1;34m"}))
Here’s what the resulting log would look like when a pipeline is run: