Get started (original) (raw)
The F5 NGINX One Console makes it easy to manage NGINX instances across locations and environments. The console lets you monitor and control your NGINX fleet from one place—you can check configurations, track performance metrics, identify security vulnerabilities, manage SSL certificates, and more.
This guide provides step-by-step instructions to activate and use F5 NGINX One Console. For a list of the latest changes, see our changelog
NGINX One offers the following key benefits:
- Centralized control: Manage all your NGINX instances from a single console.
- Enhanced monitoring and risk detection: Automatically detect critical vulnerabilities (CVEs), verify SSL certificate statuses, and identify security issues in NGINX configurations.
- Performance optimization: Track your NGINX versions and receive recommendations for tuning your configurations for better performance.
- Graphical Metrics Display: Access a dashboard that shows key metrics for your NGINX instances, including instance availability, version distribution, system health, and utilization trends.
- Real-time alerts: Receive alerts about critical issues.
You need access to F5 Distributed Cloud.
If you already have accessed F5 Distributed Cloud and have NGINX instances available, you can skip these sections and start to Add your NGINX instances to NGINX One. Otherwise, take these steps to "onboard" yourself to NGINX One Console.
Register for a trial
If you want to register for a trial, navigate to https://account.f5.com/myf5. If needed, select Sign up to get an account. Then follow these steps:
- Navigate to https://account.f5.com/myf5 and log in.
- Select trials
- Find F5 NGINX. Sign up for the trial.
- The trial may require approval. Confirm access to the F5 Distributed Cloud
Confirm that an F5 Distributed Cloud tenant has been provisioned for you. To do so:
- Log in to MyF5 and review your subscriptions.
- Look for Distributed Cloud in one of your subscriptions. This could appear under an NGINX subscription or a Distributed Cloud subscription.
If you don’t see Distributed Cloud in any subscription, contact your F5 account team or Customer Success Manager.
When you have a subscription, you or someone in your organization should have an email from no-reply@cloud.f5.com asking you to update your password.
That email includes an account name, which is the TENANT_NAME.
To access F5 Distributed Cloud, go to to https://INSERT_YOUR_TENANT_NAME.console.ves.volterra.io/. If you have never logged in, select the Forgot Password? option in the log in screen. Alternatively, if someone within your organization has access, ask them to add you as a user within your tenant with access to NGINX One Console.
If you do not know your TENANT_NAME, you can:
- Email support@cloud.f5.com to get your username and TENANT_NAME.
- If you have a dedicated F5 tenant administrator, ask them to:
- Provide a username for your tenant
- Ask them to reset your password Confirm access to NGINX One Console
- Go to
https://<TENANT_NAME>.console.ves.volterra.io/to access F5 Distributed Cloud, and sign in.
After you sign in, you should see the NGINX One tile. - Select the NGINX One tile.
- If needed, select Enable Service.
- After the service is enabled, select Visit Service to open NGINX One Console. Install an NGINX instance
If you need to set up an instance of NGINX, you can do so in one of the following ways:
- Install NGINX Open Source or NGINX Plus. You can use the linked guide to install NGINX in a Linux environment, in a VM or on bare-metal hardware.
- Deploy NGINX and NGINX Plus with Docker with NGINX and the NGINX Agent installed. Check you’re running a supported Linux distribution
| Distribution | Version | Architecture |
|---|---|---|
| AlmaLinux | 8, 9 | x86_64, aarch64 |
| Alpine Linux | 3.16 - 3.18 | x86_64, aarch64 |
| Amazon Linux | 2023 | x86_64, aarch64 |
| Amazon Linux 2 | LTS | x86_64, aarch64 |
| CentOS | 7.4+ | x86_64, aarch64 |
| Debian | 11, 12 | x86_64, aarch64 |
| Oracle Linux | 7.4+, 8.1+, 9 | x86_64 |
| Red Hat Enterprise Linux | 7.4+, 8.1+, 9 | x86_64, aarch64 |
| Rocky Linux | 8, 9 | x86_64, aarch64 |
| Ubuntu | 20.04 LTS, 22.04 LTS | x86_64, aarch64 |
Add your NGINX instances to NGINX One. You’ll need to create a data plane key and then install NGINX Agent on each instance you want to monitor.
The following instructions include minimal information, sufficient to "get started." See the following links for detailed instructions:
- Prepare - Create and manage data plane keys
- Add an NGINX instance
- Connect NGINX Plus container images
A data plane key is a security token that ensures only trusted NGINX instances can register and communicate with NGINX One.
To generate a data plane key, select Manage > Instances > Add Instance:
- For a new key: In the Add Instance pane, select Generate Data Plane Key.
- To reuse an existing key: If you already have a data plane key and want to use it again, select Use existing key. Then, enter the key’s value in the Data Plane Key box.
Data plane key guidelines
Data plane keys are displayed only once and cannot be retrieved later. Be sure to copy and store this key securely.
Data plane keys expire after one year. You can change this expiration date later by editing the key. If you revoke a data plane key you disconnect all instances registered with that key.
For more options associated with data plane keys, see Create and manage data plane keys.
Revoking a data plane key disconnects all instances that were registered with that key.
Depending on whether this is your first time using NGINX One Console or you’ve used it before, follow the appropriate steps to add an instance:
- For first-time users: On the welcome screen, select Add Instance.
- For returning users: If you’ve added instances previously and want to add more, select Instances on the left menu, then select Add Instance.
After entering your data plane key, you’ll see a curl command similar to the one below. Copy and run this command on each NGINX instance to install NGINX Agent. Once installed, NGINX Agent typically registers with NGINX One within a few seconds.
NGINX Agent must be able to establish a connection to NGINX One Console’s Agent endpoint (
agent.connect.nginx.com). Ensure that any firewall rules you have in place for your NGINX hosts allows network traffic to port443for all of the following IP address ranges:
3.135.72.139/323.133.232.50/3252.14.85.249/322600:1f16:19c8:d400::/62
To install NGINX Agent on an NGINX instance:
- Check if NGINX is running and start it if it’s not:
First, see if NGINX is running:
sudo systemctl status nginx If the status isn’t Active, go ahead and start NGINX:
sudo systemctl start nginx - Install NGINX Agent:
Next, use thecurlcommand provided to you to install NGINX Agent:
curl https://agent.connect.nginx.com/nginx-agent/install | DATA_PLANE_KEY="YOUR_DATA_PLANE_KEY" sh -s -- -y - Replace
YOUR_DATA_PLANE_KEYwith your actual data plane key. - The
-yoption automatically confirms any prompts during installation.
The install script writes an nginx-agent.conf file to the /etc/nginx-agent/ directory, with the data plane key that you generated. You can find this information in the nginx-agent.conf file:
yaml
command:
  server:
    host: "agent.connect.nginx.com" # Command server host
    port: 443                       # Command server port
  auth:
    token: "<your-data-plane-key-here>" # Authentication token for the command server
  tls:
    skip_verify: false
Replace <your-data-plane-key-here> with your Data Plane key.
We recommend keeping
dataplane.status.poll_intervalbetween30sand60sin the NGINX Agent config (/etc/nginx-agent/nginx-agent.conf). If the interval is set above60s, NGINX One Console may report incorrect instance statuses.
The NGINX One Console dashboard relies on APIs for NGINX Plus and NGINX Open Source Stub Status to report traffic and system metrics. The following sections show you how to enable those metrics.
To collect comprehensive metrics for NGINX Plus, including bytes streamed, information about upstream systems and caches, and counts of all HTTP status codes, add the following to your NGINX Plus configuration file, for example /etc/nginx/nginx.conf or an included file:
nginx
# This block enables the NGINX Plus API and dashboard
# For configuration and security recommendations, see:
# https://docs.nginx.com/nginx/admin-guide/monitoring/live-activity-monitoring/#configuring-the-api
server {
    # Change the listen port if 9000 conflicts
    # (8080 is the conventional API port)
    listen 9000;

    location /api/ {
        # To restrict write methods (POST, PATCH, DELETE), uncomment:
        # limit_except GET {
        #     auth_basic "NGINX Plus API";
        #     auth_basic_user_file /path/to/passwd/file;
        # }

        # Enable API in write mode
        api write=on;

        # To restrict access by network, uncomment the following lines and set your network:
        # allow 192.0.2.0/24;   # replace with your network
        # allow 127.0.0.1/32;   # allow local NGINX Agent to call the NGINX Plus API to retrieve metrics
        # deny  all;
    }

    # Serve the built-in dashboard at /dashboard.html
    location = /dashboard.html {
        root /usr/share/nginx/html;
    }
}
- By default, all clients can call the API.
- To limit who can access the API, uncomment the
allowanddenylines underapi write=onand replace the example CIDR with your trusted network.- To restrict write methods (
POST,PATCH,DELETE), uncomment and configure thelimit_except GETblock and set up HTTP basic authentication.
For more details, see the NGINX Plus API module documentation and Configuring the NGINX Plus API.
To collect basic metrics about server activity for NGINX Open Source, add the following to your NGINX configuration file:
nginx
server {
    listen 127.0.0.1:8080;
    location /api {
        stub_status;
        allow 127.0.0.1;
        deny all;
    }
}
This configuration:
- Enables the stub status API.
- Allows requests only from
127.0.0.1(localhost). - Blocks all other requests for security.
For more details, see the NGINX Stub Status module documentation.
After connecting your NGINX instances to NGINX One, you can monitor their performance and health. The NGINX One dashboard is designed for this purpose, offering an easy-to-use interface.
- Log in to F5 Distributed Console.
- Select NGINX One > Visit Service.
Navigating the dashboard:
- Drill down into specifics: For in-depth information on a specific metric, like expiring certificates, click on the relevant link in the metric’s card to go to a detailed overview page.
- Refine metric timeframe: Metrics show the last hour’s data by default. To view data from a different period, select the time interval you want from the drop-down menu.
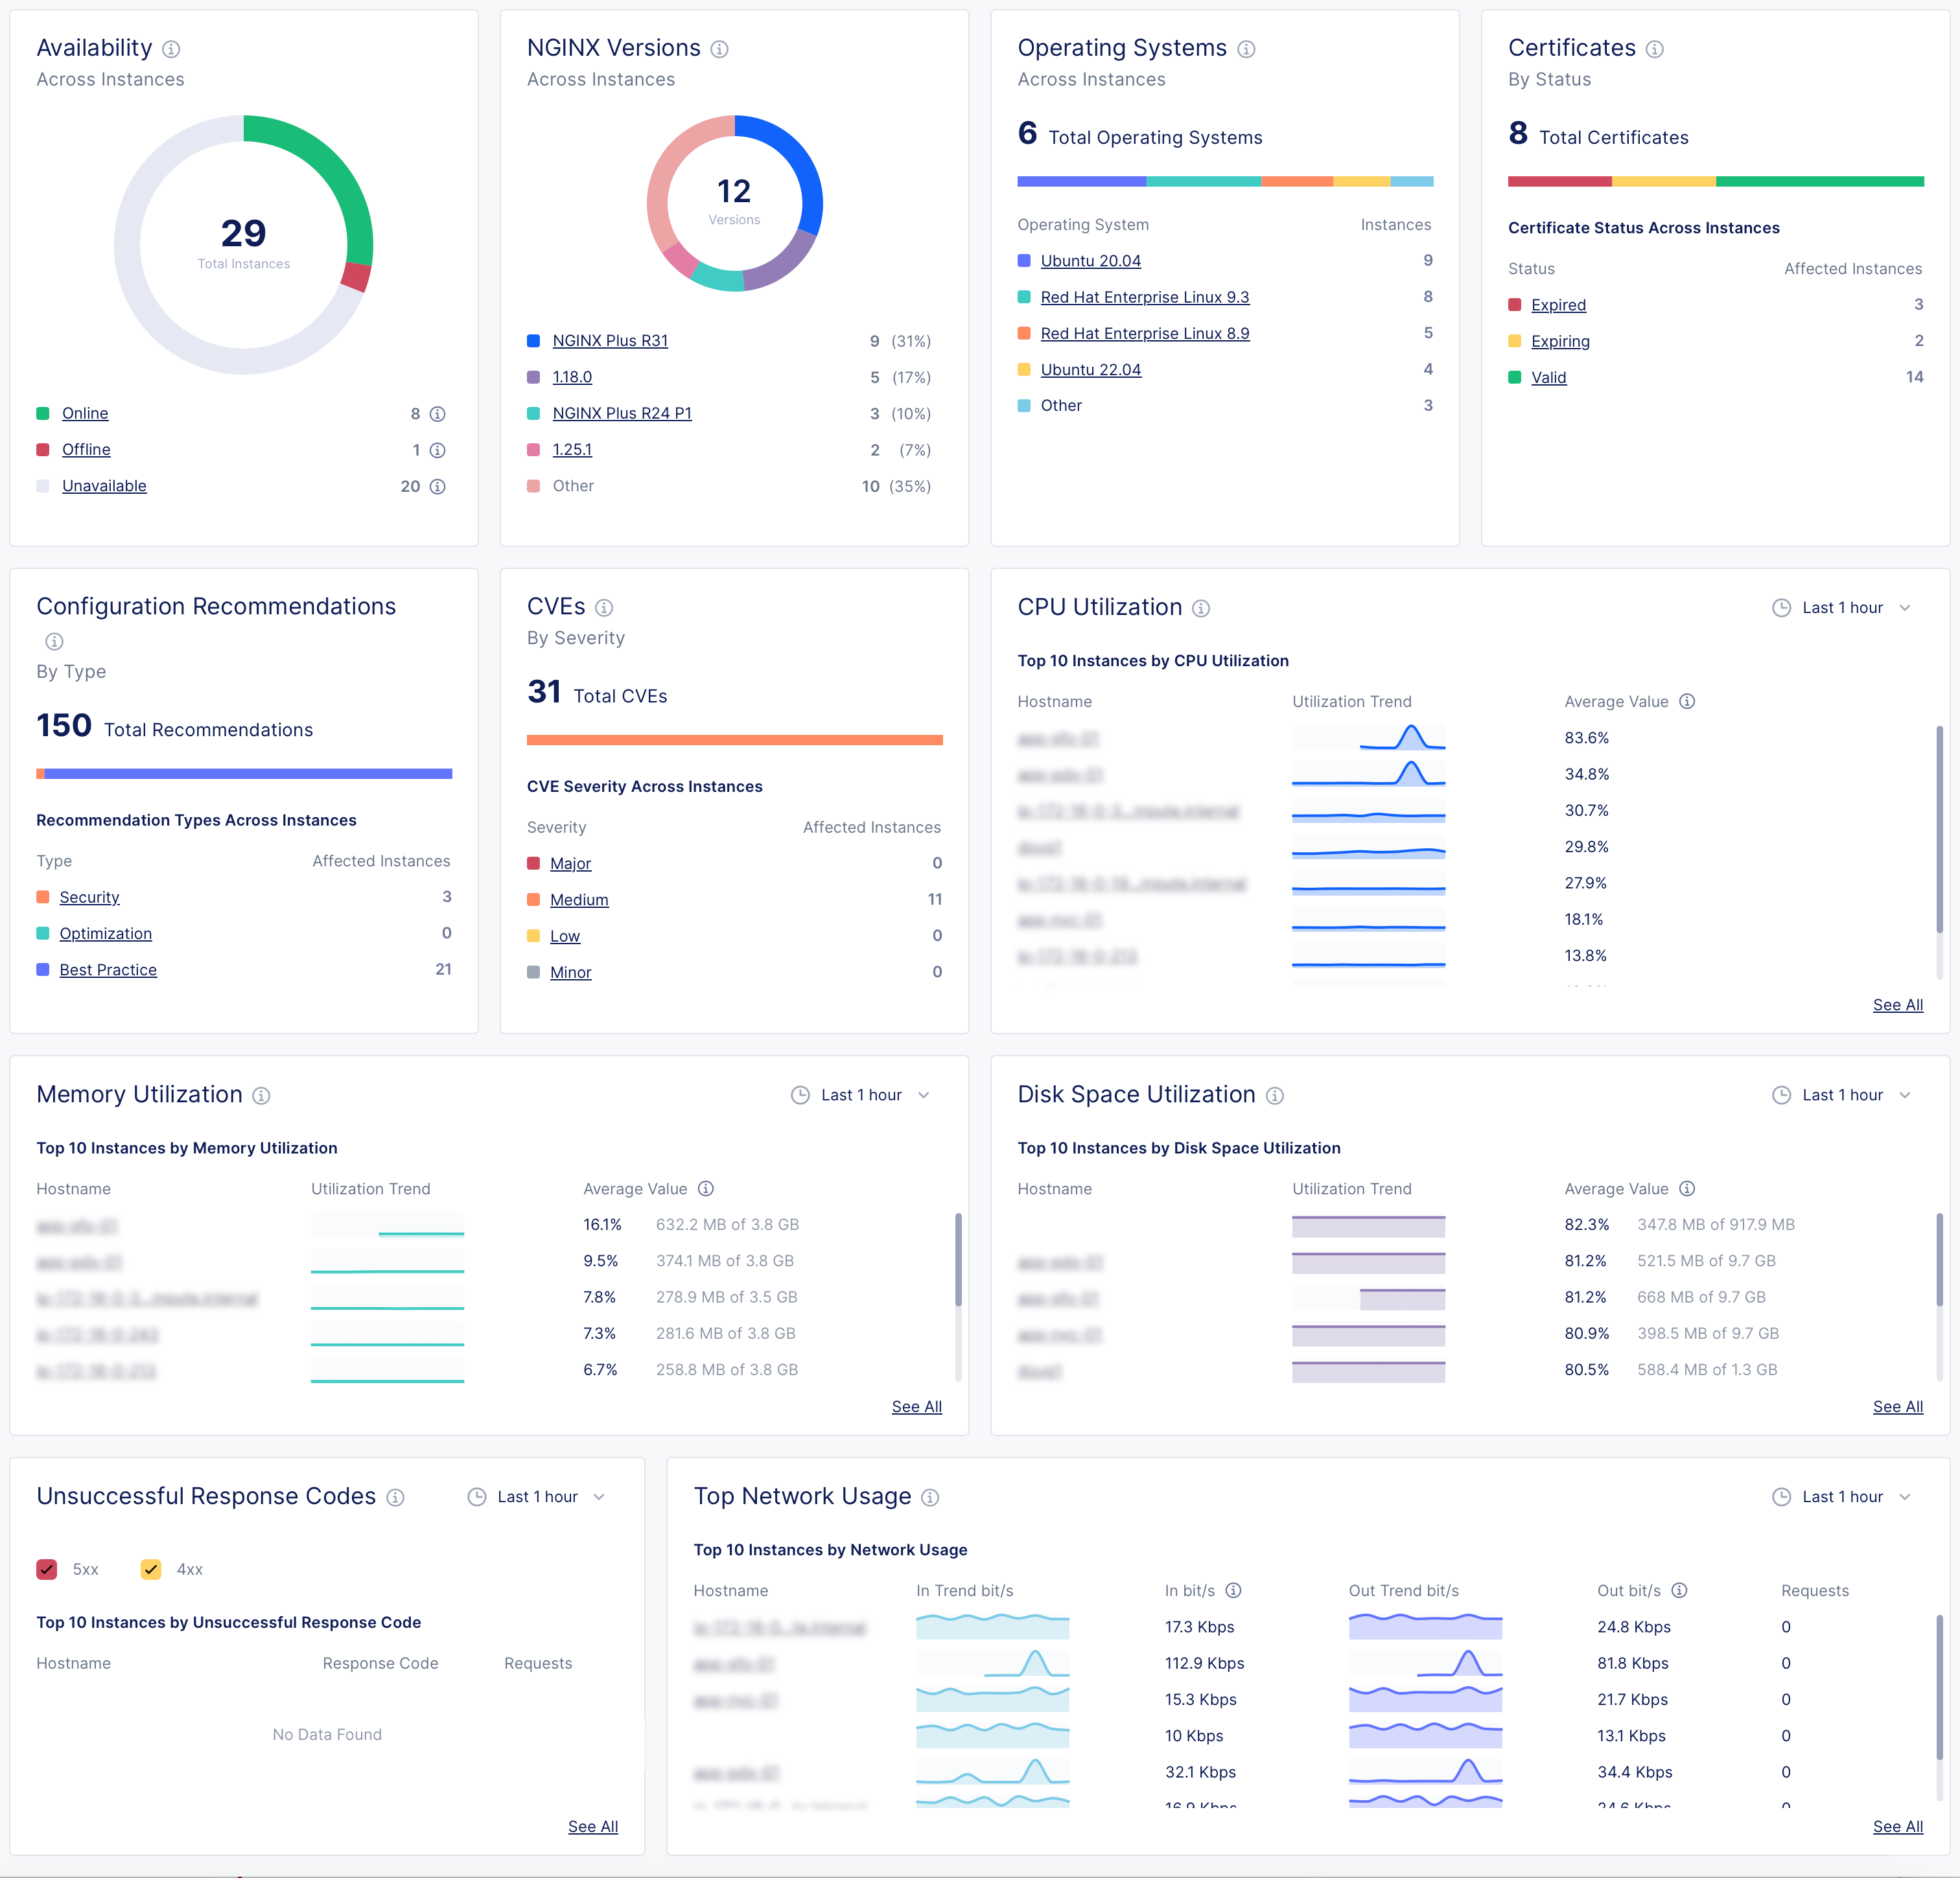
NGINX One Console dashboard metrics
| Metric | Description | Details |
|---|---|---|
| Instance availability | Understand the operational status of your NGINX instances. | - Online: The NGINX instance is actively connected and functioning properly. - Offline: NGINX Agent is connected but the NGINX instance isn’t running, isn’t installed, or can’t communicate with NGINX Agent. - Unavailable: The connection between NGINX Agent and NGINX One Console has been lost or the instance has been decommissioned. - Unknown: The current state can’t be determined at the moment. |
| NGINX versions by instance | See which NGINX versions are in use across your instances. | |
| Operating systems | Find out which operating systems your instances are running on. | |
| Certificates | Monitor the status of your SSL certificates to know which are expiring soon and which are still valid. | |
| Config recommendations | Get configuration recommendations to optimize your instances' settings. | |
| CVEs (Common Vulnerabilities and Exposures) | Evaluate the severity and number of potential security threats in your instances. | - High: Indicates a high-severity threat that needs immediate attention. NGINX CVSS score = 7.0-10.0 - Medium: Implies a moderate threat level. NGINX CVSS score = 4.0-6.9 - Low: Represent less critical issues that still require monitoring. NGINX CVSS score = 0.1-3.9. - None: NGINX CVSS score = 0.0 |
| CPU utilization | Track CPU usage trends and pinpoint instances with high CPU demand. | |
| Memory utilization | Watch memory usage patterns to identify instances using significant memory. | |
| Disk space utilization | Monitor how much disk space your instances are using and identify those nearing capacity. | |
| Unsuccessful response codes | Look for instances with a high number of HTTP server errors and investigate their error codes. | |
| Top network usage | Review the network usage and bandwidth consumption of your instances. |