Tutorials | Pixie 101 | Database Query Profiling (original) (raw)
Service performance issues often turn out to be the result of slow database queries. With Pixie, you can easily monitor the performance of your database requests to ensure they do not impact service health.
MySQL requests are featured in this tutorial, but Pixie can trace a number of different database protocols including Cassandra, PostgreSQL, and Redis. See the full list here.
This tutorial will demonstrate how to use Pixie to monitor MySQL:
- Latency, error and throughput (LET) rate for all pods.
- LET rate per normalized query.
- Latency per individual full body query.
Prerequisites
- You will need a Kubernetes cluster with Pixie installed. If you do not have a cluster, you can create a minikube cluster and install Pixie using one of our install guides.
- You will need to install the demo microservices application, using Pixie's CLI:
- Install the Pixie CLI.
- Run
px demo deploy px-sock-shopto install Weavework's Sock Shop demo app.- Run
kubectl get pods -n px-sock-shopto make sure all pods are ready before proceeding. The demo app can take up to 5 minutes to deploy.
Request Health by Pod
To see MySQL latency, error, and throughput rate for all pods in your cluster, we’ll use the px/mysql_stats script:
- Open the Live UI and select
px/mysql_statsfrom thescriptdrop-down menu.
This script shows latency, error and throughput over time for all MySQL requests in the cluster.
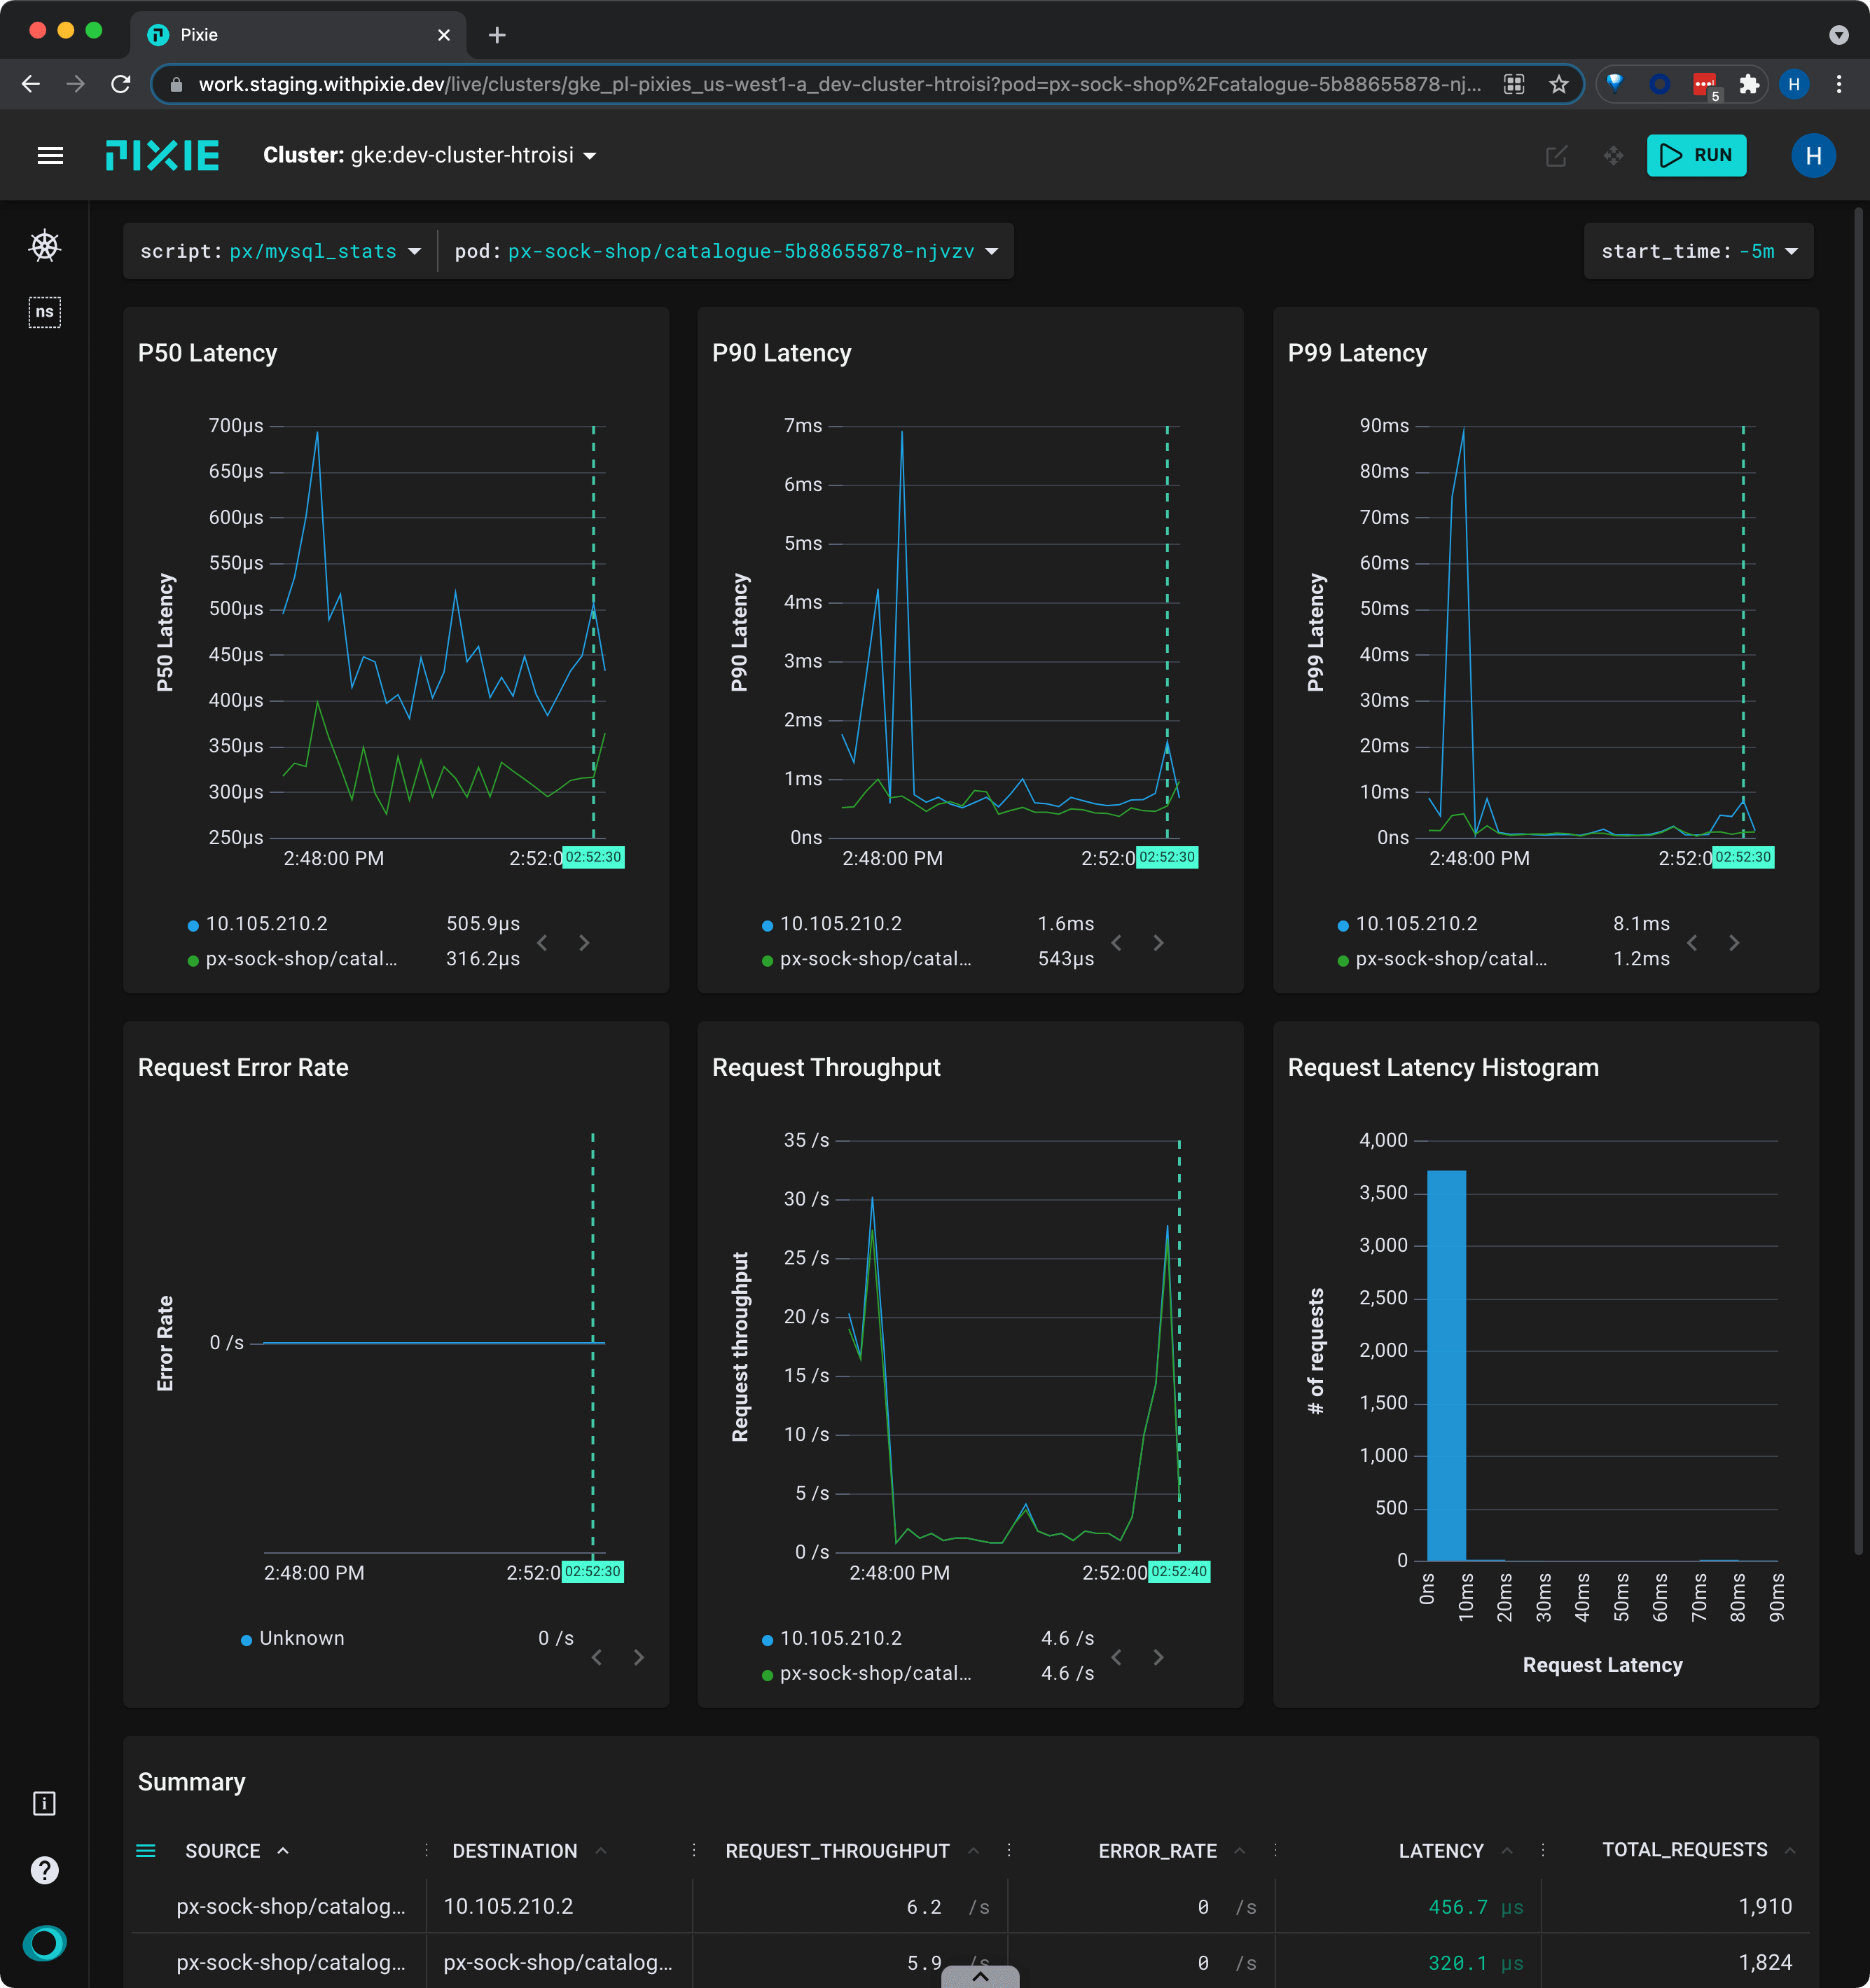
Let’s use the optional
podscript input argument to filter to a particular pod.
- Select the drop-down arrow next to the
podargument, typepx-sock-shop/catalogue, and press Enter to re-run the script.
The graph should update to show stats just for the requests made to/from the
cataloguepod.
- Clear the
podvalue by selecting the drop-down arrow and pressing Enter.
Request Health by Normalized Query
Pixie can automatically cluster your SQL queries so that you can analyze similar queries as a single group.
For example, the following two queries:
SELECT * FROM Socks WHERE Socks.Color ='Green'
SELECT * FROM Socks WHERE Socks.Color ='Blue'
would be clustered together into the normalized query:
SELECT * FROM Socks WHERE Socks.Color =?
A normalized query means that constants, such as a sock color, have been replaced with placeholders.
Let's see this feature in action for our demo application:
- Select
px/sql_queriesfrom thescriptdrop-down menu.
This live view calculates the latency, error, and throughput over time for each normalized SQL query.
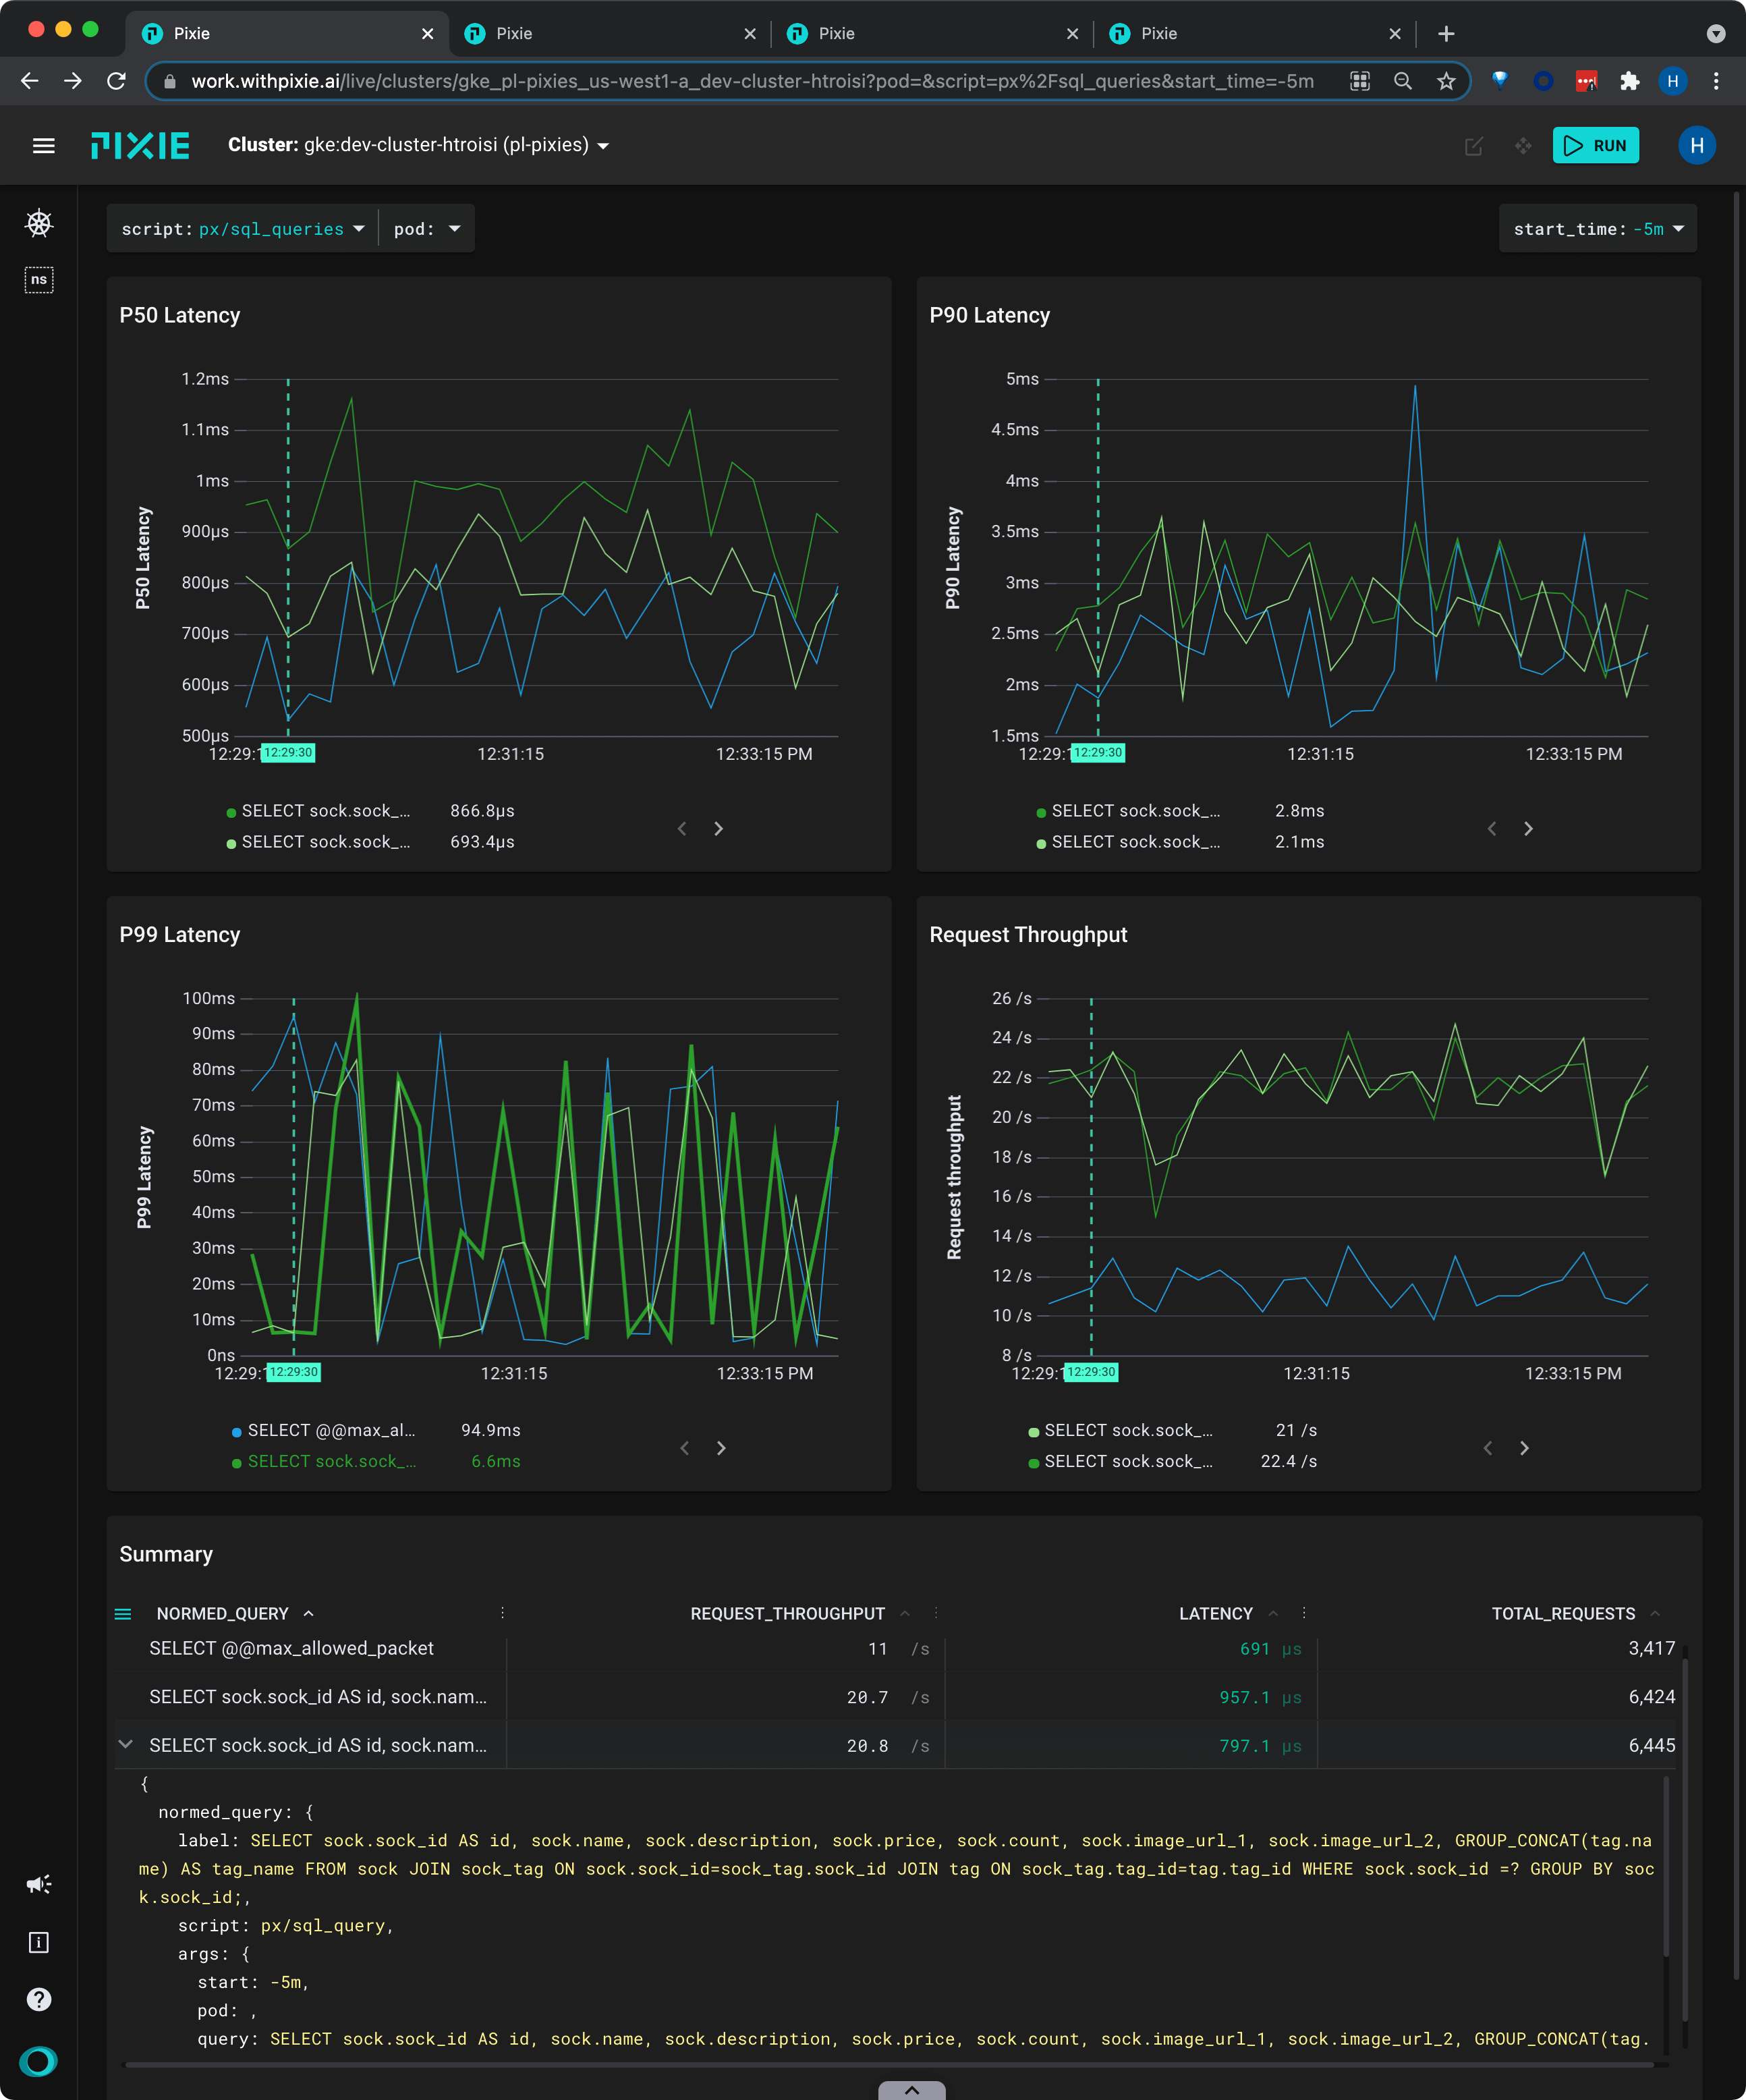
Let's examine one of the normalized SQL queries.
- Scroll down to the Summary table.
For longer queries, it's often easier to view the data in JSON form.
- Hover over the third row. Click the
>that appears to expand the row.
Inspect the query and you'll see that the
sock_idvalues have been replaced with the?placeholder.
- Click the
>to close the row.
Next, let's view latency, error and throughput for the constants passed to this normalized query.
- Instead of clicking the
>, click the actual query text (SELECT sock.sock_id AS...) for the same row.
This script shows latency, error, and throughput for each individual parameter for the given normalized SQL query.
The Summary table shows the individual parameters passed to
sock_idin the normalized query.
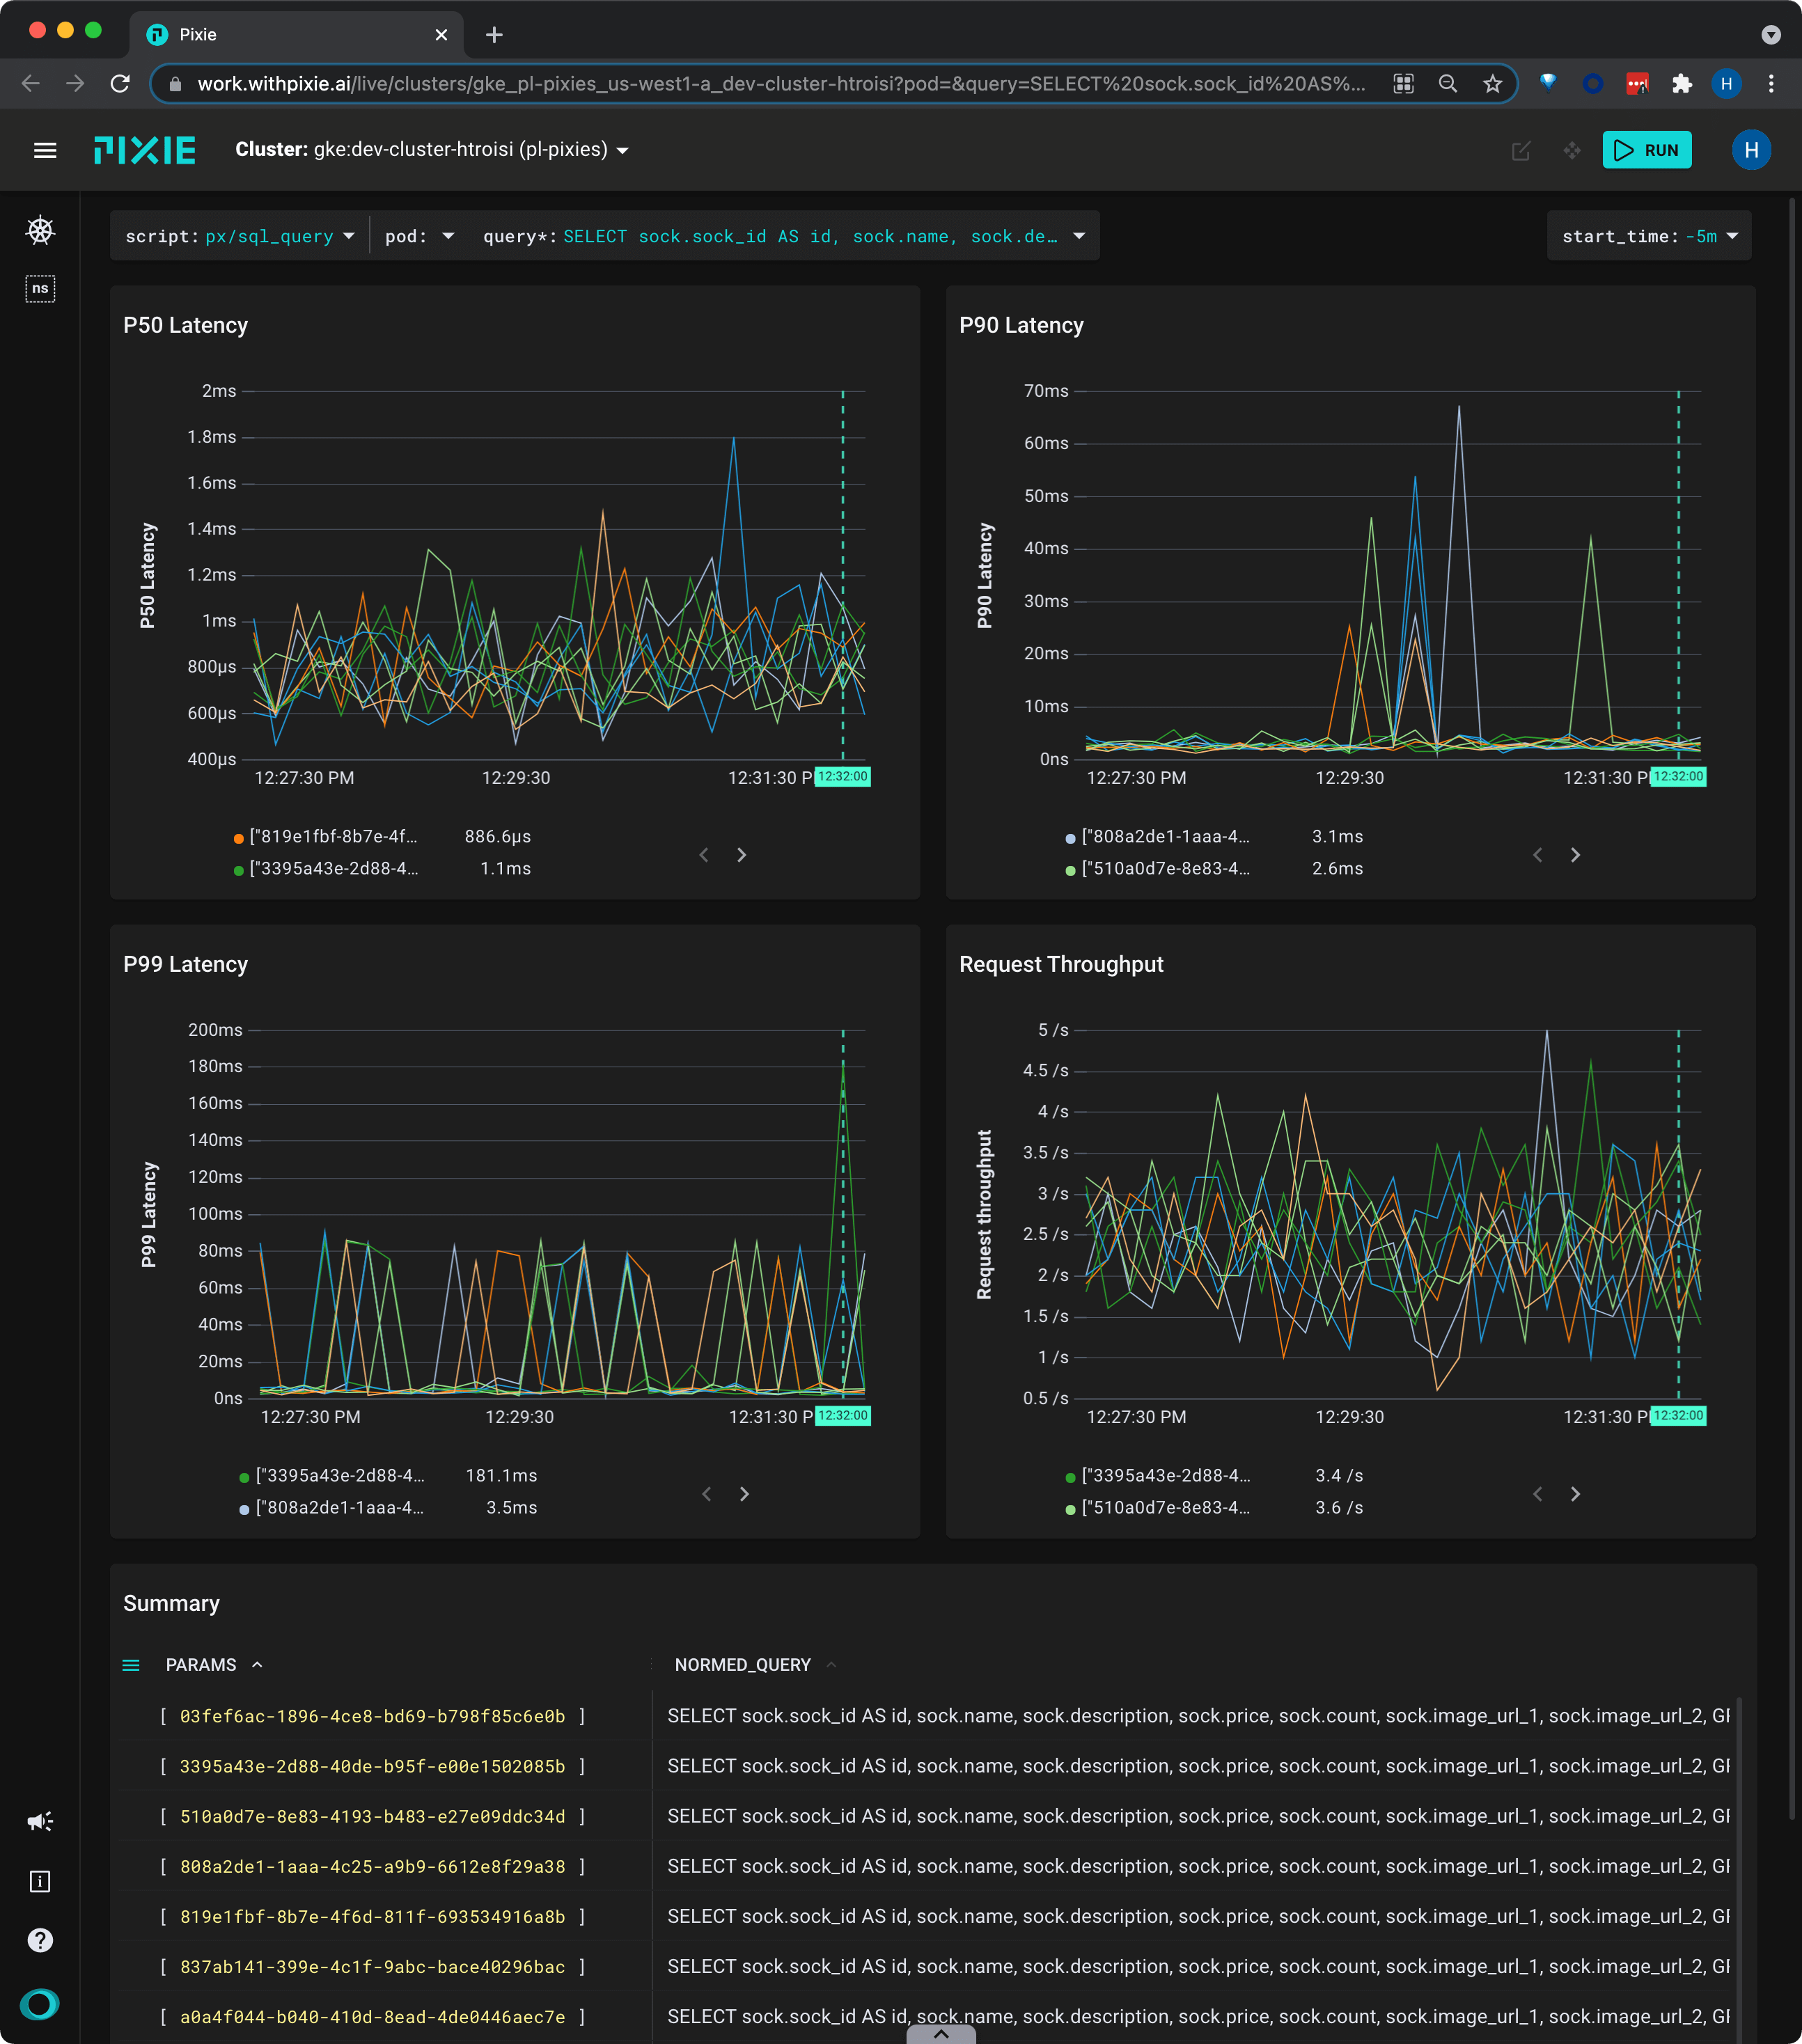
- Hover over the "Summary" table and scroll to the right to see latency stats per parameter.
Individual Full Body Requests
Pixie captures all network traffic that passes through your cluster (it supports both server and client-side tracing). For supported protocols, this traffic is parsed into messages that are paired with their responses.
Let's inspect the most recent MySQL requests flowing through your cluster, including the full request and response bodies.
- Select
px/mysql_datafrom thescriptdrop-down menu at the top of the page.
This script shows the most recent MySQL requests flowing through your cluster, including the full request and response bodies.
Pixie is able capture any request that flows through the cluster, as long as at least one endpoint is within the cluster.
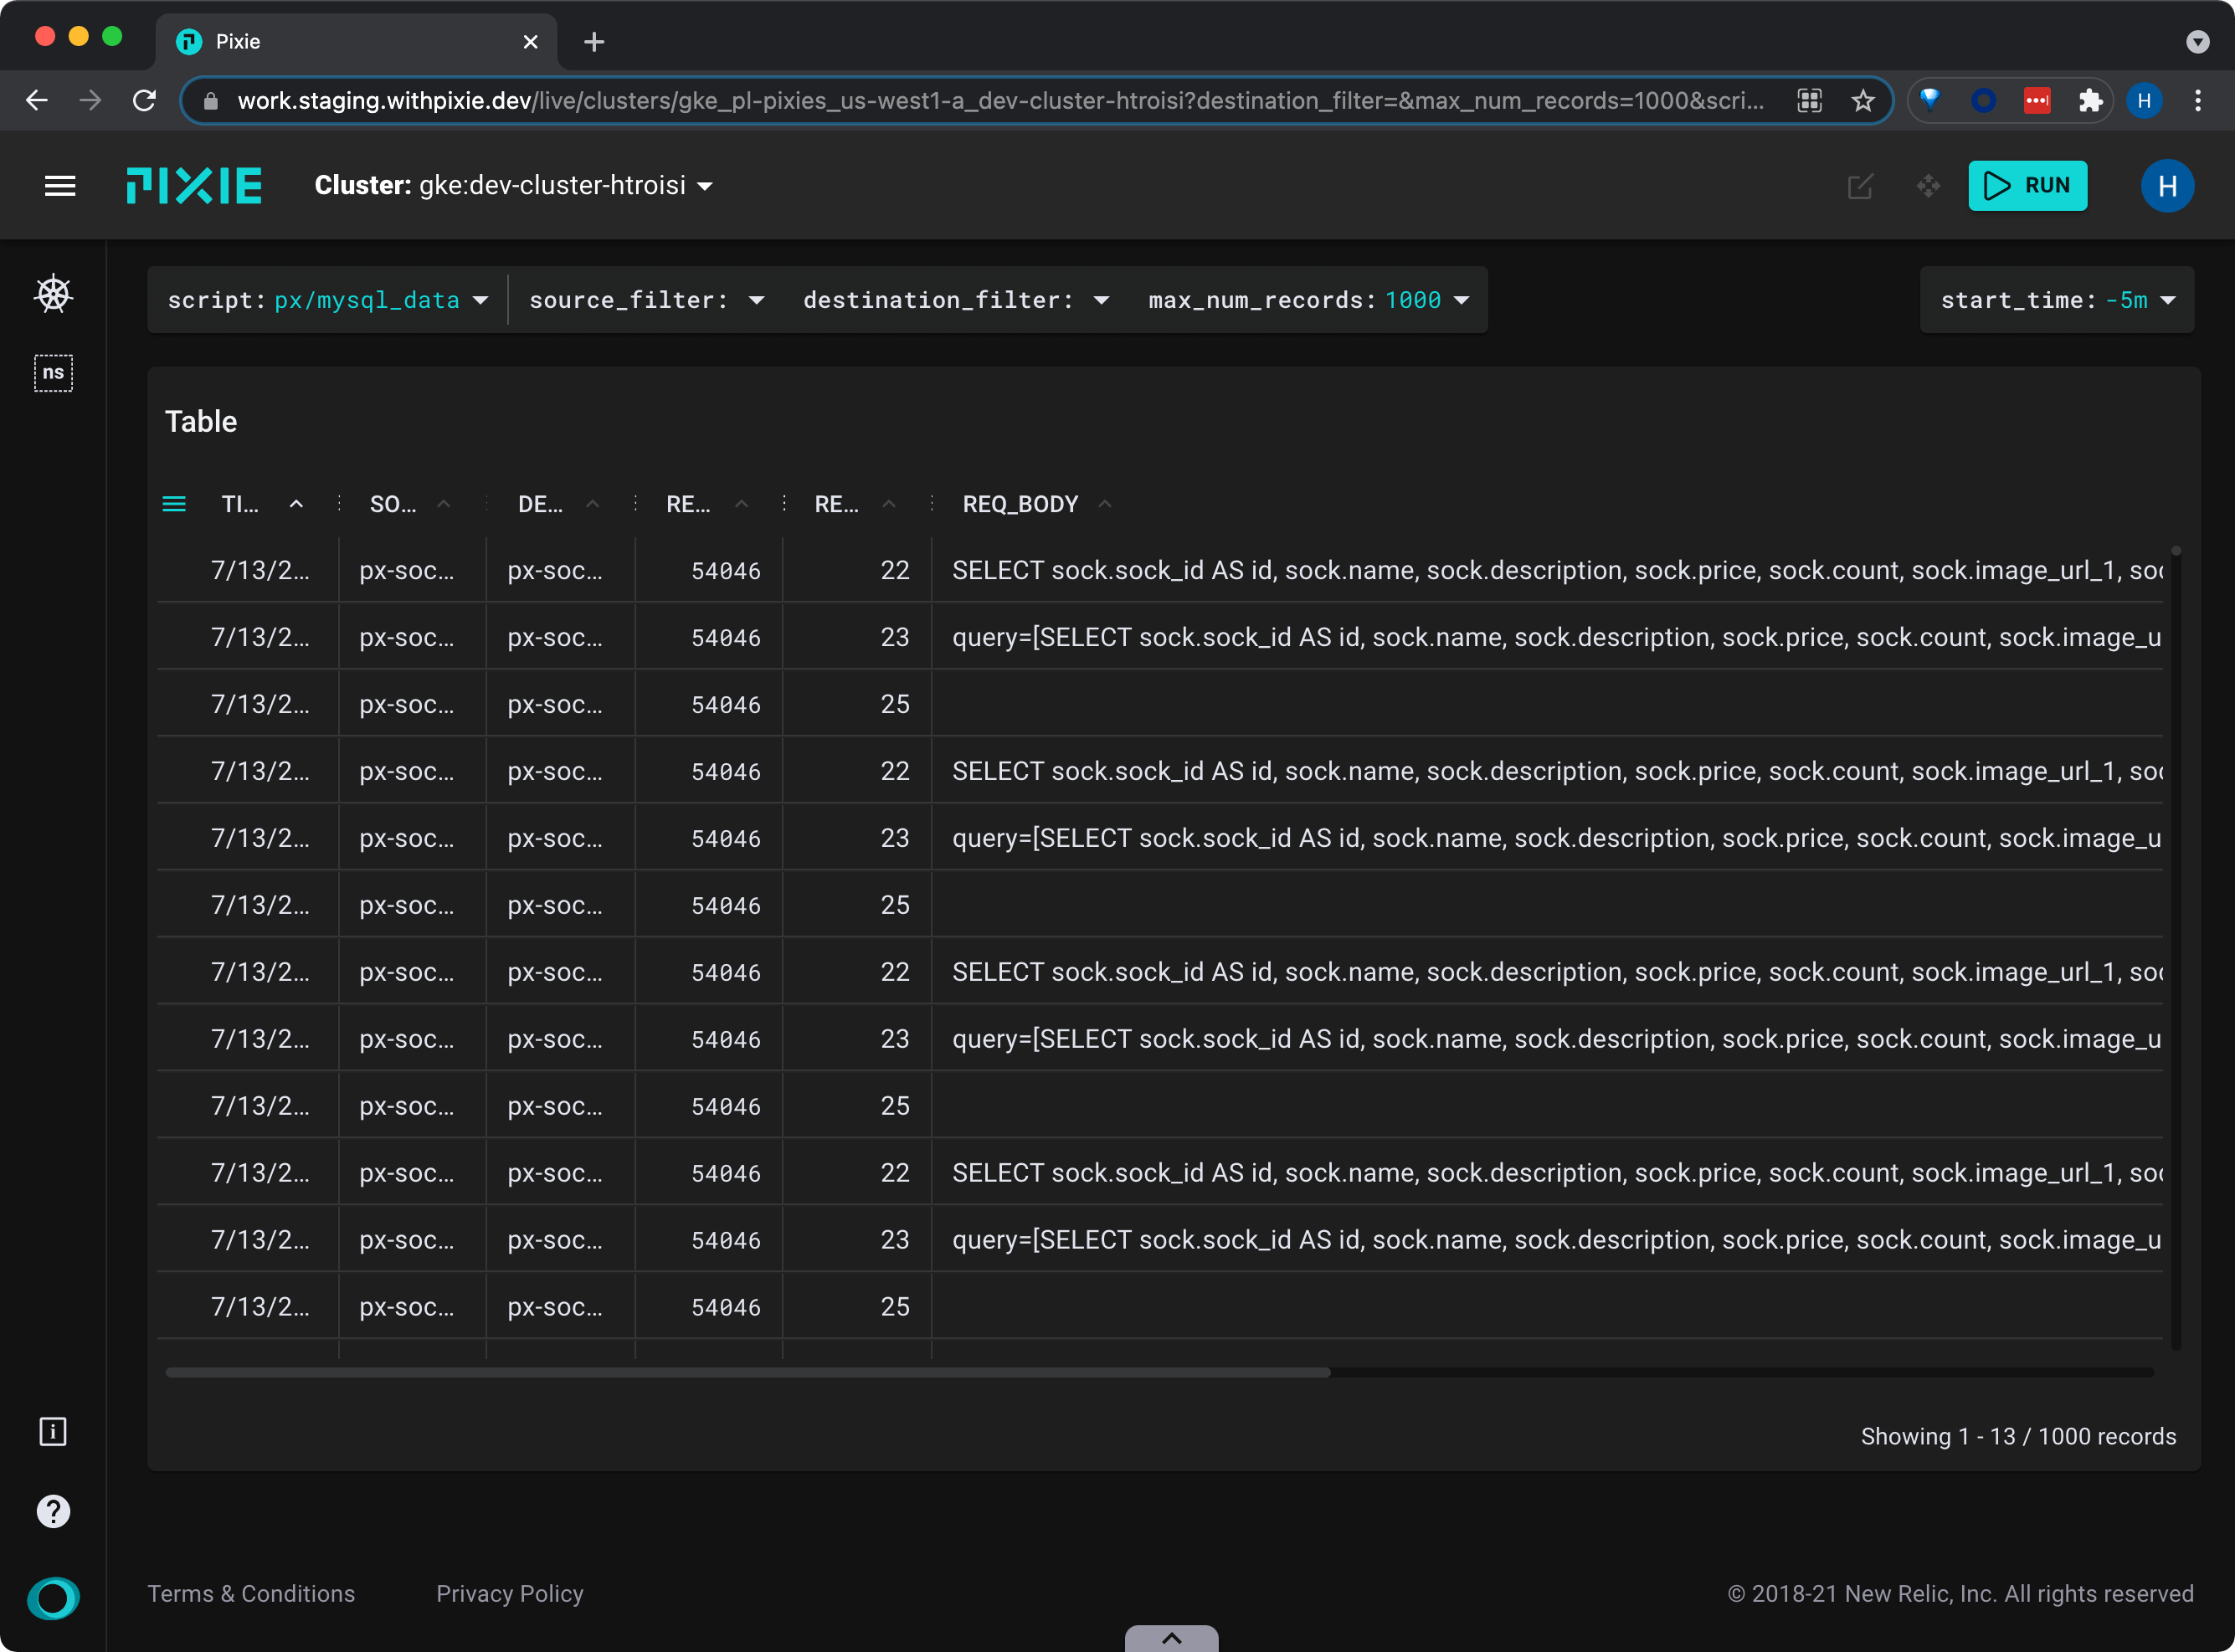
For requests with longer message bodies, it's often easier to view the data in JSON form.
- Click on a table row to see the row data in JSON format. Scroll through the JSON data to find the
resp_bodykey. - Click the table row again to collapse the JSON view.
- Scroll to the last column of the table to see latency data for the individual requests.
- Click on the
LATENCYcolumn title to sort the table by descending latency.
Related Scripts
This tutorial demonstrated a few of Pixie's community scripts. For more insight into your database queries, check out the following scripts.
PostgreSQL
- px/pgsql_data shows the most recent Postgres requests in the cluster.
- px/pgsql_stats shows latency, error, and throughput rate for a pod's PostgreSQL requests.
- px/pgsql_flow_graph shows a graph of the PostgreSQL messages in the cluster with latency stats.
Redis
- px/redis_data shows the most recent Redis requests in the cluster.
- px/redis_stats shows latency, error, and throughput rate for a pod's Redis requests.
- px/redis_flow_graph shows a graph of the Redis messages in the cluster with latency stats.
Cassandra
- px/cql_data shows the most recent Cassandra requests in the cluster.
- px/cql_stats shows latency, error, and throughput rate for a pod's Cassandra requests.