Tutorials | Pixie 101 | Network Monitoring (original) (raw)
Network performance can have a big impact on the health of your services. With Pixie, you can easily monitor your network alongside your application and infrastructure layers.
This tutorial will demonstrate how to use Pixie to see:
- The flow of network traffic within your cluster.
- The flow of DNS requests within your cluster.
- TCP drops and TCP retransmits across your cluster.
Prerequisites
- You will need a Kubernetes cluster with Pixie installed. If you do not have a cluster, you can create a minikube cluster and install Pixie using one of our install guides.
Network Traffic Across Pods
A global view of the network traffic flowing within a cluster can be used to:
- Quickly determine which services are communicating.
- Identify any misconfigured services.
- Identify load balancing issues.
Let’s use the px/net_flow_graph script to see a graph of all of the network traffic passing through the cluster:
- Open the Live View and select
px/net_flow_graphfrom thescriptdrop-down menu at the top.
When the script opens, you’ll get an error indicating a value is missing for the
namespacerequired argument. The UI denotes required script arguments with an asterisk after the argument name.
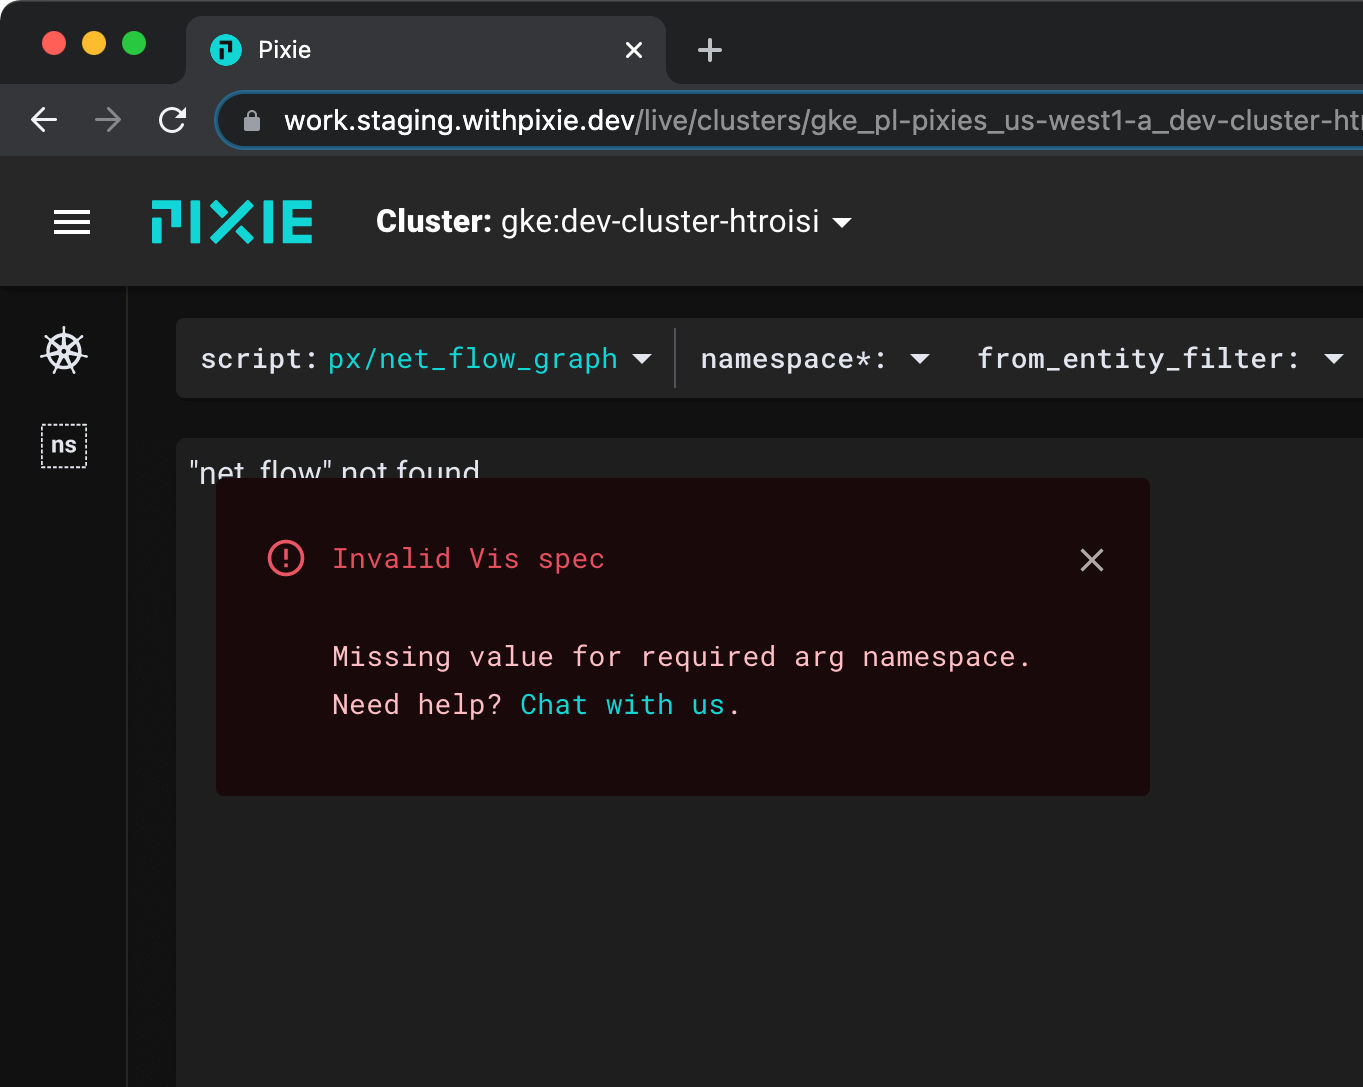
- Enter
plfor the requirednamespaceargument.
Select the drop down arrow next to the
namespaceargument, typepl, and hit Enter.plis the namespace that Pixie deploys to.
This script shows a mapping of all the outgoing connections for the pods in the specified namespace.
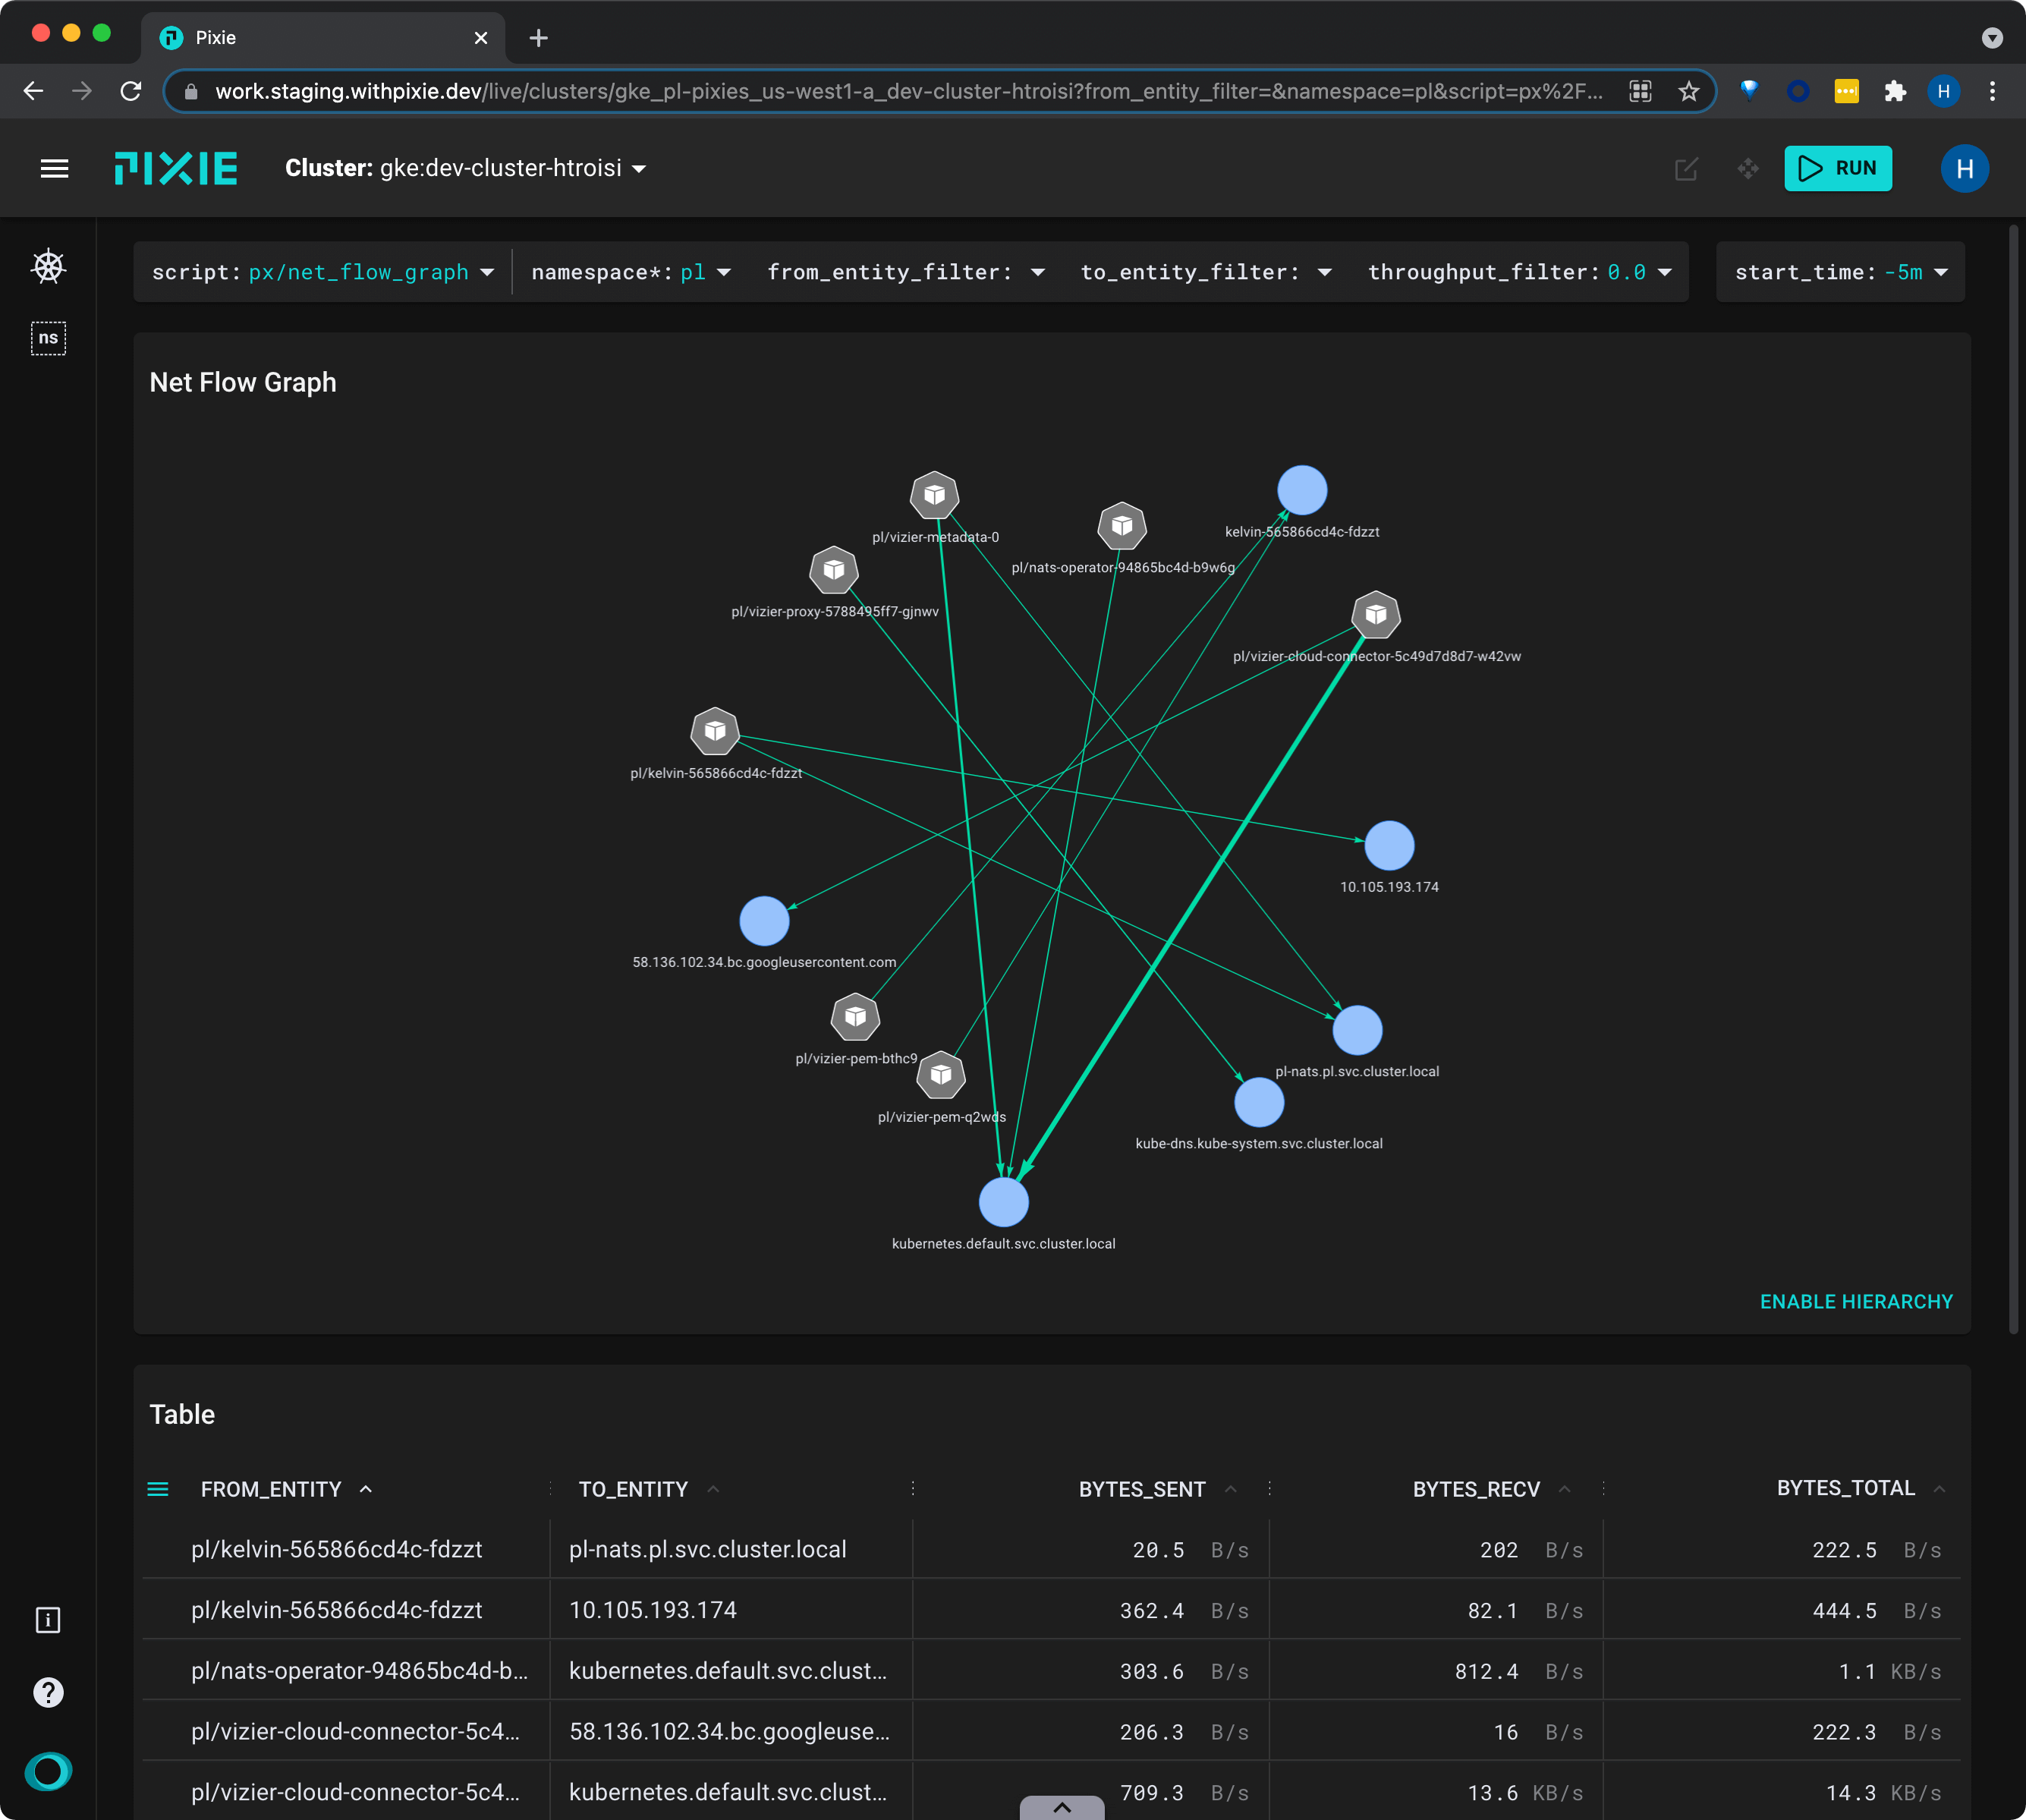
Let's filter the graph to only show communication to the
pl-natspod.
- Select the drop down arrow next to the
to_entity_filterargument, typepl-nats, and press Enter to re-run the script.
The graph should update to only show network traffic sent to the
pl-natspod. Pixie uses NATS as our messaging system.
- Clear the
to_entity_filtervalue by selecting the drop-down arrow and pressing Enter. - Scroll down to the table below the graph. This table contains the same data that is used to construct the graph above.
DNS Requests Across Pods
Another capability Pixie provides is the ability to inspect and analyze DNS traffic. This information can be used to:
- Quickly determine which services are making DNS requests.
- Get high-level DNS latency and throughput information.
- Observe imbalances of throughput between DNS servers.
Let’s use the px/dns_flow_graph script to see a graph of DNS requests in the cluster:
- Select
px/dns_flow_graphfrom thescriptdrop-down menu.
This script shows all of the DNS requests made in the cluster, with latency and throughput stats.
This cluster doesn't have anything deployed except Pixie, so all we see are the kube-dns pods communicating with the metadata server.
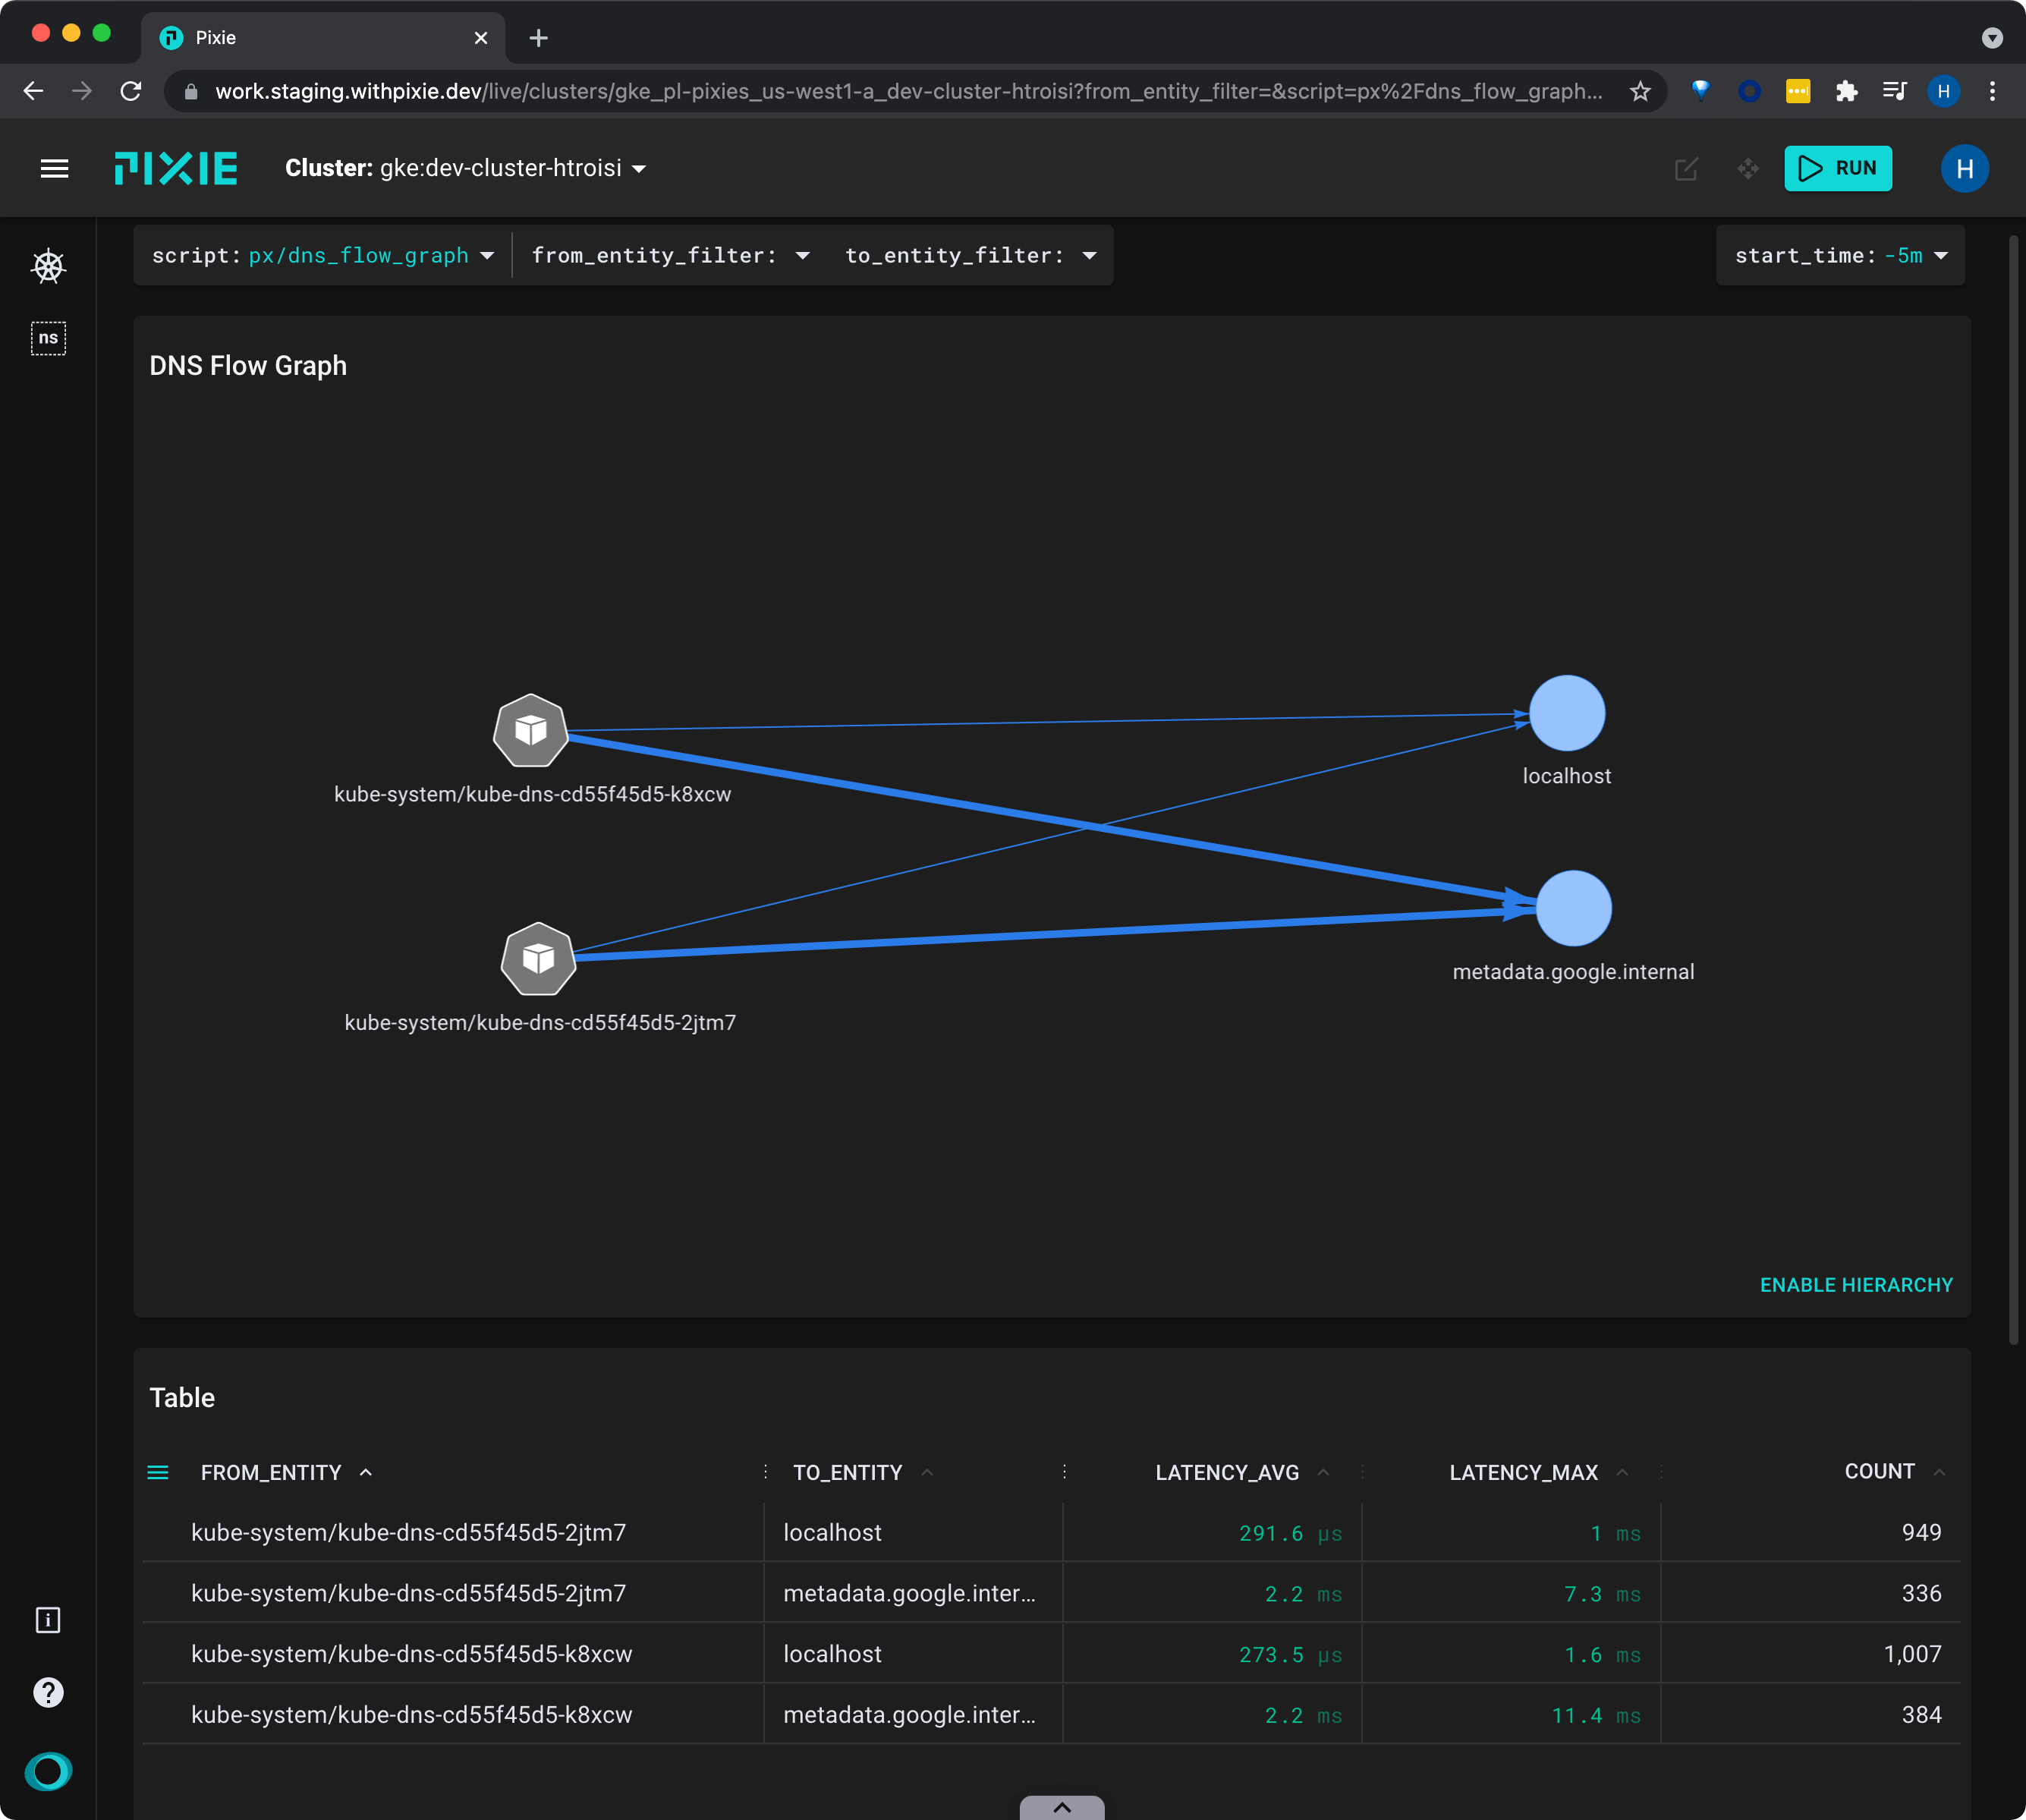
- Click on the
LATENCY_AVGcolumn title to sort the table data by average latency.
TCP Drops
TCP drops and retransmits can indicate network connectivity issues that may affect application performance.
Let's use the bpftrace/tcp_dropsscript to see a global view of TCP drops across the cluster.
- Select
bpftrace/tcp_dropsfrom the script drop-down menu. - Press the "RUN" button in the top right and the script will first deploy a tracepoint (the new data source) and then query the new data source.
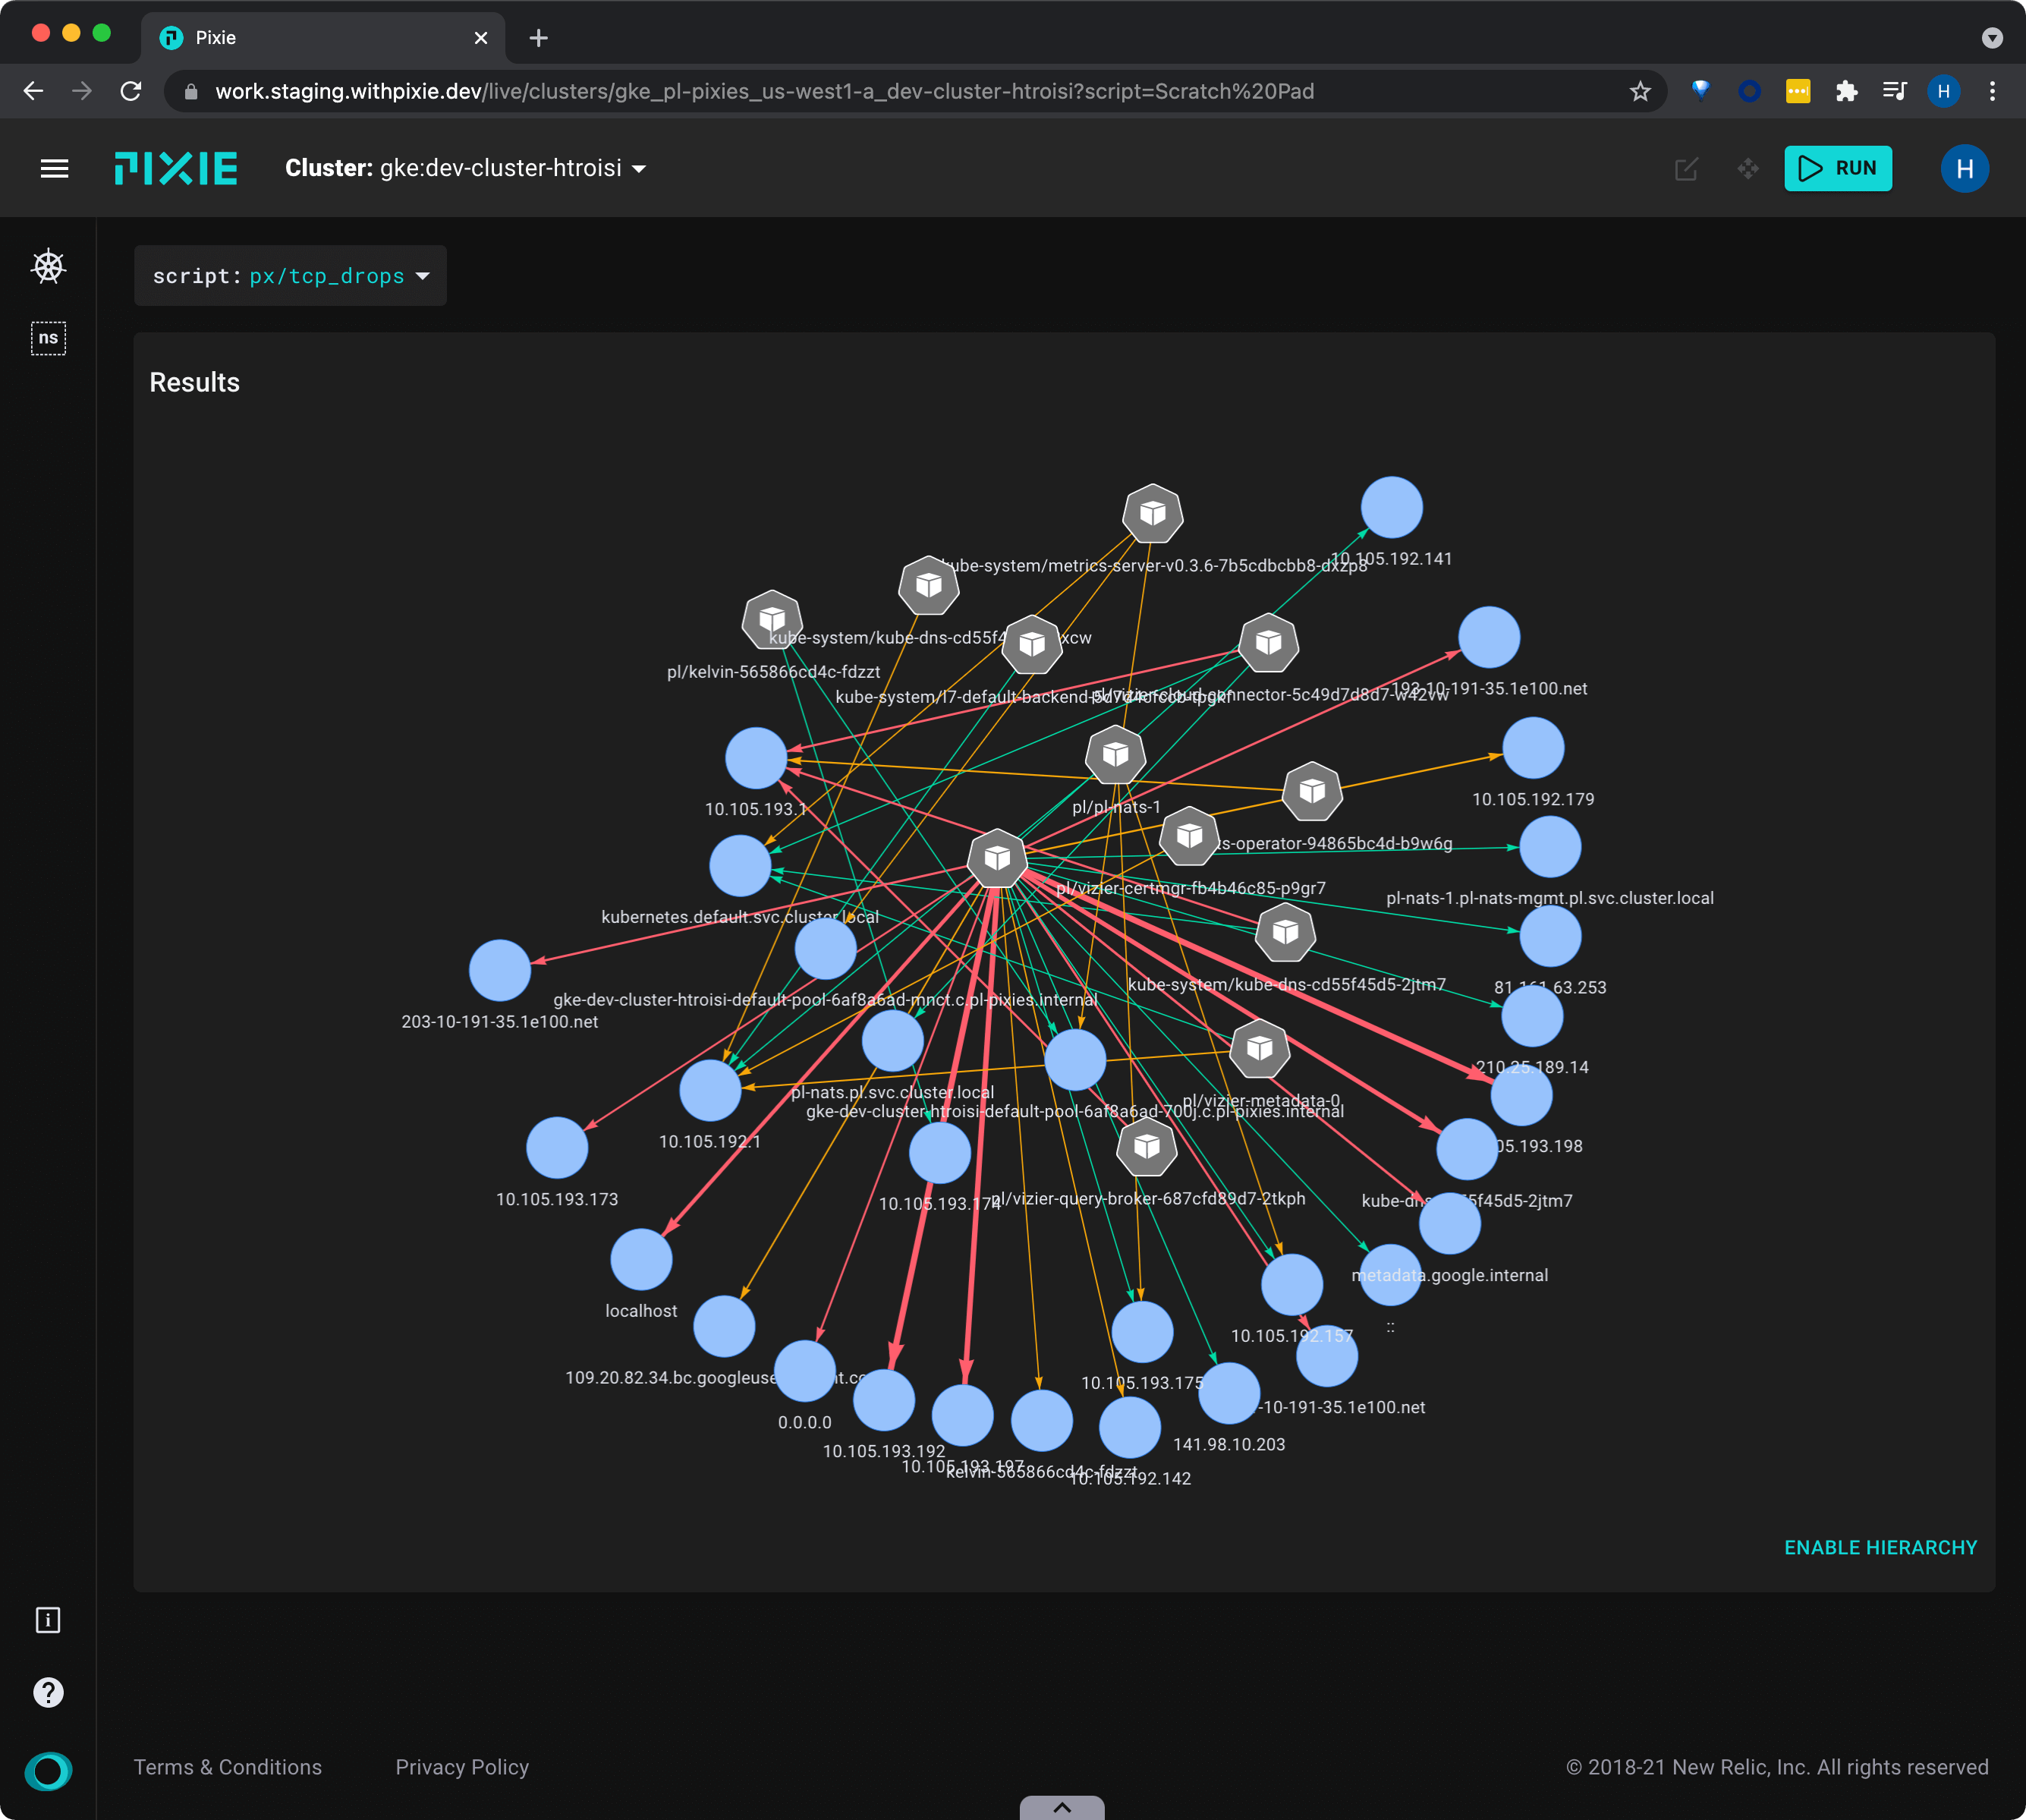
- Hover over an edge to see the number of drops between pod pairs. The color and thickness of the edges indicate an increase in the number of TCP drops.
- After a few seconds have passed, press the "RUN" button once again. Since more time has elapsed since the tracepoint was deployed, you should see more data in the graph.
Related Scripts
This tutorial demonstrated three of Pixie's community scripts. For more insight into your network, check out the following scripts:
- px/dns_data shows the most recent DNS requests in your cluster, including the full request and response bodies.
- bpftrace/tcp_retransmits graphs the TCP retransmission counts across your cluster. Don't forget to click the RUN button.