Using Pixie | Using the CLI (original) (raw)
You can interact with the Pixie platform using the CLI, web-based Live UI or API.
Scripts run in the CLI omit certain visualizations seen in the Live UI. For this reason, we recommend that developers who are new to Pixie begin by using the Live UI.
Setup
Pixie needs to be installed on your Kubernetes cluster. If it is not already installed, please consult our install guides.
Pixie's Open Source Scripts
Run the following command to list all of Pixie's open source scripts.
Running your first PxL Script
You can run any PxL script using:
Let's try run Pixie'spx/namespaces script:
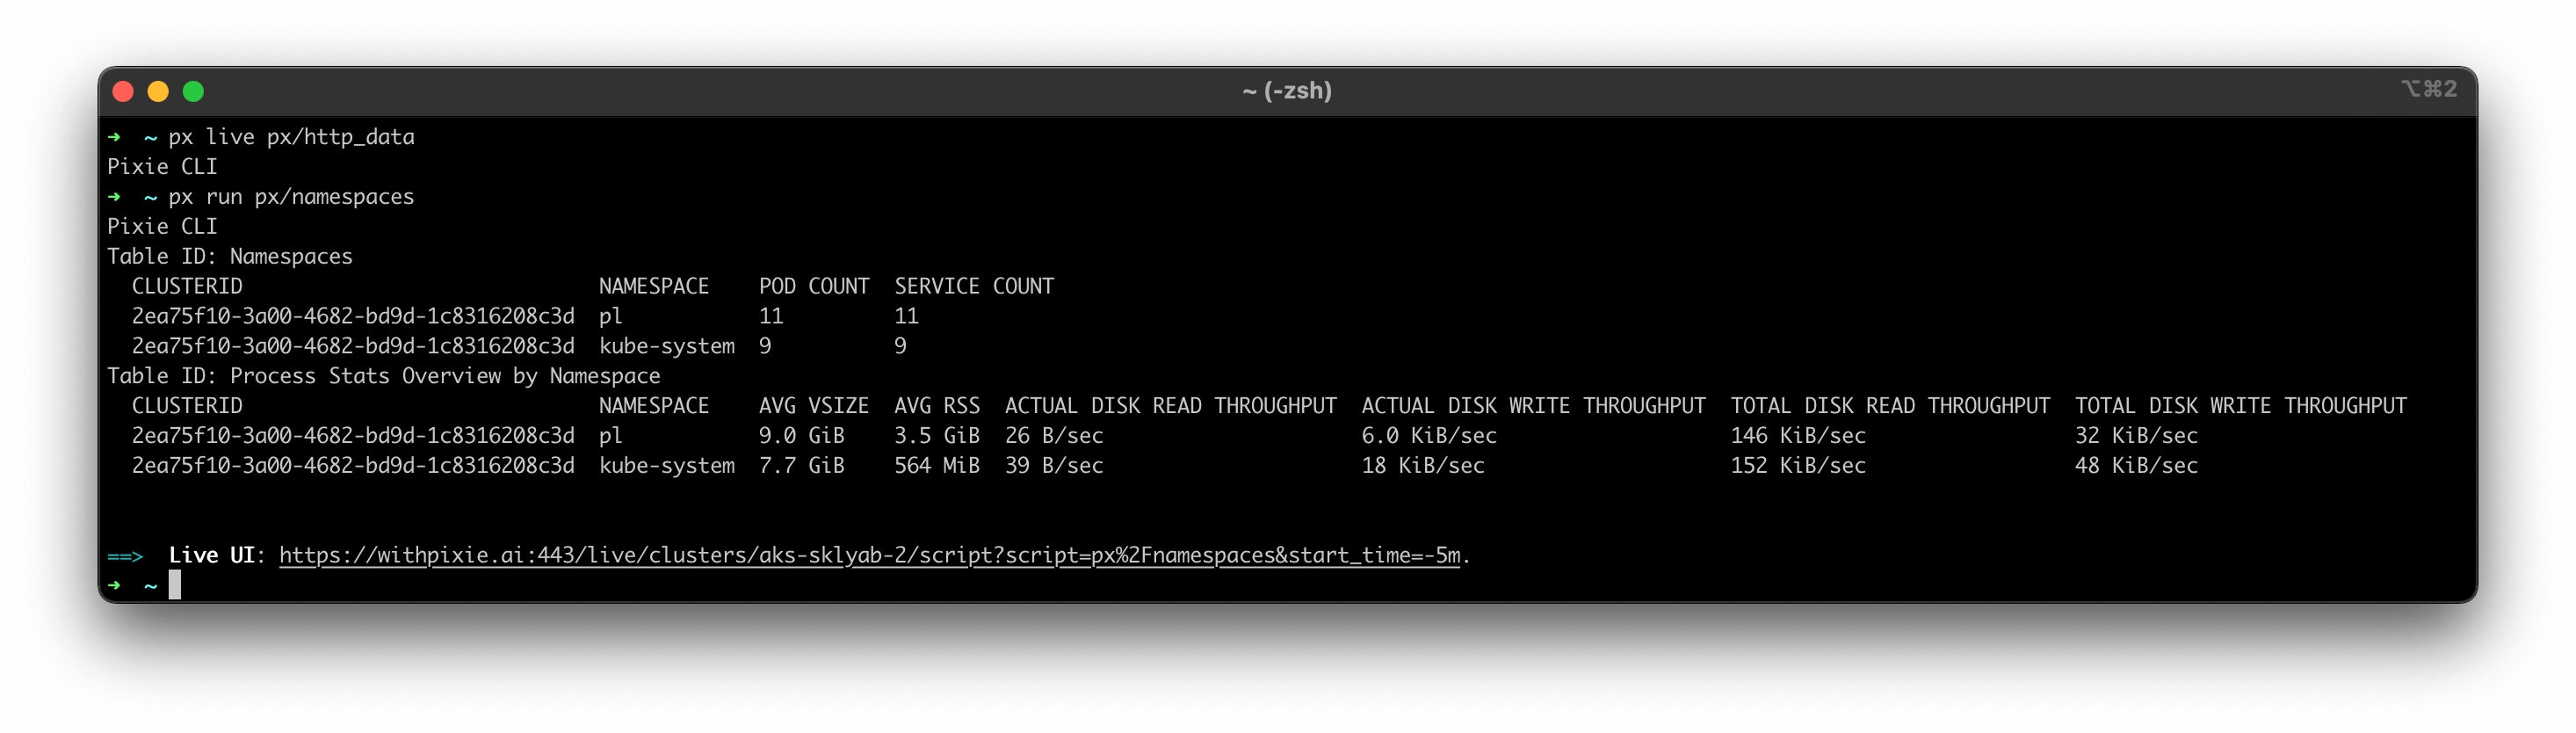
Output of the px/namespaces script in the CLI.
This script outputs two tables. The first table lists the namespaces on the current cluster and their pod and service counts. The second table lists the high-level resource consumption by namespace.
Selecting the Cluster
If Pixie is installed on multiple clusters, Pixie will use the cluster in the current kubectl context. To specify a different cluster, pass the cluster_ID with the -c flag.
Passing Arguments to a Script
To show a the input arguments for any PxL script:
Pixie's px/namespace script gives a top-level summary of the pods and services for a specific namespace. This script takes two arguments. If you don't provide arguments, the script will output an empty table (Pixie will soon enforce required arguments).
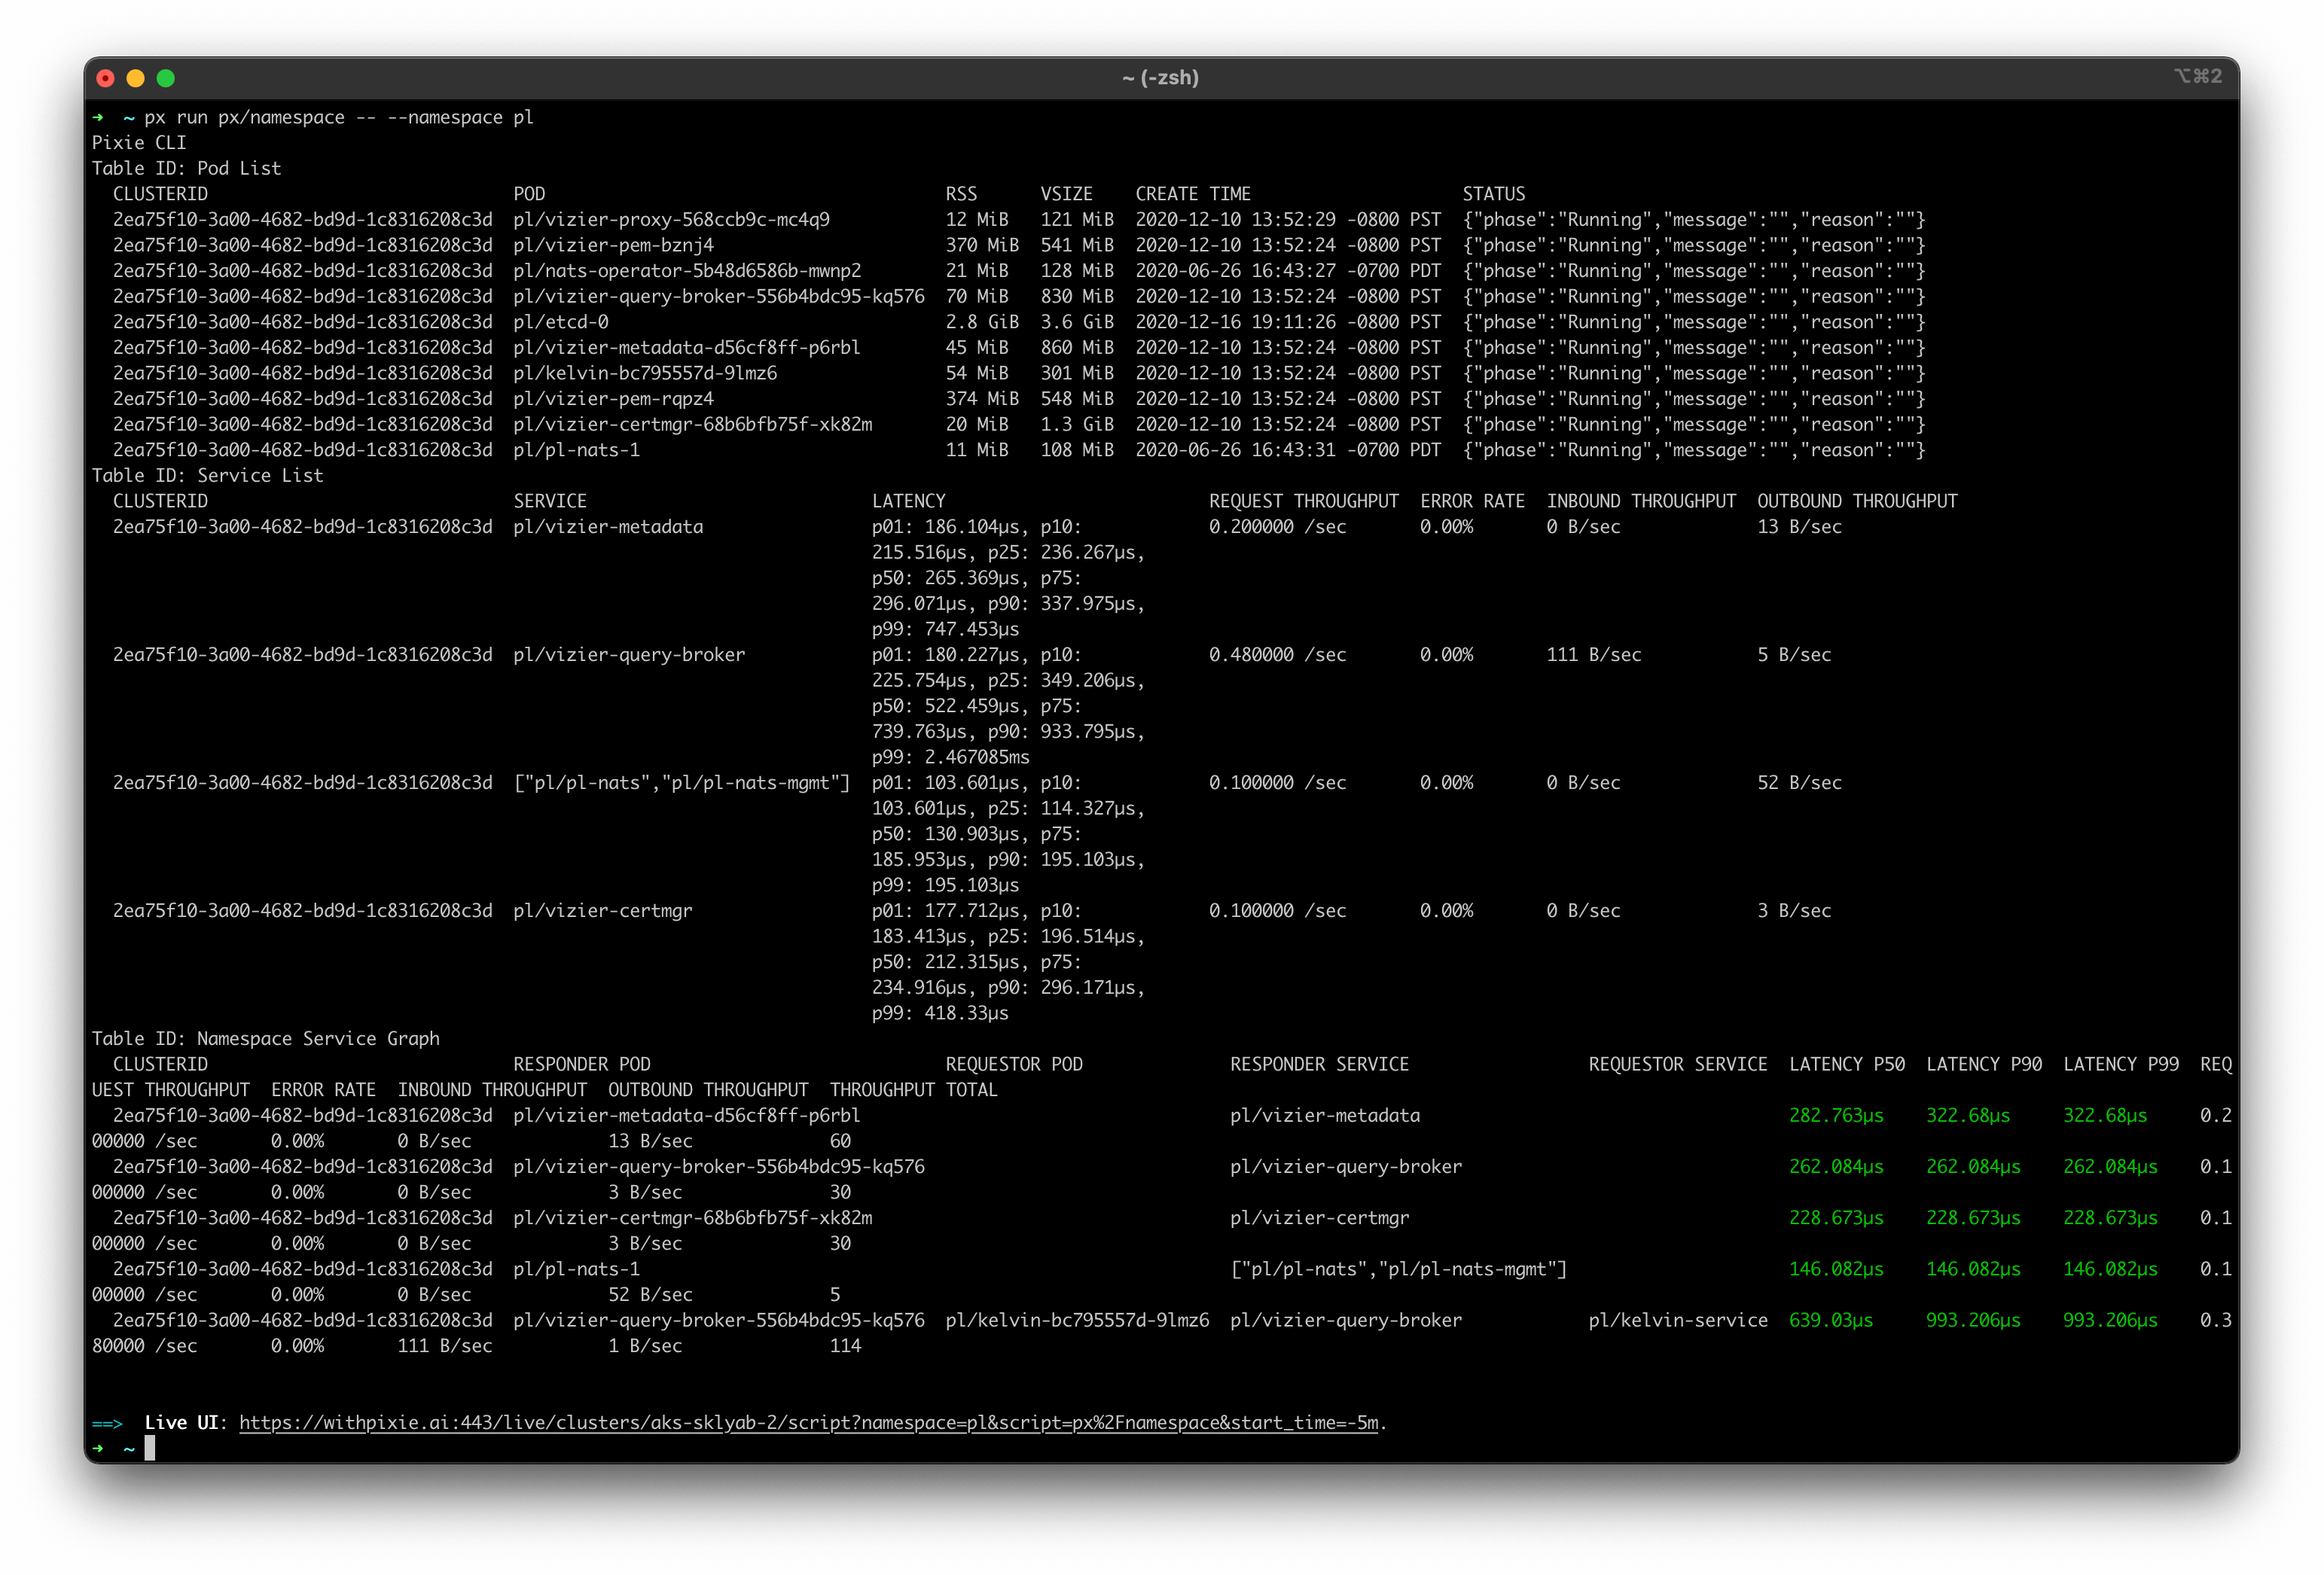
Output of the px/namespace script in the CLI.
This script outputs three tables and the output is difficult to view in the terminal.
Different Ways of Viewing a Script's Output
For scripts with verbose output (like the px/namespace script you ran above), we recommend the following ways of interacting with the output.
Output in a Different Format
Pixie supports json and csv output using the -o flag, making it easy to consume the script's output using other CLI tools.
Use the Live CLI
The Live CLI provides interactive views for output tables. To run the Live CLI, use px live instead of px run.
The px/namespace script outputs three tables, one per tab at the bottom left of the terminal window.
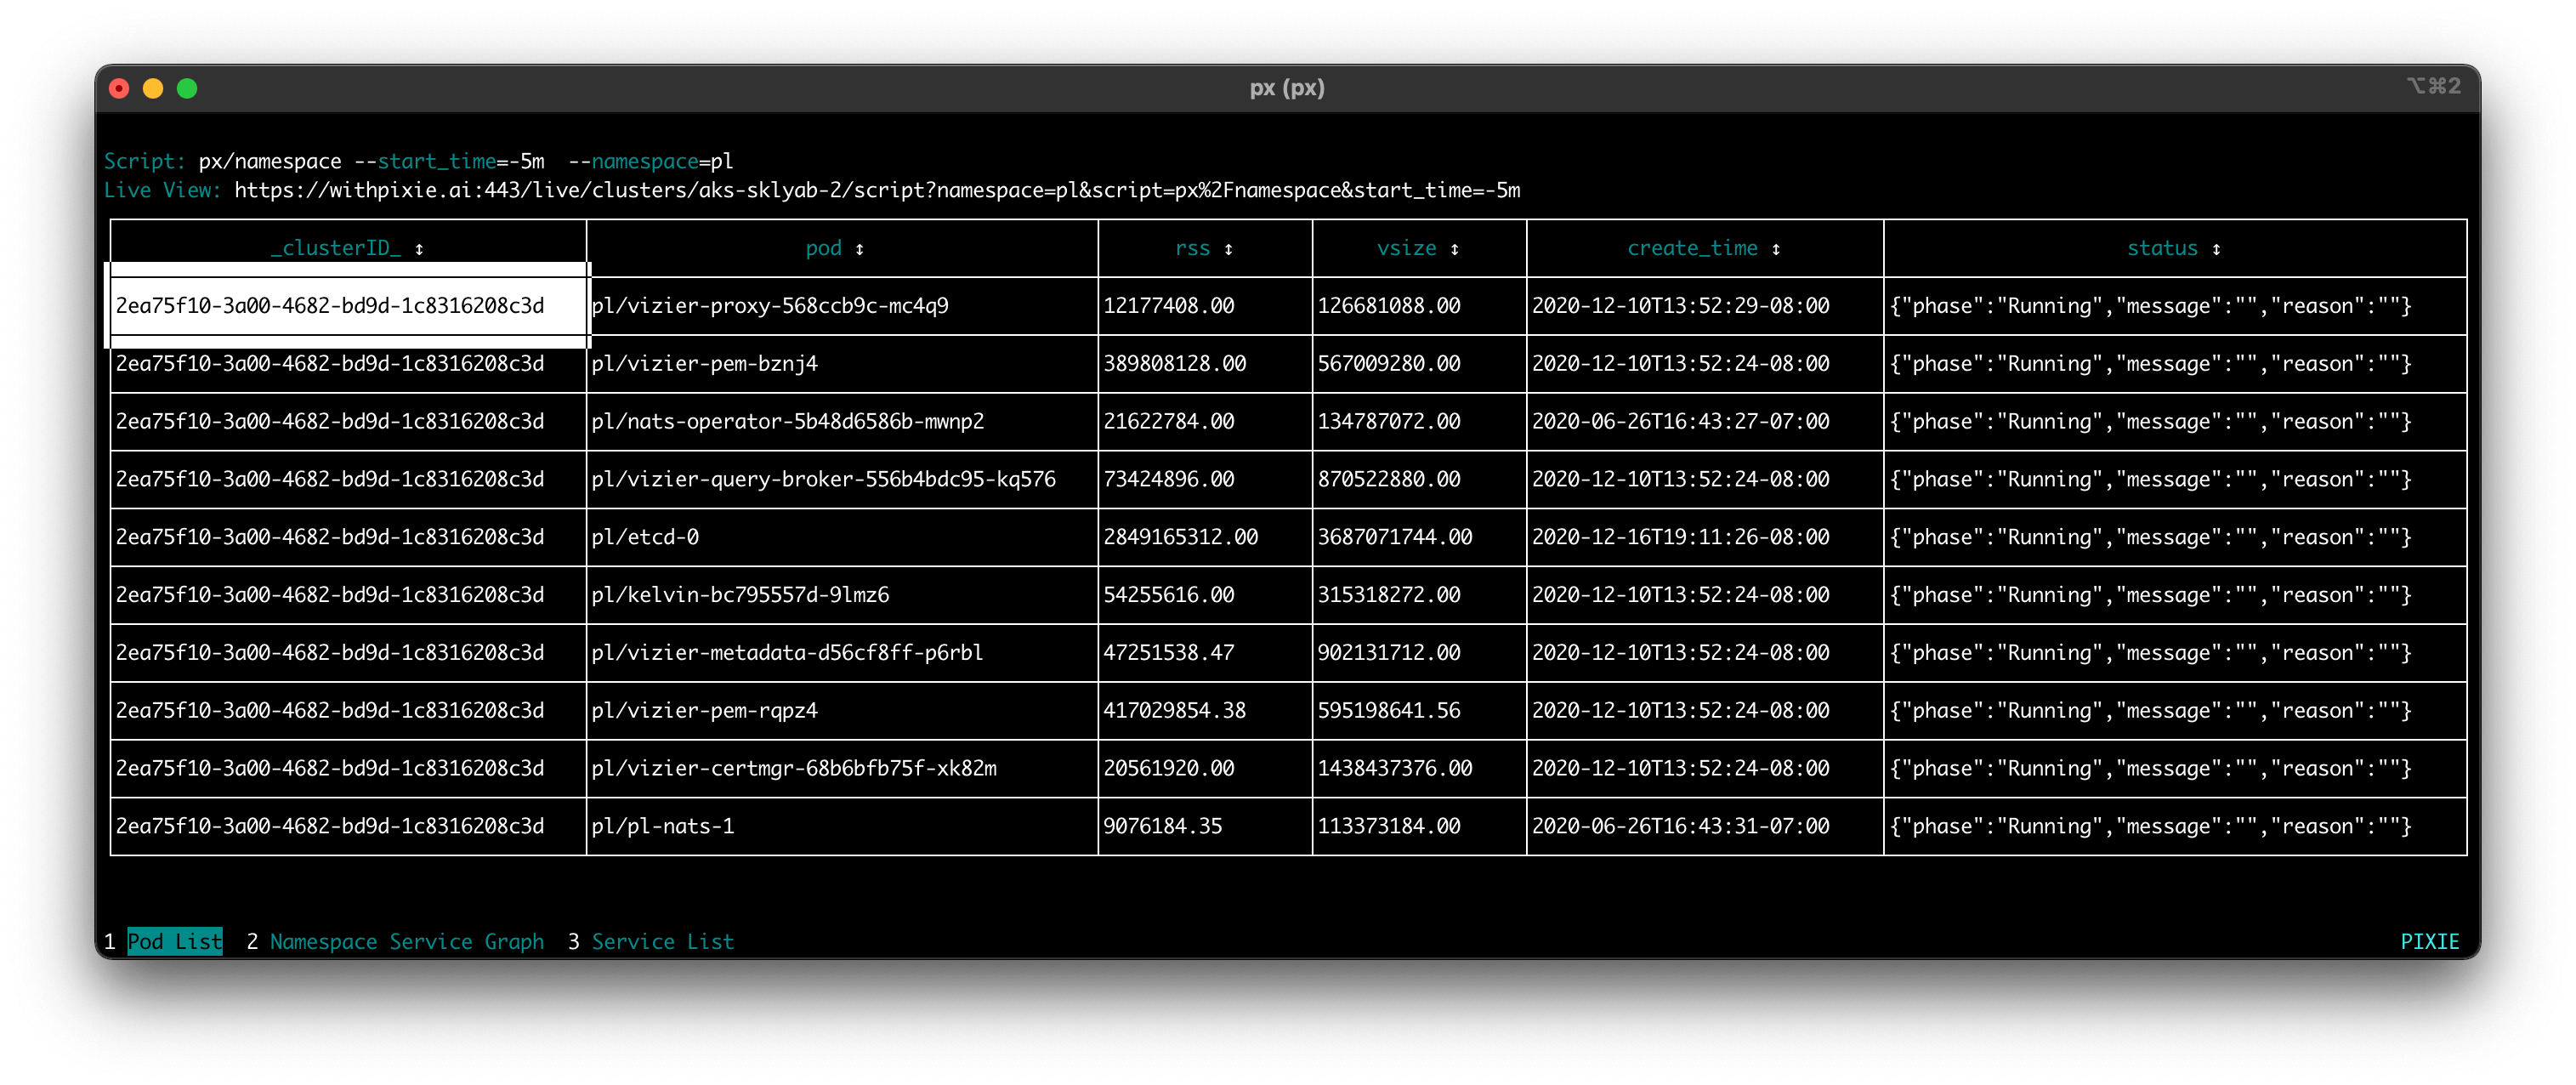
Output of the px/namespace script in the Live CLI.
You can interact with the Live CLI output:
- To switch between the output tables, use the number keys (or a mouse click) to select the table tabs listed at the bottom left of the terminal.
- To sort a column, click on a column title.
- To navigate the table cells, use your arrow keys (or click with your mouse).
- To expand a truncated table cell, use
ctrl+enterorctrl+click. - To display/hide the script, use
ctrl+v. - To run a different PxL script, use
ctrl+k.
Switch to the Live View
PxL has support for building visualizations (graphs, charts, etc), which can be viewed in Pixie's Live UI. A link to the Live UI view of a particular script is included in each script output in the CLI.
The Live UI link appears at the bottom of the output of any px run <script_name> output.
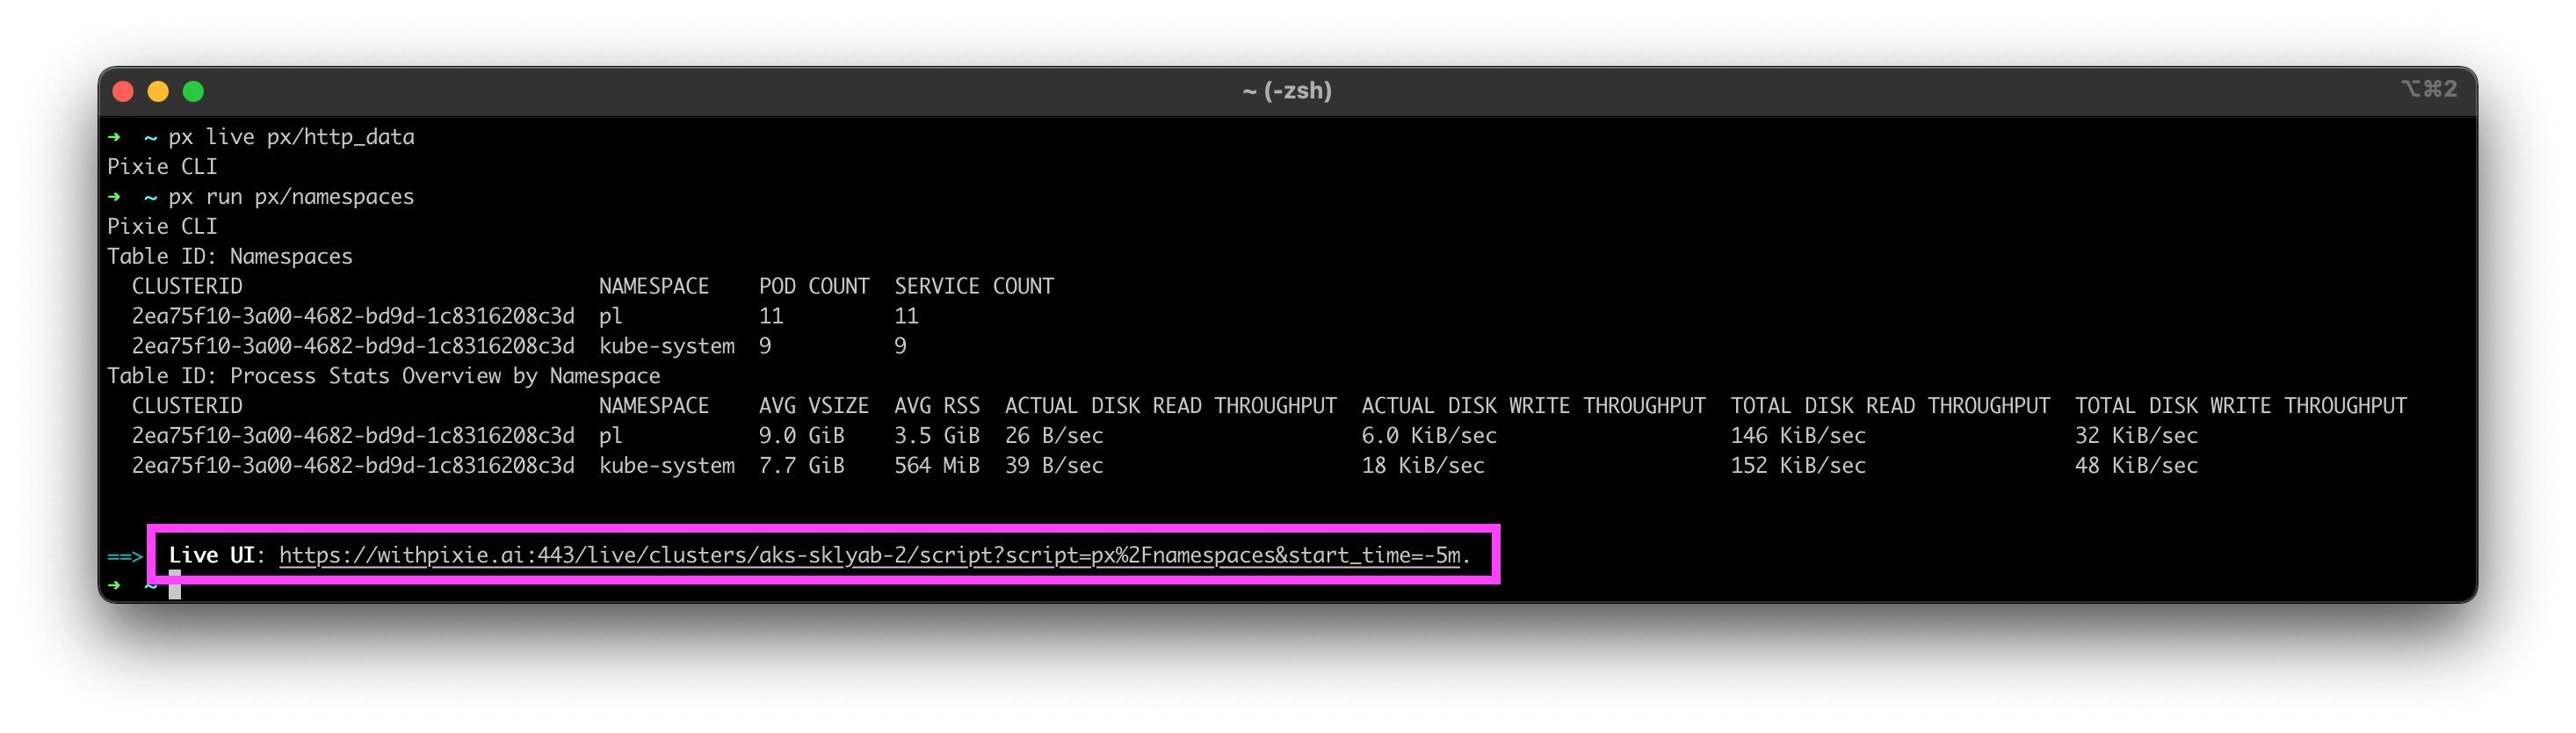
Linking to the Live UI view of a script from the CLI.
And at the top of the Live CLI output.
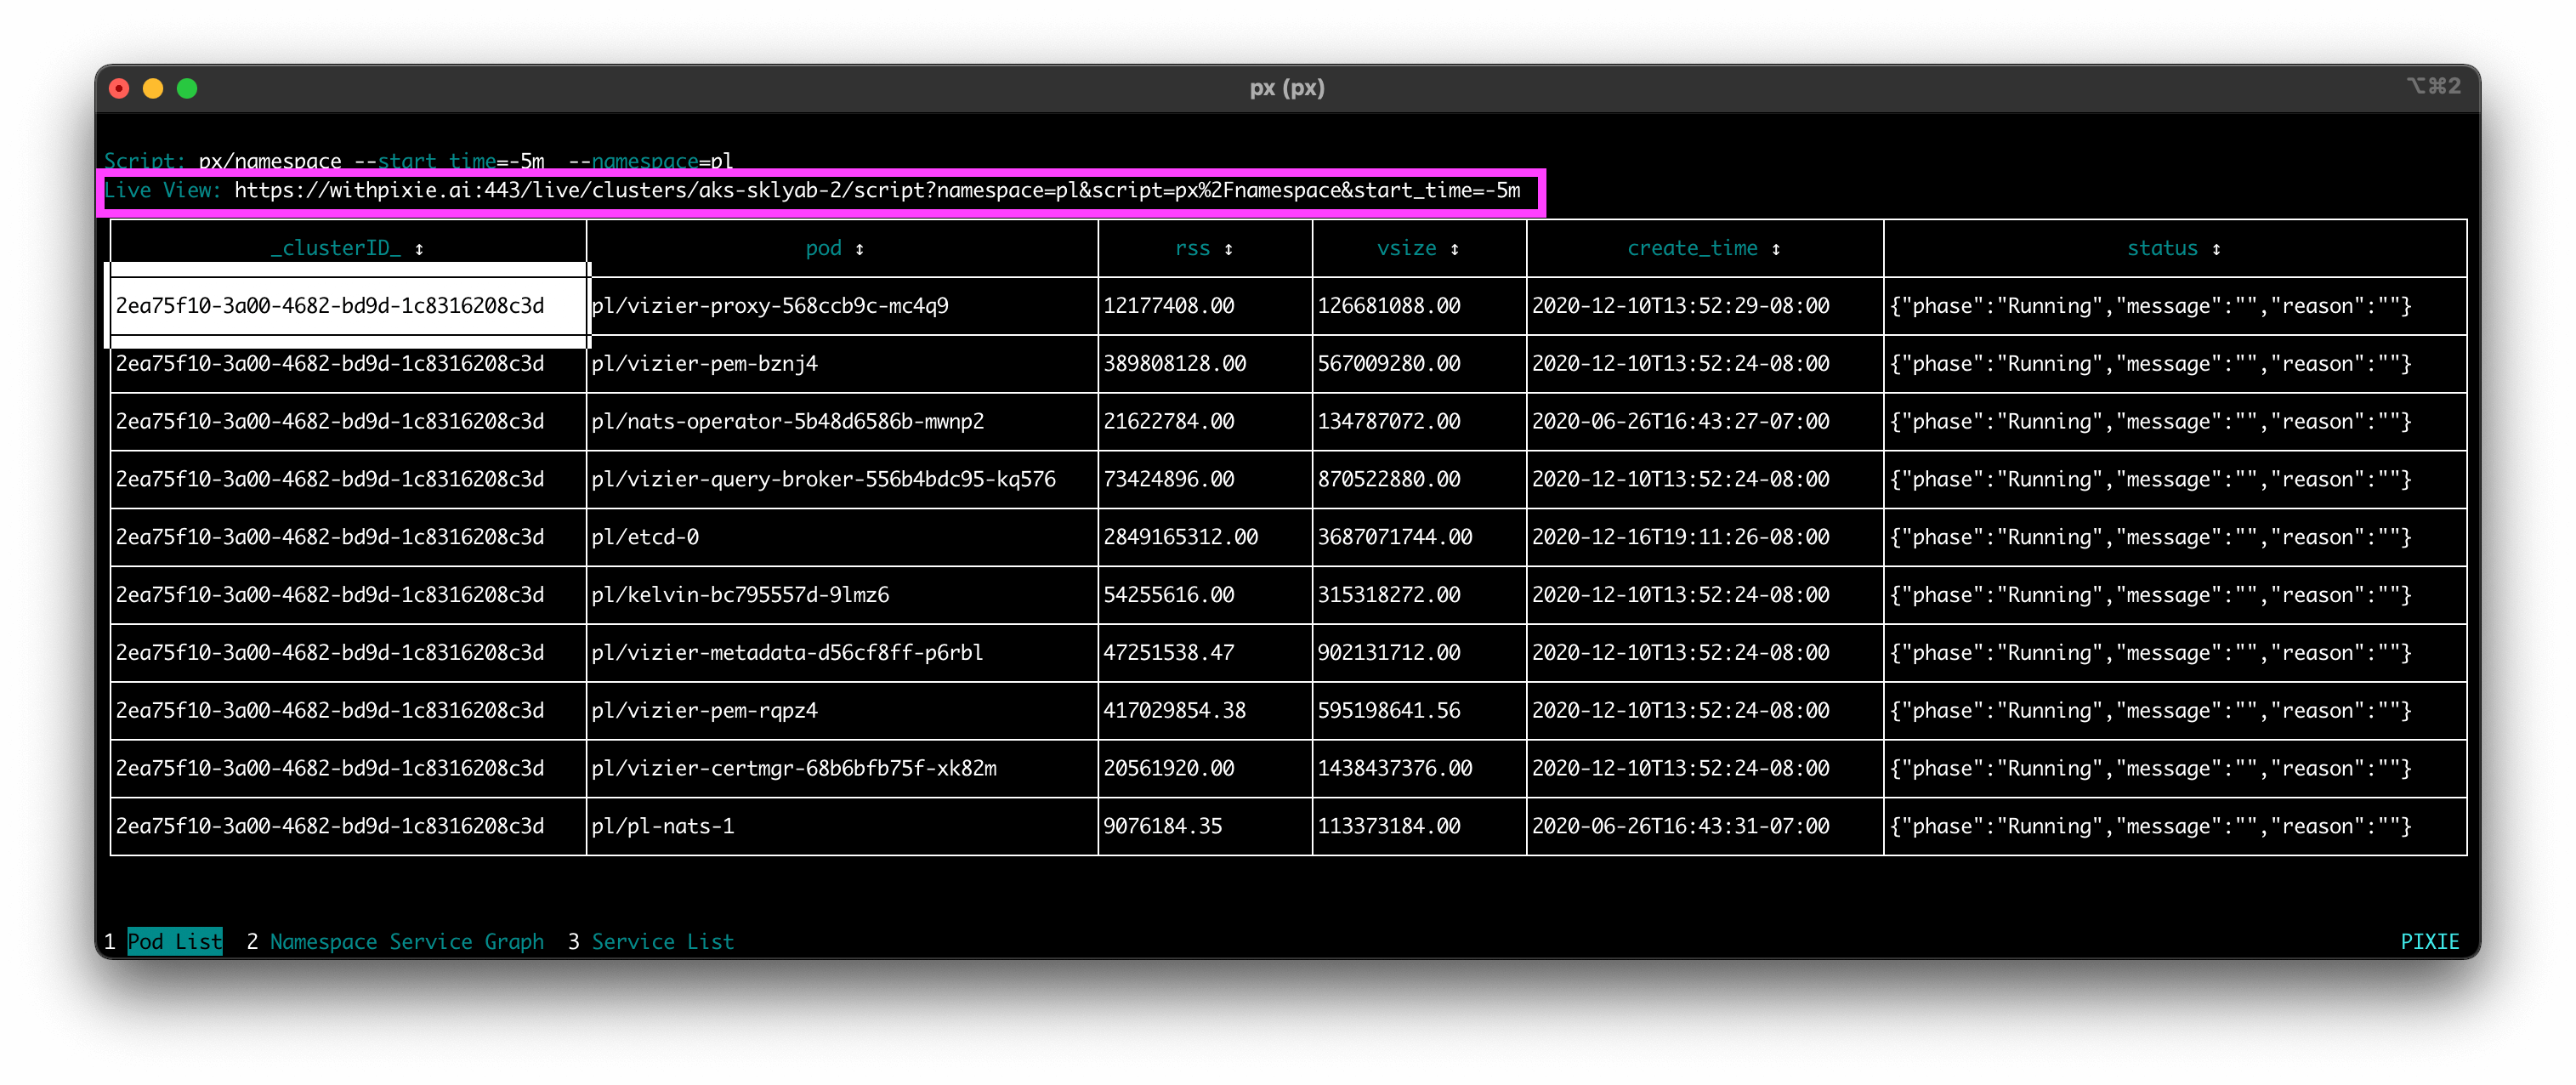
Linking to the Live UI view of a script from the Live CLI.
Use Case Tutorials
To learn how to use Pixie for a specific use case, check out one of the following tutorials:
Running a Custom PxL Script
To learn how to write custom PxL scripts, check out this tutorial.
To run your own PxL script using the CLI, use the -f flag to provide the script's filename.
Advanced
End-to-End Encryption
Pixie offers end-to-end encryption for telemetry data requested by the CLI. For more information, see the FAQ.
Encryption is controlled by the --e2e_encryption flag during script execution. Enabling E2E encryption adds some overhead to encrypt the results on the Vizier side and decrypt it on the CLI side.
Debugging Pixie using the CLI
Use the following commands to show the status of Pixie on your cluster:
To view all available Pixie CLI commands: