numpy.exp — NumPy v1.13 Manual (original) (raw)
numpy. exp(x, /, out=None, *, where=True, casting='same_kind', order='K', dtype=None, _subok=True_[, signature, _extobj_]) = <ufunc 'exp'>
Calculate the exponential of all elements in the input array.
| Parameters: | x : array_like Input values. out : ndarray, None, or tuple of ndarray and None, optional A location into which the result is stored. If provided, it must have a shape that the inputs broadcast to. If not provided or None, a freshly-allocated array is returned. A tuple (possible only as a keyword argument) must have length equal to the number of outputs. where : array_like, optional Values of True indicate to calculate the ufunc at that position, values of False indicate to leave the value in the output alone. **kwargs For other keyword-only arguments, see theufunc docs. |
|---|---|
| Returns: | out : ndarray Output array, element-wise exponential of x. |
See also
Calculate exp(x) - 1 for all elements in the array.
Calculate 2**x for all elements in the array.
Notes
The irrational number e is also known as Euler’s number. It is approximately 2.718281, and is the base of the natural logarithm,ln (this means that, if  , then
  . For real input,
 exp(x) is always positive.
For complex arguments, x = a + ib, we can write . The first term,
  , is already known (it is the real argument, described above). The second term,
 , is
, is  , a function with magnitude 1 and a periodic phase.
References
| [R18] | Wikipedia, “Exponential function”,http://en.wikipedia.org/wiki/Exponential_function |
|---|
| [R19] | M. Abramovitz and I. A. Stegun, “Handbook of Mathematical Functions with Formulas, Graphs, and Mathematical Tables,” Dover, 1964, p. 69,http://www.math.sfu.ca/~cbm/aands/page_69.htm |
|---|
Examples
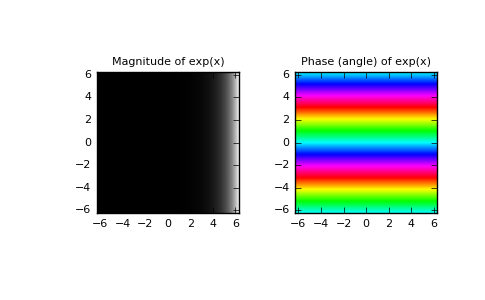
Plot the magnitude and phase of exp(x) in the complex plane:
import matplotlib.pyplot as plt
x = np.linspace(-2np.pi, 2np.pi, 100) xx = x + 1j * x[:, np.newaxis] # a + ib over complex plane out = np.exp(xx)
plt.subplot(121) plt.imshow(np.abs(out), ... extent=[-2np.pi, 2np.pi, -2np.pi, 2np.pi], cmap='gray') plt.title('Magnitude of exp(x)')
plt.subplot(122) plt.imshow(np.angle(out), ... extent=[-2np.pi, 2np.pi, -2np.pi, 2np.pi], cmap='hsv') plt.title('Phase (angle) of exp(x)') plt.show()
(Source code, png, pdf)