Ecological Functioning of the Seine River: From Long-Term Modelling Approaches to High-Frequency Data Analysis (original) (raw)
Keywords
1 Introduction
The concept of ecosystem functioning lies at the root of ecological sciences [1, 2]. It was at the origin of the International Biological Program, which coordinated large-scale ecological and environmental studies during the 1964–1974 period. Regarding aquatic ecosystems, the first research efforts were devoted to stagnant systems (lakes, sandpit lakes, reservoirs) where discharged point sources (domestic and industrial) were recognised as a major cause of water quality alteration through eutrophication and organic pollution. Many comprehensive studies started at that time, showing, based on long-term whole-ecosystem experiments, the strict control of primary production by phosphorus [[3](#ref-CR3 "Schindler DW (1974) Eutrophication and recovery in experimental lakes: implications for lake management. Science 184:897–899. https://doi.org/10.1126/science.184.4139.897
          "), [4](#ref-CR4 "Schindler DW (1998) Replication versus realism: the need for ecosystem-scale experiments. Ecosystems 1:323–334.
            https://doi.org/10.1007/s100219900026

          ")\], while silica (Si) depletion occurring with excess phosphorus (P) and/or nitrogen (N) limits the growth of siliceous algae such as diatoms, possibly leading to severe and undesirable ecosystem shifts \[[5](#ref-CR5 "Schelske CL, Stoermer EF (1971) Eutrophication, silica depletion, and predicted changes in algal quality in Lake Michigan. Science 173:423–424.
            https://doi.org/10.1126/science.173.3995.423

          ")\].
Among the four-dimensional nature of lotic ecosystems [6], the longitudinal upstream–downstream dimension was the leading factor, inspired by the River Continuum Concept (RCC) describing the longitudinal auto- vs. heterotrophic metabolism pattern [[7](#ref-CR7 "Vannote RL, Minshall GW, Cummins KW et al (1980) The river continuum concept. Can J Fish Aquat Sci 37:130–137. https://doi.org/10.1139/f80-017
")\]. A river system can be considered as a network of connected river stretches of different stream orders \[[8](#ref-CR8 "Strahler AN (1957) Quantitative analysis of watershed geomorphology. Geophys Union Trans 38:913–920")\], each characterised by a common scheme of ecological and biogeochemical processes, whose intensities depend on local hydro-morphological features and on inputs received from the upstream network and the watershed. The metabolism in each of the network’s ecosystems is therefore dependent on its position in the network (its stream order for river stretches), and all ecosystems are collectively influenced by the water runoff flowing through the system as well as by the point and diffuse sources of nutrients originating from the watershed. At the outlet of the system, water and nutrients are exported to marine coastal zones, the functioning of which can be strongly influenced by these inputs.Taking into account the role of connected stagnant ecosystems [9,10,[11](#ref-CR11 "Passy P, Garnier J, Billen G et al (2012) Restoration of ponds in rural landscapes: modelling the effect on nitrate contamination of surface water (the Seine River Basin, France). Sci Total Environ 430:280–290. https://doi.org/10.1016/j.scitotenv.2012.04.035
          ")\], as well as denitrification in riparian zones \[[12](#ref-CR12 "Billen G, Ramarson A, Thieu V et al (2018) Nitrate retention at the river–watershed interface: a new conceptual modeling approach. Biogeochemistry 139:31–51.
            https://doi.org/10.1007/s10533-018-0455-9

          "), [13](#ref-CR13 "Flipo N, Even S, Poulin M et al (2007) Modelling nitrate fluxes at the catchment scale using the integrated tool CaWaQS. Sci Total Environ 375:69–79.
            https://doi.org/10.1016/j.scitotenv.2006.12.016

          ")\], allows the investigation of the lateral dimension in the sense of water interactions with drained terrestrial parts of a watershed \[[6](#ref-CR6 "Ward JV (1989) The four-dimensional nature of lotic ecosystems. J N Am Benthol Soc 8:2–8")\]. Whereas \[[14](#ref-CR14 "Flipo N, Jeannée N, Poulin M et al (2007) Assessment of nitrate pollution in the Grand Morin aquifers (France): combined use of geostatistics and physically-based modeling. Environ Pollut 146:241–256.
            https://doi.org/10.1016/j.envpol.2006.03.056

          "),[15](#ref-CR15 "Flipo N, Rabouille C, Poulin M et al (2007) Primary production in headwater streams of the Seine basin: the Grand Morin case study. Sci Total Environ 375:98–109.
            https://doi.org/10.1016/j.scitotenv.2006.12.015

          "),[16](#ref-CR16 "Newcomer ME, Hubbard SS, Fleckenstein JH et al (2016) Simulating bioclogging effects on dynamic riverbed permeability and infiltration. Water Resour Res 52:2883–2900.
            https://doi.org/10.1002/2015WR018351

          "),[17](#ref-CR17 "Newcomer ME, Hubbard SS, Fleckenstein JH et al (2018) Influence of hydrological perturbations and riverbed sediment characteristics on hyporheic zone respiration of CO2 and N2. J Geophys Res Biogeosci 123:902–922.
            https://doi.org/10.1002/2017JG004090

          ")\] investigated the vertical dimension, i.e. water and nutrient exchanges between aquifers and surface water \[[18](#ref-CR18 "Billen G, Garnier J, Le Noë J et al (2020) The Seine watershed water-agro-food system: long-term trajectories of C, N, P metabolism. In: Flipo N, Labadie P, Lestel L (eds) The Seine River basin. Handbook of environmental chemistry. Springer, Cham.
            https://doi.org/10.1007/698_2019_393

          "), [19](#ref-CR19 "Flipo N, Gallois N, Labarthe B et al (2020) Pluri-annual water budget on the Seine basin: past, current and future trends. In: Flipo N, Labadie P, Lestel L (eds) The Seine River basin. Handbook of environmental chemistry. Springer, Cham.
            https://doi.org/10.1007/698_2019_392

          ")\] in the context of a multi-scale view of stream–aquifer interfaces \[[20](#ref-CR20 "Flipo N, Mouhri A, Labarthe B et al (2014) Continental hydrosystem modelling: the concept of nested stream-aquifer interfaces. Hydrol Earth Syst Sci 18:3121–3149.
            https://doi.org/10.5194/hess-18-3121-2014

          ")\], the fourth dimension, which provides the time scale, has long been a major concern of the PIREN-Seine program, both in terms of past and future scenario analysis \[[21](#ref-CR21 "Billen G, Garnier J (1997) The Phison River plume: coastal eutrophication in response to changes in land use and water management in the watershed. Aquat Microb Ecol 13:3–17.
            https://doi.org/10.3354/ame013003

          "), [22](#ref-CR22 "Billen G, Garnier J, Ficht A, Cun C (2001) Modeling the response of water quality in the Seine River estuary to human activity in its watershed over the last 50 years. Estuaries 24:977–993")\].
The Seine River system is a textbook example illustrating this overall vision. It drains one of the most intensive agricultural areas in the world, as well as one of the largest European metropolises. The population is mostly concentrated along the main downstream stretch (seventh order), 150 km upstream from the beginning of the estuarine zone. Water quality problems related to urban organic pollution and eutrophication were very acute at the beginning of the PIREN-Seine program and have been largely repaired over the last few decades.
In this chapter we first provide a short summary of the methodologies used in our studies of the Seine River metabolism, based on a combination of field measurements and modelling approaches. We then describe the long-term changes in organic matter and nutrient contamination of the system, followed by a discussion on the metabolism of river ecosystems in terms of auto- and heterotrophy as well as gas production. Finally, a prospective view of the river functioning concludes the chapter.
2 A Modelling Approach for a Comprehensive Understanding of the Ecological Functioning of the Seine River
The Riverstrahler model, first developed in the 1990s [23, 24], is still one of the few tools available to model nutrient cycling and ecological functioning at the scale of an entire drainage network based on the network’s morphological characteristics (e.g. length and depth of the rivers), the hydro-meteorological conditions and the human activities in the watershed (point and diffuse pollution sources related to domestic and agricultural water usages). It combines a generic model that mimics ecological and biogeochemical processes (RIVE) with a water flow routing scheme through the drainage network partly based on its Strahler ordination [8] (Fig. 1a).
Fig. 1
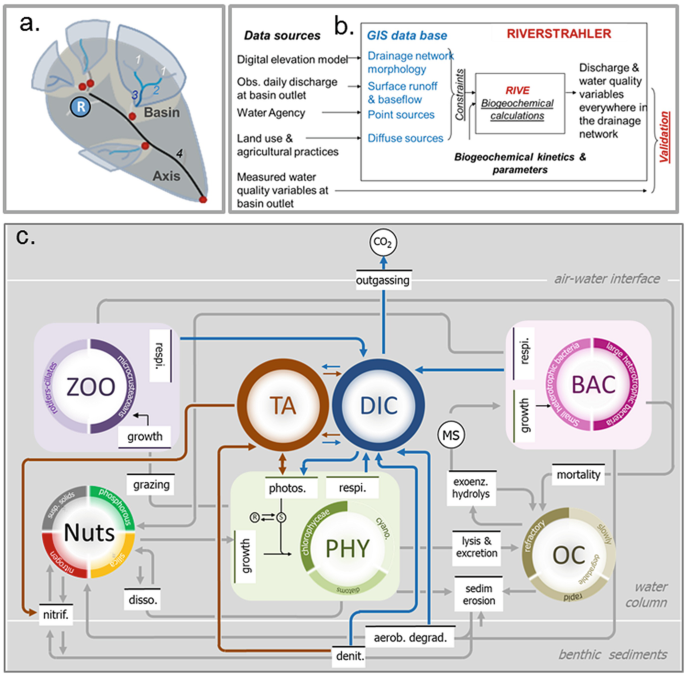

Principles of the Riverstrahler model. (a) Representation of the river objects in Riverstrahler (basin; A axis, R reservoirs and ponds) following Strahler ordination [23]. (b) Conceptual framework of the Riverstrahler model implementation. (c) Schematic representation of RIVE processes (nitrification (nitrif), dissolution (disso), denitrification (denit), grazing, respiration (respi.), mortality, lysis and excretion, sedimentation (sedim) and erosion, aerobic degradation (aerob. degrad), outgassing and different variables (zooplankton (ZOO), phytoplankton (PHY), bacteria (BAC), nutrients (Nuts), organic carbon (OC), total alkalinity (TA) and dissolved inorganic carbon (DIC))
Starting from a conceptualisation with one community of phytoplankton taking up only N and P, and one bacterial community degrading organic matter, the RIVE model (www.fire.upmc.fr/rive) has gradually evolved over the last 30 years (Fig. 1b). Among the significant developments, the introduction of diatoms and silica uptake allowed us to specifically examine river primary production and oxygen production since diatoms are the dominant species in rivers, specifically in the Seine River [24]. Besides building up an organic stock mineralised by bacteria, phytoplankton is grazed by microzooplankton, which is also represented in the model [9]. Nitrifying bacteria and nitrification were additionally introduced for a realistic simulation of ammonium dynamics, a typical element of point sources [25,[26](#ref-CR26 "Brion N, Billen G, Guézennec L, Ficht A (2000) Distribution of nitrifying activity in the Seine River (France) from Paris to the estuary. Estuar Coasts 23:669–682. https://doi.org/10.2307/1352893
          "),[27](#ref-CR27 "Raimonet M, Vilmin L, Flipo N et al (2015) Modelling the fate of nitrite in an urbanized river using experimentally obtained nitrifier growth parameters. Water Res 73:373–387.
            https://doi.org/10.1016/j.watres.2015.01.026

          ")\], taking into account N2O as an intermediate of nitrification \[[28](#ref-CR28 "Garnier J, Billen G, Cébron A (2007) Modelling nitrogen transformations in the lower Seine river and estuary (France): impact of wastewater release on oxygenation and N2O emission. Hydrobiologia 588:291–302.
            https://doi.org/10.1007/s10750-007-0670-1

          ")\]. Phosphorus, coming from both point and diffuse sources, was specifically studied for a parametrisation of its adsorption–desorption dynamics \[[29](#ref-CR29 "Aissa-Grouz N, Garnier J, Billen G et al (2015) The response of river nitrification to changes in wastewater treatment (The case of the lower Seine River downstream from Paris). Ann Limnol Int J Limnol 51:351–364.
            https://doi.org/10.1051/limn/2015031

          "),[30](#ref-CR30 "Némery J, Garnier J (2007) Origin and fate of phosphorus in the Seine watershed (France): agricultural and hydrographic P budgets. J Geophys Res 112:1–14.
            https://doi.org/10.1029/2006JG000331

          "),[31](#ref-CR31 "Vilmin L, Aissa-Grouz N, Garnier J et al (2015) Impact of hydro-sedimentary processes on the dynamics of soluble reactive phosphorus in the Seine River. Biogeochemistry 122:229–251.
            https://doi.org/10.1007/s10533-014-0038-3

          ")\]. The model also includes a calculation of nutrient exchanges across the sediment–water interface as a result of a given sedimentation flux of organic material, taking into account organic matter degradation, oxygen consumption and N, P and Si processes, mixing in the interstitial and solid phases and accretion of the sedimentary column by inorganic matter sedimentation \[[15](#ref-CR15 "Flipo N, Rabouille C, Poulin M et al (2007) Primary production in headwater streams of the Seine basin: the Grand Morin case study. Sci Total Environ 375:98–109.
            https://doi.org/10.1016/j.scitotenv.2006.12.015

          "), [32](#ref-CR32 "Flipo N, Even S, Poulin M et al (2004) Biogeochemical modelling at the river scale: plankton and Periphyton dynamics - Grand Morin case study, France. Ecol Model 176:333–347"), [33](#ref-CR33 "Thouvenot-Korppoo M, Billen G, Garnier J (2009) Modelling benthic denitrification processes over a whole drainage network. J Hydrol 379:239–250.
            https://doi.org/10.1016/j.jhydrol.2009.10.005

          ")\] (Fig. [1c](#Fig1)).
Recent developments concern the introduction of inorganic forms of carbon and greenhouse gas emissions (carbon dioxide, CO2 [[34](#ref-CR34 "Marescaux A, Thieu V, Borges AV, Garnier J (2018) Seasonal and spatial variability of the partial pressure of carbon dioxide in the human-impacted Seine River in France. Sci Rep 8:13961. https://doi.org/10.1038/s41598-018-32332-2
")\]; methane, CH4; nitrous oxide, N2O). The current version of RIVE comprises 30 state variables.The RIVE model applied to the whole upstream–downstream network with the same parameters implies the recognition of the unicity of the kinetics formalisation of ecological processes, whatever the location in the network, a strong assumption that has proved realistic, not only along a land-to-sea continuum in a gradient of watershed sizes (the Seine River [23]; the Danube River [35]) but also in stagnant systems [9, 10] and in a variety of regions (sub-tropical [[36](#ref-CR36 "Le TPQ, Billen G, Garnier J, Chau VM (2014) Long-term biogeochemical functioning of the Red River (Vietnam): past and present situations. Reg Environ Chang 15:329–339. https://doi.org/10.1007/s10113-014-0646-4
          ")\]; subarctic \[[37](#ref-CR37 "Sferratore A, Garnier J, Billen G et al (2006) Diffuse and point sources of silica in the Seine River watershed. Environ Sci Technol 40:6630–6635.
            https://doi.org/10.1021/es060710q

          ")\]). The RIVE model also performs fairly well in the case of transitory events such as combined sewer overflows \[[38](#ref-CR38 "Even S, Poulin M, Mouchel J-M et al (2004) Modelling oxygen deficits in the Seine River downstream of combined sewer overflows. Ecol Model 173:177–196"), [39](#ref-CR39 "Even S, Mouchel J-M, Servais P et al (2007) Modeling the impacts of combined sewer overflows on the river Seine water quality. Sci Total Environ 375:140–151.
            https://doi.org/10.1016/j.scitotenv.2006.12.007

          ")\]. For the study of urban systems, it is implemented in the ProSe model \[[32](#ref-CR32 "Flipo N, Even S, Poulin M et al (2004) Biogeochemical modelling at the river scale: plankton and Periphyton dynamics - Grand Morin case study, France. Ecol Model 176:333–347"), [38](#ref-CR38 "Even S, Poulin M, Mouchel J-M et al (2004) Modelling oxygen deficits in the Seine River downstream of combined sewer overflows. Ecol Model 173:177–196"), [40](#ref-CR40 "Even S, Poulin M, Garnier J et al (1998) River ecosystem modelling: application of the ProSe model to the Seine river (France). Hydrobiologia 373:27–37")\], which was used to study the plurennial impact of transient events on the carbon and oxygen cycles \[[41](#ref-CR41 "Vilmin L, Flipo N, Escoffier N et al (2016) Carbon fate in a large temperate human-impacted river system: focus on benthic dynamics. Glob Biogeochem Cycles 30:1086–1104.
            https://doi.org/10.1002/2015GB005271

          "), [42](#ref-CR42 "Vilmin L, Flipo N, Escoffier N, Groleau A (2018) Estimation of the water quality of a large urbanized river as defined by the European WFD: what is the optimal sampling frequency? Environ Sci Pollut Res 25:23485–23501.
            https://doi.org/10.1007/s11356-016-7109-z

          ")\], as well as nutrients \[[27](#ref-CR27 "Raimonet M, Vilmin L, Flipo N et al (2015) Modelling the fate of nitrite in an urbanized river using experimentally obtained nitrifier growth parameters. Water Res 73:373–387.
            https://doi.org/10.1016/j.watres.2015.01.026

          "), [31](#ref-CR31 "Vilmin L, Aissa-Grouz N, Garnier J et al (2015) Impact of hydro-sedimentary processes on the dynamics of soluble reactive phosphorus in the Seine River. Biogeochemistry 122:229–251.
            https://doi.org/10.1007/s10533-014-0038-3

          "), [43](#ref-CR43 "Polus E, Flipo N, de Fouquet C, Poulin M (2011) Geostatistics for assessing the efficiency of distributed physically-based water quality model. Application to nitrates in the Seine River. Hydrol Process 25:217–233.
            https://doi.org/10.1002/hyp.7838

          ")\]. The implementation of RIVE in the ProSe model simulates sediment processes properly \[[20](#ref-CR20 "Flipo N, Mouhri A, Labarthe B et al (2014) Continental hydrosystem modelling: the concept of nested stream-aquifer interfaces. Hydrol Earth Syst Sci 18:3121–3149.
            https://doi.org/10.5194/hess-18-3121-2014

          "), [44](#ref-CR44 "Vilmin L, Flipo N, De Fouquet C, Poulin M (2015) Pluri-annual sediment budget in a navigated river system: The Seine River (France). Sci Total Environ 502:48–59.
            https://doi.org/10.1016/j.scitotenv.2014.08.110

          ")\] as well as periphyton scouring \[[32](#ref-CR32 "Flipo N, Even S, Poulin M et al (2004) Biogeochemical modelling at the river scale: plankton and Periphyton dynamics - Grand Morin case study, France. Ecol Model 176:333–347")\], which are both key processes for a proper estimation of water quality \[[41](#ref-CR41 "Vilmin L, Flipo N, Escoffier N et al (2016) Carbon fate in a large temperate human-impacted river system: focus on benthic dynamics. Glob Biogeochem Cycles 30:1086–1104.
            https://doi.org/10.1002/2015GB005271

          "), [42](#ref-CR42 "Vilmin L, Flipo N, Escoffier N, Groleau A (2018) Estimation of the water quality of a large urbanized river as defined by the European WFD: what is the optimal sampling frequency? Environ Sci Pollut Res 25:23485–23501.
            https://doi.org/10.1007/s11356-016-7109-z

          ")\].
The Riverstrahler model requires a detailed description of the hydrographic network for which elementary basins (EBs), defined as portions of the watershed drained by a segment of river between two confluences or between a spring and the first confluence, are characterised by their slope, width and length and their position within the upstream–downstream scheme of river confluences, i.e. their stream order [8]. This structure of the Seine River’s drainage network was obtained from the IGN database (CarTHAgE®) and from an elevation model (50 m, http://professionnels.ign.fr/bdalti). According to the required resolution of the application, the Riverstrahler model runs on an ensemble of connected objects, either basins, grouping EBs according to an idealised scheme of confluence of tributaries with average characteristics by stream order, or branches, with a detailed and exhaustive representation of the morphology at 1 km spatial resolution. Reservoirs and ponds are also taken into account with a description of their morphology (depth and surface area) and hydrology (water inflow and outflow).
Hydrological inputs are provided by the HYDRO database (http://www.hydro.eaufrance.fr), averaged at a daily time step and separated into surface runoff and baseflow, using Eckhardt’s recursive filter [45]. Surface runoff and baseflow are generated using observed discharge time series at, e.g. 50–100 gauging stations for simulation periods ranging from 1 year [23, 46] to yearly contrasted hydrological conditions [47, [48](#ref-CR48 "Thieu V, Billen G, Garnier J (2009) Nutrient transfer in three contrasting NW European watersheds: the Seine, Somme, and Scheldt Rivers. A comparative application of the Seneque/Riverstrahler model. Water Res 43:1740–1754. https://doi.org/10.1016/j.watres.2009.01.014
          ")\] or plurennial time-windows \[[22](#ref-CR22 "Billen G, Garnier J, Ficht A, Cun C (2001) Modeling the response of water quality in the Seine River estuary to human activity in its watershed over the last 50 years. Estuaries 24:977–993"), [49](#ref-CR49 "Billen G, Garnier J, Némery J et al (2007) A long-term view of nutrient transfers through the Seine River continuum. Sci Total Environ 375:80–97.
            https://doi.org/10.1016/j.scitotenv.2006.12.005

          "), [50](#ref-CR50 "Passy P, Gypens N, Billen G et al (2013) A model reconstruction of riverine nutrient fluxes and eutrophication in the Belgian Coastal Zone since 1984. J Mar Syst 128:106–122")\].
The Seine basin comprises about 1900 wastewater treatment plants, each being georeferenced and characterised by the connected population and the type of treatment applied [[51](#ref-CR51 "Flipo N, Lestel L, Labadie P et al (2020) Trajectories of the Seine River basin. In: Flipo N, Labadie P, Lestel L (eds) The Seine River basin. Handbook of environmental chemistry. Springer, Cham. https://doi.org/10.1007/698_2019_437
          ")\]. These data are provided by the Seine–Normandy database and are transformed into variables compatible with the model (nutrients and carbon under their specific forms \[[37](#ref-CR37 "Sferratore A, Garnier J, Billen G et al (2006) Diffuse and point sources of silica in the Seine River watershed. Environ Sci Technol 40:6630–6635.
            https://doi.org/10.1021/es060710q

          "), [52](#ref-CR52 "Garnier J, Laroche L, Pinault S (2006) Determining the domestic specific loads of two wastewater plants of the Paris conurbation (France) with contrasted treatments: a step for exploring the effects of the application of the European directive. Water Res 40:3257–3266.
            https://doi.org/10.1016/j.watres.2006.06.023

          "), [53](#ref-CR53 "Servais P, Garnier J, Demarteau N et al (1999) Supply of organic matter and bacteria to aquatic ecosystems through waste water effluents. Water Res 33:3521–3531")\]).
Diffuse sources enter the river through surface runoff and the baseflow. Mean annual nutrients and carbon concentrations are associated with each component of the water: N (nitrate, ammonium), P (total inorganic phosphorus, TIP), Si (dissolved and biogenic), suspended solids and organic and inorganic carbon. These concentrations differ according to major land use classes (cropland, permanent grassland, forests, urbanised areas) and lithological features, which are spatially determined using the Corine Land Cover database [54] and lithological information [[51](#ref-CR51 "Flipo N, Lestel L, Labadie P et al (2020) Trajectories of the Seine River basin. In: Flipo N, Labadie P, Lestel L (eds) The Seine River basin. Handbook of environmental chemistry. Springer, Cham. https://doi.org/10.1007/698_2019_437
          ")\]. For nitrate, two approaches are available. The GRAFS approach \[[55](#ref-CR55 "Billen G, Lassaletta L, Garnier J (2014) A biogeochemical view of the global agro-food system: nitrogen flows associated with protein production, consumption and trade. Glob Food Sec 3:209–219.
            https://doi.org/10.1016/j.gfs.2014.08.003

          "), [56](#ref-CR56 "Le Noë J, Billen G, Garnier J (2017) How the structure of agro-food systems shapes nitrogen, phosphorus, and carbon fluxes: the generalized representation of agro-food system applied at the regional scale in France. Sci Total Environ 586:42–55.
            https://doi.org/10.1016/j.scitotenv.2017.02.040

          ")\] calculates leaching fluxes and concentrations \[[57](#ref-CR57 "Anglade J, Billen G, Garnier J et al (2015) Nitrogen soil surface balance of organic vs conventional cash crop farming in the Seine watershed. Agric Syst 139:82–92.
            https://doi.org/10.1016/j.agsy.2015.06.006

          ")\], for both surface runoff and baseflow, for each land use class, on the basis of regional agricultural statistics at the _département_ level. The other approach mobilises complex physically based models: the STICS agronomic model and the MODCOU hydrogeological model \[[18](#ref-CR18 "Billen G, Garnier J, Le Noë J et al (2020) The Seine watershed water-agro-food system: long-term trajectories of C, N, P metabolism. In: Flipo N, Labadie P, Lestel L (eds) The Seine River basin. Handbook of environmental chemistry. Springer, Cham.
            https://doi.org/10.1007/698_2019_393

          "), [58](#ref-CR58 "Ledoux E, Gomez E, Monget JM et al (2007) Agriculture and groundwater nitrate contamination in the Seine basin. The STICS-MODCOU modelling chain. Sci Total Environ 375:33–47")\]. Inorganic carbon was recently added to the modelling approach \[[34](#ref-CR34 "Marescaux A, Thieu V, Borges AV, Garnier J (2018) Seasonal and spatial variability of the partial pressure of carbon dioxide in the human-impacted Seine River in France. Sci Rep 8:13961.
            https://doi.org/10.1038/s41598-018-32332-2

          "), [59](#ref-CR59 "Marescaux A, Thieu V, Garnier J (2018) Carbon dioxide, methane and nitrous oxide emissions from the human-impacted Seine watershed in France. Sci Total Environ 643:247–259.
            https://doi.org/10.1016/j.scitotenv.2018.06.151

          ")\], the aquifer’s lithology being a major controlling factor.
The Riverstrahler model calculates seasonal variations of water quality and ecological functioning for any tributary of the river system given point source and diffuse source forcings.
3 Long-Term Trends in Water Quality
3.1 Changes in Organic Pollution from Urban Point Sources
From about 11 million inhabitants in 1955, the population of the Seine basin had increased to 16 million in 2018 [[51](#ref-CR51 "Flipo N, Lestel L, Labadie P et al (2020) Trajectories of the Seine River basin. In: Flipo N, Labadie P, Lestel L (eds) The Seine River basin. Handbook of environmental chemistry. Springer, Cham. https://doi.org/10.1007/698_2019_437
")\], with an uneven geographical distribution, with 75% concentrated in the Paris metropolis and along the main Seine branch from Paris to the estuary.The history of domestic Paris wastewater management since the beginning of the twentieth century, marked by technical choices for sewage management (Fig. 2), is that of a race between increasing wastewater production and treatment capacity. Farmland application, the destination of nearly all the collected sewage in 1900, was rapidly insufficient to absorb the volumes produced. At the end of the 1960s, around 60% of the wastewater collected was discharged into the river without any treatment, leading to oxygen depletion and fish mortality (the species richness was reduced to only three species in 1970 [60]). The first biological wastewater treatment plant was impounded in 1940 in Achères, 70 km downstream of the Paris city centre. Sanitation centralisation started with the construction of large wastewater collectors from 1954 to 1972. In 1970, most raw waters reached the Seine River through large spillways in Clichy, 30 km downstream of Paris. Changes in sanitation strategy were implemented in three steps [60]:
- Development of the largest European WWTP in Achères (nowadays called Seine Aval, SAV) from 1940 until the 1980s
- Construction of new WWTPs to increase treatment capacities until the 1990s
- Since then, deployment of new processes of wastewater treatment for achieving complete removal not only of carbon but also of nitrogen and phosphorus
Fig. 2
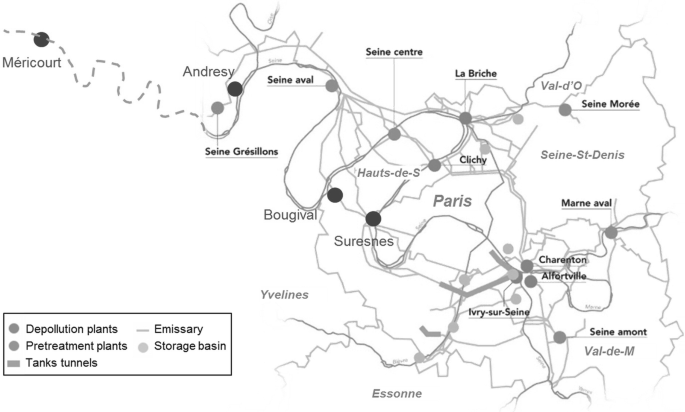

Map of the Parisian conurbation indicating the WWTPs (blue circles and names in black, Seine Aval [SAV] previously Achères), the pretreatment plants (purple) and the storage tunnels/basins (orange and green), as provided by SIAAP. The four high-frequency O2 monitoring stations are also indicated (red). Paris and conurbation départements (grey)
All these improvements favoured the recolonisation of the aquatic environment by fish populations: today 32 fish species are found in the Seine River stretch crossing Paris and its conurbation [[61](#ref-CR61 "Azimi S, Rocher V (2016) Influence of the water quality improvement on fish population in the Seine River (Paris, France) over the 1990-2013 period. Sci Total Environ 542:955–964. https://doi.org/10.1016/j.scitotenv.2015.10.094
")\].Data on wastewater volumes in the Paris agglomeration show the increase of the amount of water collected and treated in WWTPs before discharge into the river system (Fig. 3a). The volume treated represents the polluting wastewater volume and can be expressed in biological oxygen demand (BOD5d) (Fig. 3b).
Fig. 3
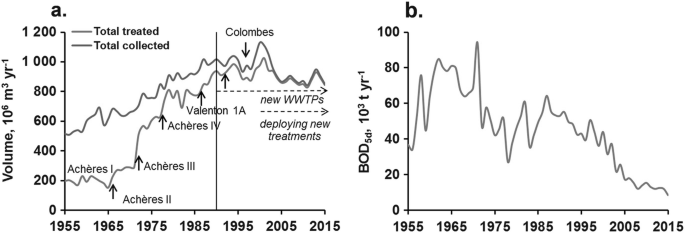

Long-term trajectories 1955–2015: (a) of collected and treated volumes in the SIAAP stations of the Paris conurbation, (b) of BOD load for the volume treated (source; SIAAP). NB the decrease in collected wastewater (after 2005 in (a)) stems from a decrease in domestic water use
Even though almost 100% of the wastewater collected is currently treated, the combined sewer system still discharges significant amounts of raw water into the river system during large rainfall events. Such short-term events typically last 1–20 h (90% in less than 10 h) and can lead to fast, temporary decreases in oxygen concentrations in the receiving river of up to ~2 mgO2 L−1 at low flow [62].
ProSe has simulated the effect of these successive changes in the sewage system since the 1970s on oxygen fluxes in the main branch of the Seine River downstream of Paris during low-flow conditions (Table 1). Metabolism (production and respiration; see Sect. 3 for further detail) is calculated in terms of oxygen budgets for the 1970s, 1980s and 2012 and for a prospective scenario that considers the full treatment and the smooth release over time of combined sewer overflows (CSOs). Emissions for the 1970s and 1980s were characterised based on average water discharges and concentrations of sediments, ammonium and BOD monitored by the SIAAP in 1969–1971 and 1979–1981, respectively. These data are available for major WWTP effluents of the Paris conurbation and in the largest spillways for untreated wastewater, located in Clichy and Achères (Fig. 2).
Table 1 Oxygen budgets simulated with the ProSe model for 2012 low-flow conditions (30 consecutive driest days), with typical wastewater emissions from the 1970s and 1980s, real emissions from 2012 and a scenario with full treatment of all collected waters
For low-flow conditions, outside of algae bloom periods, changes in the conurbation’s sewage management have had little effect on primary production but clear impacts on ecosystem respiration (Table 1). In the 1970s, the Seine River system was highly heterotrophic upstream of the SAV WWTP, due to the release of large volumes of organic matter in Clichy. In 1980, ~95% of the wastewater was piped towards Achères, out of which almost 90% was treated before emission. This significantly helped improve oxygen conditions upstream of the WWTP, reducing net oxygen consumption by almost one order of magnitude. However, heterotrophic respiration downstream increased by 50%. The continuous improvements in treatment capacity and technology since the 1990s have significantly improved oxygen conditions along the entire river stretch. Simulations further show that increasing treatment capacity to totally prevent combined sewer overflows during rain events would reduce the total ecosystem respiration upstream of SAV, where most of the large overflows occur, and would possibly lead to slightly autotrophic conditions downstream of SAV.
The rest of the Seine basin experienced a similar evolution of wastewater management, although delayed by several decades. Nowadays, the Seine basin comprises about 1900 WWTPs [[51](#ref-CR51 "Flipo N, Lestel L, Labadie P et al (2020) Trajectories of the Seine River basin. In: Flipo N, Labadie P, Lestel L (eds) The Seine River basin. Handbook of environmental chemistry. Springer, Cham. https://doi.org/10.1007/698_2019_437
")\] with rather efficient organic matter and phosphorus treatments. The largest of them (>10,000 inhab equivalent) are equipped with N treatment units.Oxygen and ammonium longitudinal profiles are determined based on 50-year data series available along the lower Seine River, historically impacted by the city of Paris (Fig. 4). The profiles shown in Fig. 4 stand for rather low water situations (150–280 m3 s−1) currently observed from mid-spring to mid-autumn, with low dilution capacity of point source pollution that actively metabolised by microorganisms. In the 1970s, two areas were subject to oxygen deficits, one immediately downstream of the Paris conurbation (50–100 km) and the other 200 km downstream, at the entrance of the fluvial estuary.
Fig. 4
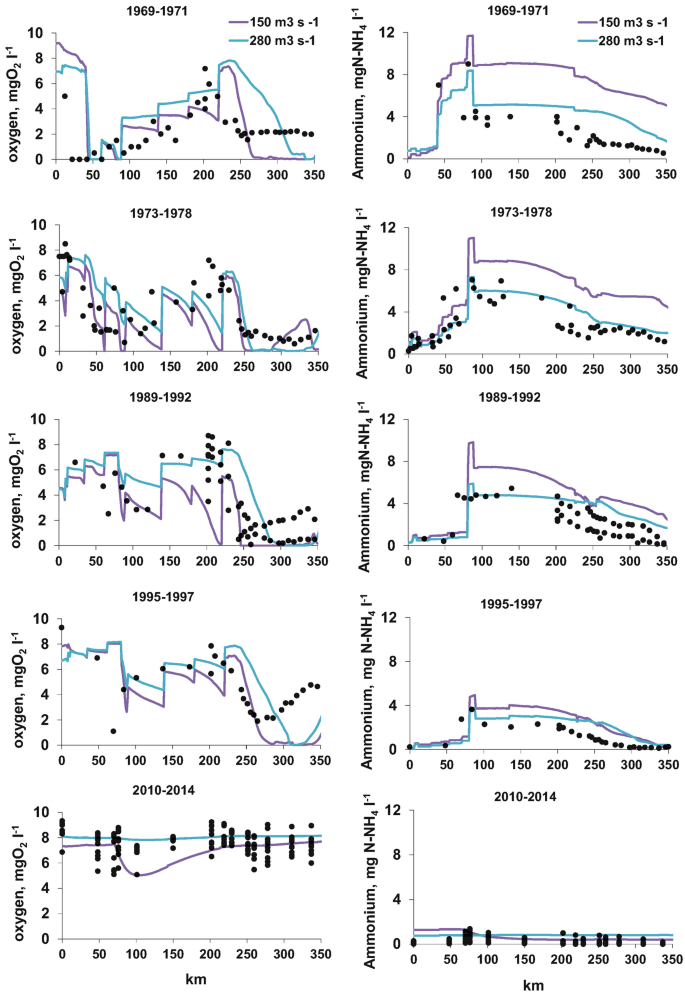

Longitudinal profiles of oxygen (left) and ammonium (right) concentrations along the lower Seine River (0 km at Paris). Black dots are observations; coloured lines are simulations by the Riverstrahler model for two levels of water flow. Time periods are shown from top to bottom (from the oldest to the most recent)
The Riverstrahler modelling approach is able to reproduce the major trends observed. It indicates that the first oxygen deficits were linked to the heterotrophic degradation of the organic load discharged by the SAV WWTP, while the second was caused by the autotrophic nitrification of the ammonium load discharged at the same location but oxidised after a 150 km transit, which corresponds to the time required by the nitrifying bacteria to build up a large enough population [25, [26](#ref-CR26 "Brion N, Billen G, Guézennec L, Ficht A (2000) Distribution of nitrifying activity in the Seine River (France) from Paris to the estuary. Estuar Coasts 23:669–682. https://doi.org/10.2307/1352893
          "), [28](#ref-CR28 "Garnier J, Billen G, Cébron A (2007) Modelling nitrogen transformations in the lower Seine river and estuary (France): impact of wastewater release on oxygenation and N2O emission. Hydrobiologia 588:291–302.
            https://doi.org/10.1007/s10750-007-0670-1

          ")\].
At this time discharged ammonium led to concentrations up to 8–10 mg N-NH4 L−1 downstream of SAV, decreasing to 2 mg N-NH4 L−1 in the estuary (Fig. 4). Oxygen depletion immediately downstream of Paris occurred until the early 1990s, when the proportion of treated effluent increased (Fig. 3a). Oxygen depletion farther in the estuary was only interrupted by the implementation of a nitrification treatment in the SAV WWTP in 2007. All these efforts had a very positive effect on the oxygenation of the river, which today can boast a good ecological status with respect to oxygen concentrations [62].
Exactly as simulated in Garnier et al. [[28](#ref-CR28 "Garnier J, Billen G, Cébron A (2007) Modelling nitrogen transformations in the lower Seine river and estuary (France): impact of wastewater release on oxygenation and N2O emission. Hydrobiologia 588:291–302. https://doi.org/10.1007/s10750-007-0670-1
          ")\], nitrifying treatment, implemented in WWTPs since 2007, considerably lowered the ammonium discharged in the river (a tenfold decrease) \[[27](#ref-CR27 "Raimonet M, Vilmin L, Flipo N et al (2015) Modelling the fate of nitrite in an urbanized river using experimentally obtained nitrifier growth parameters. Water Res 73:373–387.
            https://doi.org/10.1016/j.watres.2015.01.026

          ")\] and favoured full reoxygenation of the estuary (Fig. [4](#Fig4)) \[[29](#ref-CR29 "Aissa-Grouz N, Garnier J, Billen G et al (2015) The response of river nitrification to changes in wastewater treatment (The case of the lower Seine River downstream from Paris). Ann Limnol Int J Limnol 51:351–364.
            https://doi.org/10.1051/limn/2015031

          ")\]. In addition, molecular methods show that ammonia-oxidising bacteria (AOB), (_Nitrosomonas oligotropha_ and _Nitrosomonas ureae-like bacteria_), introduced by the WWTP effluents, survived and actively participated in in-river NH4 oxidation far downstream of the WWTP outflow \[[27](#ref-CR27 "Raimonet M, Vilmin L, Flipo N et al (2015) Modelling the fate of nitrite in an urbanized river using experimentally obtained nitrifier growth parameters. Water Res 73:373–387.
            https://doi.org/10.1016/j.watres.2015.01.026

          "), [63](#ref-CR63 "Cébron A (2004) Nitrification, bactéries nitrifiantes et émission de N2O. Université Pierre et Marie Curie, Paris")\].
Although such changes in water treatment were mandatory [64, 65], the studies carried out as a part of the PIREN-Seine program have helped decision-makers over the past 30 years.
3.2 Long-Term Nutrient Contamination and Algal Growth
As seen above, improved water treatments reduced ammonium levels and increased oxygenation of the lower Seine River (Fig. 5). Although water treatments have also efficiently reduced phosphates since the mid-1990s, phytoplankton blooms (>100 μg Chl_a_ L−1) still occurred until 2005, causing nuisance for the drinking water production and producing, after bloom decline, large organic loadings, which contributed to oxygen depletion [[66](#ref-CR66 "Garnier J, Servais P, Billen G et al (2001) Lower Seine river and estuary (France) carbon and oxygen budgets during low flow. Estuaries 24:964–976. https://doi.org/10.2307/1353010
")\].Fig. 5
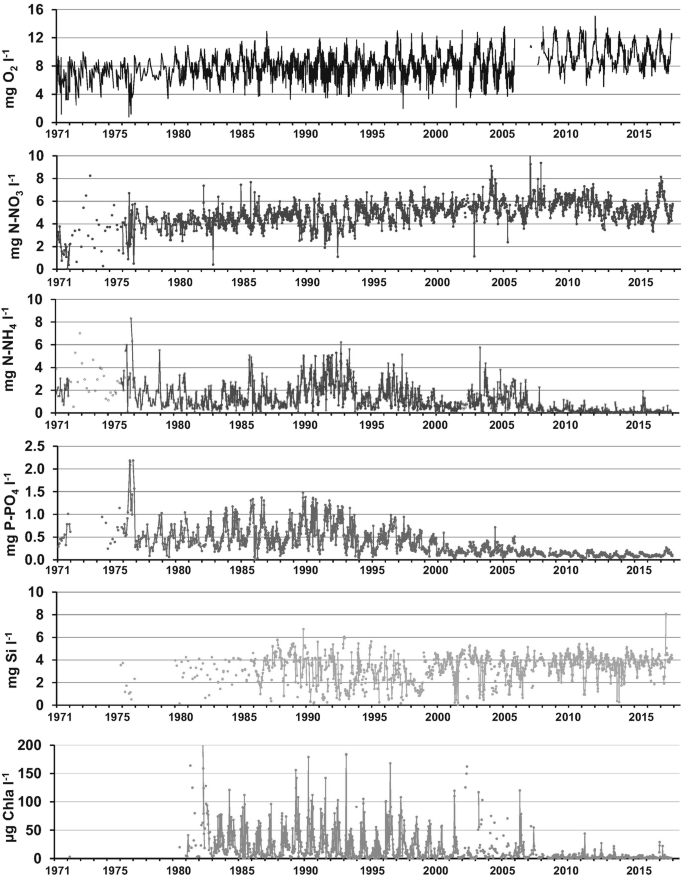

Long-term variations in observed concentrations of water quality (1971–2017) at the outlet of the Seine basin (Poses): oxygen, nitrate, ammonium, phosphates, dissolved silica, phytoplankton biomass (in chlorophyll a, Chl_a_)
A reduction of phosphorus load by a factor 10, reached only after 2005, has been necessary to significantly decrease algal growth and avoid eutrophication. Nowadays, algal blooms as high as observed 20 years ago have disappeared. Despite these spectacular improvements, the Seine River remains fragile. For example, low summer water curtails the dilution of point source pollutions, increasing nutrient concentrations above growth limitation levels. Additionally, malfunctioning of WWTPs for maintenance purposes occasionally occurs, possibly accentuating temporary degradation of water quality [[29](#ref-CR29 "Aissa-Grouz N, Garnier J, Billen G et al (2015) The response of river nitrification to changes in wastewater treatment (The case of the lower Seine River downstream from Paris). Ann Limnol Int J Limnol 51:351–364. https://doi.org/10.1051/limn/2015031
")\].While point source reductions led to a significant reduction of ammonium and phosphate pollution, nitrate from diffuse agricultural sources steadily increased from an average of winter month concentrations of about 3 mgN-NO3 L−1 in 1971 to 6.3 mgN-NO3 L−1 in 2011, i.e. more than 3 mgN-NO3 L−1 over 40 years. The recent trend is towards stabilisation, and even a decrease in the recent years, although NO3 concentrations peaked again at 8 mgN-NO3 L−1 during the mild and dry 2017 winter (Fig. 5).
Regarding silica, also diffuse but originating from the natural rock weathering process, its concentrations oscillated around 3.8 mg Si L−1 over the last 50 years. Distinct periods of Si depletion are observed corresponding to uptake by diatoms during blooms. In agreement with the observation of a strong reduction of blooms after 2007, these silica depletions have been much less pronounced in recent years than they were 20 years ago [24] (Fig. 5).
Suspended matter dynamics (not shown) did not change significantly over the period, except for a decrease during low flow, from 20 mg L−1 until the mid-2000s to less than 10 mg L−1 in recent years. This change might be due to the decrease in phytoplankton biomass and the implementation of grass strips for stream protection from erosion and pollution, rendered compulsory in 2005. River navigation is the main contributor for maintaining particles in suspension during low flow through a release of energy into the system [[44](#ref-CR44 "Vilmin L, Flipo N, De Fouquet C, Poulin M (2015) Pluri-annual sediment budget in a navigated river system: The Seine River (France). Sci Total Environ 502:48–59. https://doi.org/10.1016/j.scitotenv.2014.08.110
")\]. The evolution of fluvial traffic since the 2000s must therefore be taken into account to balance the effect of grass strip implementation.3.3 Modelling Nutrients and Phytoplankton Biomass
Long-term simulations with Riverstrahler match the observations (Fig. 6 for 1984–1990 [50] and 2007–2012 [[29](#ref-CR29 "Aissa-Grouz N, Garnier J, Billen G et al (2015) The response of river nitrification to changes in wastewater treatment (The case of the lower Seine River downstream from Paris). Ann Limnol Int J Limnol 51:351–364. https://doi.org/10.1051/limn/2015031
")\]). Once their formulations have been defined and parameters determined based on experimental field and lab studies, no further adjustment is carried out, and the comparison between simulations and observations constitutes a validation test for the model.Fig. 6
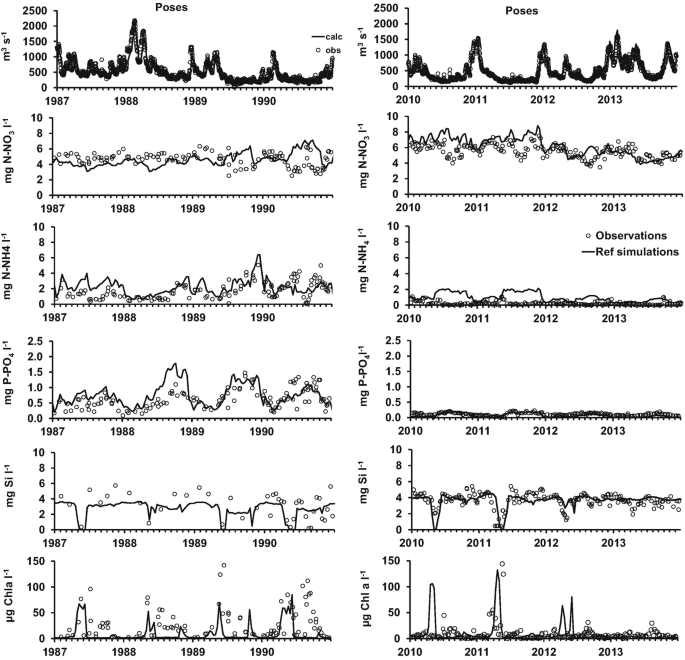

Riverstrahler simulations of water quality (1987–1990 and 2010–2013) at the outlet of the Seine basin (Poses). Simulations (lines) are compared to the observations (dots). From top to bottom: discharge, nitrate, ammonium, phosphates, dissolved silica and phytoplankton (in chlorophyll a concentrations)
Temporally refined simulations performed with the ProSe model across the Paris urban area over the 2007–2012 period also validate the formalisms of the RIVE model [[27](#ref-CR27 "Raimonet M, Vilmin L, Flipo N et al (2015) Modelling the fate of nitrite in an urbanized river using experimentally obtained nitrifier growth parameters. Water Res 73:373–387. https://doi.org/10.1016/j.watres.2015.01.026
          "), [41](#ref-CR41 "Vilmin L, Flipo N, Escoffier N et al (2016) Carbon fate in a large temperate human-impacted river system: focus on benthic dynamics. Glob Biogeochem Cycles 30:1086–1104.
            https://doi.org/10.1002/2015GB005271

          "), [42](#ref-CR42 "Vilmin L, Flipo N, Escoffier N, Groleau A (2018) Estimation of the water quality of a large urbanized river as defined by the European WFD: what is the optimal sampling frequency? Environ Sci Pollut Res 25:23485–23501.
            https://doi.org/10.1007/s11356-016-7109-z

          ")\], even at the second order with a geostatistical analysis \[[31](#ref-CR31 "Vilmin L, Aissa-Grouz N, Garnier J et al (2015) Impact of hydro-sedimentary processes on the dynamics of soluble reactive phosphorus in the Seine River. Biogeochemistry 122:229–251.
            https://doi.org/10.1007/s10533-014-0038-3

          "), [43](#ref-CR43 "Polus E, Flipo N, de Fouquet C, Poulin M (2011) Geostatistics for assessing the efficiency of distributed physically-based water quality model. Application to nitrates in the Seine River. Hydrol Process 25:217–233.
            https://doi.org/10.1002/hyp.7838

          "), [44](#ref-CR44 "Vilmin L, Flipo N, De Fouquet C, Poulin M (2015) Pluri-annual sediment budget in a navigated river system: The Seine River (France). Sci Total Environ 502:48–59.
            https://doi.org/10.1016/j.scitotenv.2014.08.110

          ")\]. Discrepancies between observations and simulations raise new scientific questions, either on an incomplete representation of processes in the model or on the accuracy of the forcing data (diffuse and point sources) or even on the quality of the observed data \[[43](#ref-CR43 "Polus E, Flipo N, de Fouquet C, Poulin M (2011) Geostatistics for assessing the efficiency of distributed physically-based water quality model. Application to nitrates in the Seine River. Hydrol Process 25:217–233.
            https://doi.org/10.1002/hyp.7838

          ")\].
4 River Metabolisms: Autotrophy, Heterotrophy and CO2 Saturation
The metabolism of any ecosystem is well characterised by the intensity of their two basic functions of autotrophy and heterotrophy, i.e. photosynthesis and respiration, which directly interact with the carbon and oxygen cycles. In river systems, according to the RCC [[7](#ref-CR7 "Vannote RL, Minshall GW, Cummins KW et al (1980) The river continuum concept. Can J Fish Aquat Sci 37:130–137. https://doi.org/10.1139/f80-017
")\], a distinct longitudinal pattern is predicted with ecosystem metabolism shifting from dominant heterotrophy in small rivers receiving most of their energy from allochthonous organic matter from the watershed to autotrophy in large rivers favourable to phytoplankton development and again to heterotrophy in estuaries, where organic matter accumulation and increased depth and turbidity reduced the possibility of photosynthesis. While this scheme is valid for pristine or slightly human-impacted rivers, it is largely affected by anthropogenic nutrient and organic matter contamination \[[67](#ref-CR67 "Billen G, Décamps H, Garnier J et al (1995) Atlantic river systems of Europe (France, Belgium, The Netherlands). In: Cushing C, Cummins K, Minshall G (eds) River and stream ecosystems. Elsevier, Amsterdam, pp 389–418")\]. Downstream of the Paris urban area, Europe’s largest WWTP’s outflows into the Seine River can contribute up to one-third of the total river discharge during extreme low-flow periods.4.1 High-Frequency Analysis of Oxygen Data Along the Main Seine Stem
Dissolved oxygen was long used as an indicator of quality for streams and rivers, mainly based on threshold values, e.g. the well-known concentration of 4 mgO2 L−1 under which aquatic life slows down [68]. Classically, dissolved oxygen data are also used to calibrate biogeochemical models [22, [41](#ref-CR41 "Vilmin L, Flipo N, Escoffier N et al (2016) Carbon fate in a large temperate human-impacted river system: focus on benthic dynamics. Glob Biogeochem Cycles 30:1086–1104. https://doi.org/10.1002/2015GB005271
          ")\]. Since the 2010s, there has been considerable development of numerical routines for direct quantification of metabolism from high-frequency dissolved oxygen monitoring \[[69](#ref-CR69 "Escoffier N, Bensoussan N, Vilmin L et al (2018) Estimating ecosystem metabolism from continuous multi-sensor measurements in the Seine river. Environ Sci Pollut Res 25:23451–23467.
            https://doi.org/10.1007/s11356-016-7096-0

          "), [70](#ref-CR70 "Needoba JA, Peterson TD, Johnson KS (2012) In: Tisuia-Arashiro SM (ed) Molecular biological technologies for ocean sensing. Humana Press, New York, pp 73–101")\], constituting a functional indicator of river ecological functioning.
High-frequency monitoring of dissolved oxygen has been carried out since the 1990s by the SIAAP (Syndicat Interdépartemental pour l’Assainissement de l’Agglomération Parisienne) given the MeSeine monitoring network (see Fig. 2). Sensors were first based on polarographic electrodes (Evita Oxy 4150) [[71](#ref-CR71 "Kanwisher J (1959) Polarographic oxygen electrode. Limnol Oceanogr 4:210–217. https://doi.org/10.2307/2832703
          ")\] and since the 2010s on optodes (LDO Hach Lange, LXV416.99.20001) \[[72](#ref-CR72 "Klimant I, Meyer V, Kühl M (1995) Fiber-optic oxygen microsensors, a new tool in aquatic biology. Limnol Oceanogr 40:1159–1165.
            https://doi.org/10.4319/lo.1995.40.6.1159

          ")\], which allows for more stable and robust measurements. High-frequency oxygen data are available at four stations downstream of Paris and upstream and downstream of the SAV wastewater treatment plant, for two periods: 2002–2004 and 2015–2017\. Data typically exhibited a marked seasonal cycle, with low oxygen concentrations (under-saturation) during summer. The seasonal dynamics is first controlled by the temperature dependence of oxygen solubility and second by the increase of microbial activity with temperature \[[73](#ref-CR73 "Wang S, Flipo N, Romary T (2018) Time-dependent global sensitivity analysis of the C-RIVE biogeochemical model in contrasted hydrological and trophic contexts. Water Res 144:341–355.
            https://doi.org/10.1016/j.watres.2018.07.033

          ")\]. From a minimum concentration around 2 mg L−1 during 2002–2004, the situation has been significantly improved over the last 15 years. Oxygen concentrations are now above the 4 mg L−1 threshold.
Sub-hourly oxygen measurements at plurennial scales show typical seasonal patterns and circadian cycles allowing for the calculation of ecosystem metabolism [[69](#ref-CR69 "Escoffier N, Bensoussan N, Vilmin L et al (2018) Estimating ecosystem metabolism from continuous multi-sensor measurements in the Seine river. Environ Sci Pollut Res 25:23451–23467. https://doi.org/10.1007/s11356-016-7096-0
          "), [70](#ref-CR70 "Needoba JA, Peterson TD, Johnson KS (2012) In: Tisuia-Arashiro SM (ed) Molecular biological technologies for ocean sensing. Humana Press, New York, pp 73–101"), [74](#ref-CR74 "Guillon S, Thorel M, Flipo N et al (2019) Functional classification of artificial alluvial ponds driven by connectivity with the river: consequences for restoration. Ecol Eng 127:394–403.
            https://doi.org/10.1016/j.ecoleng.2018.12.018

          "), [75](#ref-CR75 "Odum HT (1956) Primary production in flowing waters. Limnol Oceanogr 1:795–801")\]. The quantification of the daily metabolism at a monitoring station is based on the analysis of oxygen circadian variations, from which values of ER (ecosystem respiration, defined as negative), GPP (gross primary production) and NEP (net ecosystem production; NEP = GPP + ER) are deduced. Each term ranged from 1 to 30 gO2 m−2 day−1 following a seasonal cycle with the lowest values in winter and the highest in summer, within a range similar to values found in isolated eutrophic ponds \[[74](#ref-CR74 "Guillon S, Thorel M, Flipo N et al (2019) Functional classification of artificial alluvial ponds driven by connectivity with the river: consequences for restoration. Ecol Eng 127:394–403.
            https://doi.org/10.1016/j.ecoleng.2018.12.018

          ")\] but slightly higher than those found in freshwaters for low and high Strahler orders \[[15](#ref-CR15 "Flipo N, Rabouille C, Poulin M et al (2007) Primary production in headwater streams of the Seine basin: the Grand Morin case study. Sci Total Environ 375:98–109.
            https://doi.org/10.1016/j.scitotenv.2006.12.015

          "), [41](#ref-CR41 "Vilmin L, Flipo N, Escoffier N et al (2016) Carbon fate in a large temperate human-impacted river system: focus on benthic dynamics. Glob Biogeochem Cycles 30:1086–1104.
            https://doi.org/10.1002/2015GB005271

          "), [69](#ref-CR69 "Escoffier N, Bensoussan N, Vilmin L et al (2018) Estimating ecosystem metabolism from continuous multi-sensor measurements in the Seine river. Environ Sci Pollut Res 25:23451–23467.
            https://doi.org/10.1007/s11356-016-7096-0

          "), [76](#ref-CR76 "Dodds WK, Veach AM, Ruffing CM et al (2013) Abiotic controls and temporal variability of river metabolism: multiyear analyses of Mississippi and Chattahoochee River data. Freshwater Sci 32:1073–1087.
            https://doi.org/10.1899/13-018.1

          "), [77](#ref-CR77 "Battin TJ, Kaplan LA, Findlay S et al (2008) Biophysical controls on organic carbon fluxes in fluvial networks. Nat Geosci 1:95–100")\].
For the two periods and all the stations, NEP is on average negative in this urbanised sector, indicating heterotrophic functioning, which is fully consistent with previous estimates [[41](#ref-CR41 "Vilmin L, Flipo N, Escoffier N et al (2016) Carbon fate in a large temperate human-impacted river system: focus on benthic dynamics. Glob Biogeochem Cycles 30:1086–1104. https://doi.org/10.1002/2015GB005271
          "), [69](#ref-CR69 "Escoffier N, Bensoussan N, Vilmin L et al (2018) Estimating ecosystem metabolism from continuous multi-sensor measurements in the Seine river. Environ Sci Pollut Res 25:23451–23467.
            https://doi.org/10.1007/s11356-016-7096-0

          "), [78](#ref-CR78 "Garnier J, Billen G (2007) Production vs. Respiration in river systems: an indicator of an “ecological status”. Sci Total Environ 375:110–124.
            https://doi.org/10.1016/j.scitotenv.2006.12.006

          ")\]. NEP seasonal variability is more intense during the 2002–2004 period than during the 2015–2017 period, due to the reduction in algal development and its respiration and to a reduction of bacterial heterotrophic respiration following the decrease in organic matter emissions from WWTPs (Fig. [3](#Fig3)).
The spatial and temporal dynamics of metabolism along the reach and between the two periods studied are characterised in terms of average daily metabolism for each entire period (Fig. 7). During 2002–2004, the absolute value of ER and GPP increased continuously from upstream to downstream, roughly doubling metabolism intensity from Suresnes to Méricourt and hence a similar trend for NEP. These increases indicate substantial input of allochthonous organic carbon from this highly populated area, especially downstream of Bougival, and production of autochthonous algal organic carbon.
Fig. 7
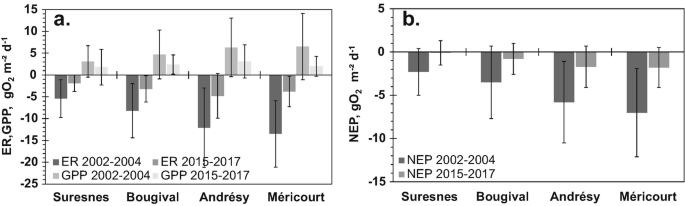

Average intensity of daily metabolism during 2002–2004 and 2015–2017 for the four stations studied (with Suresnes upstream to Méricourt downstream). GPP, ER (a) and NEP (b) are in g O2 m−2 day−1. Metabolism is calculated for a reaeration coefficient _k_600 = 2 m/day and a mixing depth _Z_mix = 5 m
During the 2015–2017 period, the metabolism intensity still increased from Suresnes to Andrésy (Fig. 7), even though ER and GPP intensities are three times lower than during the 2002–2004 period (Fig. 7). However, between Andrésy and Méricourt, ER and GPP intensities decreased, because allochthonous carbon inputs had already been mineralised upstream and autochthonous algal biomass had been reduced.
On average, there is a two- to threefold decrease in ER and GPP metabolism intensity between the two periods, underlining the positive and significant impact of the evolution of treatments in the SAV WWTP, as well as in all other smaller plants. Indeed, between the two periods, the pressure exerted on the lower Seine River by the Paris conurbation was divided by three. This decrease is in agreement with the decrease in BOD load (see above) for all the SIAAP WWTPs, as well as with total phosphorus and ammonium loads from SAV, which were reduced by factors of 3.4 and 4.4, respectively, over the 15-year time span.
4.2 CO2 Supersaturation in the Seine River: Carbon Sources, Fate and Budget
Several aquatic carbon sources and processes are in use. Besides in-stream autotrophy and heterotrophy, inputs of dissolved inorganic carbon (including carbon dioxide) from the basin contribute to supersaturation of CO2 in the river with respect to atmospheric concentrations.
Long-term data from the Water Agency and from the SIAAP allow the reconstruction of partial pressure of CO2 (pCO2) and of the biodegradable organic loadings since 1970 [[34](#ref-CR34 "Marescaux A, Thieu V, Borges AV, Garnier J (2018) Seasonal and spatial variability of the partial pressure of carbon dioxide in the human-impacted Seine River in France. Sci Rep 8:13961. https://doi.org/10.1038/s41598-018-32332-2
          ")\]. Going back to the 1970s, pCO2 is estimated given the pH, water temperature and total alkalinity \[[34](#ref-CR34 "Marescaux A, Thieu V, Borges AV, Garnier J (2018) Seasonal and spatial variability of the partial pressure of carbon dioxide in the human-impacted Seine River in France. Sci Rep 8:13961.
            https://doi.org/10.1038/s41598-018-32332-2

          ")\]. Because the lower Seine is the most impacted sector of the river, pCO2 values were compared upstream of Paris and downstream at Poses (the outlet of the river). Upstream of Paris, pCO2 oscillated around 4,000 ppm during the 1970–2015 period. A maximum supersaturation of 10,000–12,000 ppm was reached downstream of Paris during the period of maximum organic pollution (1985–2000). BOD emitted from WWTPs indeed followed the exact same pattern as pCO2 \[[34](#ref-CR34 "Marescaux A, Thieu V, Borges AV, Garnier J (2018) Seasonal and spatial variability of the partial pressure of carbon dioxide in the human-impacted Seine River in France. Sci Rep 8:13961.
            https://doi.org/10.1038/s41598-018-32332-2

          ")\] and therefore directly contributed to the CO2 budget through direct outflows in the river system. Improvements of wastewater treatments in WWTPs therefore had a positive effect not only on water quality in terms of oxygenation, nutrients and eutrophication (see Fig. [5](#Fig5)) but also on pCO2 and hence on CO2 emissions by the river network.
To determine diffuse sources, values from the ADES database (www.ades.eaufrance.fr, last accessed on 2018/11/05) and our own pCO2 measurements in piezometers were used. Data provided at the scale of the whole Seine basin were grouped by water body units according to the lithology and stratigraphy [[34](#ref-CR34 "Marescaux A, Thieu V, Borges AV, Garnier J (2018) Seasonal and spatial variability of the partial pressure of carbon dioxide in the human-impacted Seine River in France. Sci Rep 8:13961. https://doi.org/10.1038/s41598-018-32332-2
          "), [59](#ref-CR59 "Marescaux A, Thieu V, Garnier J (2018) Carbon dioxide, methane and nitrous oxide emissions from the human-impacted Seine watershed in France. Sci Total Environ 643:247–259.
            https://doi.org/10.1016/j.scitotenv.2018.06.151

          ")\].
In-river CO2 concentrations simulated with Riverstrahler match the CO2 estimated with the Water Agency database [[34](#ref-CR34 "Marescaux A, Thieu V, Borges AV, Garnier J (2018) Seasonal and spatial variability of the partial pressure of carbon dioxide in the human-impacted Seine River in France. Sci Rep 8:13961. https://doi.org/10.1038/s41598-018-32332-2
"), [79](#ref-CR79 "Marescaux A (2018) Carbon cycling across the human-impacted Seine River basin: from the modelling of carbon dioxide outgassing to the assessment of greenhouse gas emissions. Sorbonne Université, Paris")\] (Fig. [8](#Fig8)). The values in the Marne River, a major tributary of the Seine River upstream of Paris, indicate an upstream “background level” of 1.2 mgC L−1, which is above the CO2 saturation value of around 0.2 mgC L−1 (393 ppmv) at 10°C, whereas WWTPs outflows lead to a supersaturation of >2 mgC L−1 in the lower Seine River from Paris to the outlet.Fig. 8
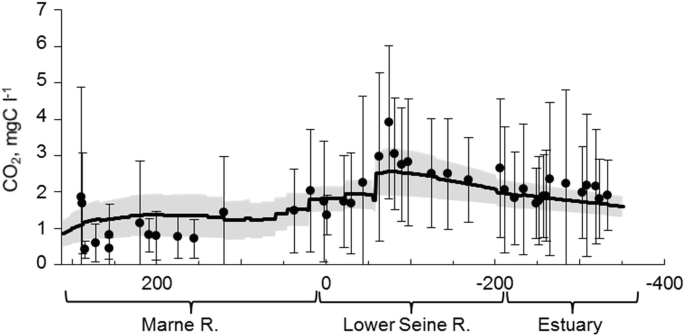

Longitudinal profile of CO2 in the Marne River and lower Seine to the estuary for the 2010–2013 period. Black dots are average pCO2 estimations (see text). Bars are standard deviations. The black line is the averaged Riverstrahler simulation for the same period. The simulation envelope (grey area) represents standard deviations of CO2
Based on these simulations, an annual average budget (2010–2013) of the Seine River is calculated for inorganic (IC) and organic (OC) carbon (Table 2). Inorganic and organic carbon budgets differ by one order of magnitude, with total inputs to the river system of 17,300 and 1,600 kg C km−2 year−1, respectively. The contribution of groundwater to IC is the highest (57.5%), although inputs from the subroot zone are also significant (34.4%) [79]. Compared to diffuse sources, the contribution of WWTPs to the IC and OC inputs is comparatively low and accounts for 6.5% and 23.2%, respectively.
Table 2 Average inorganic (a) and organic (b) carbon budgets in the Seine hydrosystem (kgC km−2 year−1) calculated by Riverstrahler (2010–2013)
Total carbon exports at the outlet in Poses are reported to account for 69% and 65% of IC and OC total inputs. CO2 ventilation is an important physical process in this IC budget, i.e. 30.8% of overall losses (Table 2). The high inorganic diffuse sources brought to the river network are clearly responsible for the supersaturation in CO2 and hence CO2 evasion. It confirms the potential contribution of freshwater to the global CO2 emissions [[80](#ref-CR80 "Le Quéré C, Andrew RM, Friedlingstein P et al (2018) Global carbon budget 2018. Earth Syst Sci Data 10:2141–2194. https://doi.org/10.5194/essd-10-2141-2018
")\] through abiotic processes. Even though Cole et al. \[[81](#ref-CR81 "Cole JJ, Prairie YT, Caraco NF et al (2007) Plumbing the global carbon cycle: integrating inland waters into the terrestrial carbon budget. Ecosystems 10:171–184")\] pointed out the importance of riverine CO2 sources in the global carbon budget, biotic processes under the Seine’s temperate climate were negligible in carbon emissions. Heterotrophic respiration by microorganisms accounts for only 1.5% of IC inputs. Similarly, losses through net primary production (NPP) also accounted for a small proportion in terms of IC (0.5%) and even less for nitrification (0.2%) for the OC balance (Table [2](#Tab2)).5 Further Improvement of Water Quality
5.1 Progress Made in Wastewater Treatments
Riverstrahler is now used to explore various future wastewater treatment scenarios. Although considerable improvements have been made in the largest WWTPs of the Seine basin, some of the smallest WWTPs of the 1900 spread over the basin still have to implement the Urban Wastewater Directives [64]. Compared to a reference situation (2002–2014), nitrogen and phosphorus fluxes at the outlet of the Seine River could be decreased by 10 and 20%, respectively, when current regulations of tertiary treatments (nitrification and denitrification and dephosphatation) are generalised. For silica, a diffuse source pollutant, no visible change would occur with further wastewater treatment (Fig. 9a). An appreciation of these efforts is provided by a backward scenario simulating the situation of wastewater treatment as it was in the 1980s. The difference with the reference scenario is very telling in terms of the distance covered over the last 30 years. These results also indicate that any relaxation in the treatment of domestic effluents, e.g. following a disengagement of the national government, could lead to a dramatic situation. Slight changes in silica fluxes (Fig. 9a) result from silica consumption with more or less nutrient (N, P) availability for diatom growth.
Fig. 9
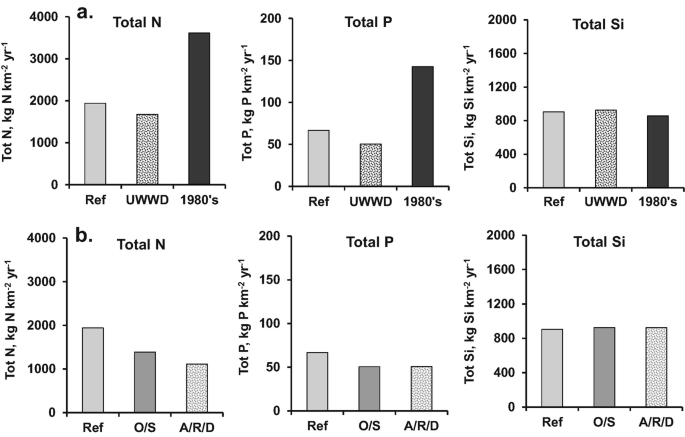

Total nitrogen (N), phosphorus (P) and silica (Si) fluxes at the outlet of the Seine River calculated by Riverstrahler for the 2002–2014 reference situation (Ref.): (a) for a completion of the UWWD, and for a situation that would mimic the condition in the 1980s with low wastewater treatment, (b) for the O/S and A/R/D scenarios, respectively, agriculture opening and specialisation and autonomy, livestock reconnection and Demitarian diet. Both O/S and A/R/D scenarios also include the improvement of wastewater treatments
Despite all the efforts made in WWTPs, which strongly improved the water quality in the Seine River, nutrient fluxes delivered at the coastal zone are still responsible for eutrophication in the Seine Bight, with toxic algal blooms [[82](#ref-CR82 "Passy P, Le Gendre R, Garnier J et al (2016) Eutrophication modelling chain for improved management strategies to prevent algal blooms in the Bay of Seine. Mar Ecol Prog Ser 543:107–125. https://doi.org/10.3354/meps11533
          ")\] and fishery problems. Moreover, nitrate contamination of groundwater \[[58](#ref-CR58 "Ledoux E, Gomez E, Monget JM et al (2007) Agriculture and groundwater nitrate contamination in the Seine basin. The STICS-MODCOU modelling chain. Sci Total Environ 375:33–47")\] and closure of drinking water wells are a real problem for the basin’s water agencies and drinking water suppliers. Pesticide contamination, associated with intensive agricultural practices, is also an important concern in the basin \[[83](#ref-CR83 "Blanchoud H, Schott C, Tallec G et al (2020) How agricultural practices should be integrated to understand and simulate long-term pesticide contamination in the Seine River basin? In: Flipo N, Labadie P, Lestel L (eds) The Seine River basin. Handbook of environmental chemistry. Springer, Cham.
            https://doi.org/10.1007/698_2019_385

          ")\].
5.2 Acting on Diffuse Agricultural Sources to Improve Water Quality
Point source pollutions are today almost completely under control. Simultaneously, diffuse agricultural sources, particularly of nitrogen, have become the subject of particular concern because of their cascading effect on many compartments of the environment [84]. Two contrasted scenarios of the future of the agro-food system have been established and compared [[85](#ref-CR85 "Billen G, Thieu V, Garnier J, Silvestre M (2009) Modelling the N cascade in regional watersheds: the case study of the Seine, Somme and Scheldt rivers. Agric Ecosyst Environ 133:234–246. https://doi.org/10.1016/j.agee.2009.04.018
          "), [86](#ref-CR86 "Garnier J, Billen G, Vilain G et al (2014) Curative vs. preventive management of nitrogen transfers in rural areas: lessons from the case of the Orgeval watershed (Seine River basin, France). J Environ Manag 144:125–134.
            https://doi.org/10.1016/j.jenvman.2014.04.030

          ")\]. The first one consists of the continuation of the current trends of opening and specialisation (O/S) of the conventional cropping systems following regulation but without questioning the basic structural features of the current production system. The second scenario (A/R/D) involves a radical reorganisation of agricultural production, generalising organic farming practices, reconnecting livestock and crop farming \[[57](#ref-CR57 "Anglade J, Billen G, Garnier J et al (2015) Nitrogen soil surface balance of organic vs conventional cash crop farming in the Seine watershed. Agric Syst 139:82–92.
            https://doi.org/10.1016/j.agsy.2015.06.006

          "), [87](#ref-CR87 "Garnier J, Anglade J, Benoit M et al (2016) Reconnecting crop and cattle farming to reduce nitrogen losses to river water of an intensive agricultural catchment (Seine basin, France): past, present and future. Environ Sci Pol 63:76–90.
            https://doi.org/10.1016/j.envsci.2016.04.019

          ")\] and changing human consumption towards a Demitarian diet, i.e. cutting consumption of animal proteins by half. The O/S scenario shows a decrease in nutrient fluxes, partly linked to the improvement of wastewater treatment, which is also included in the scenarios (Fig. [9b](#Fig9)).
A possible further reduction in N fluxes is demonstrated with the A/R/D scenario (Fig. 9b). Regarding P fluxes, the marginal changes observed are linked to the regulation compliance of the WWTP scenario, while silica fluxes, essentially coming from rock weathering, do not change.
5.3 Impact of the Seine River Nutrient Fluxes at the Coastal Zone
At the coastal zone, the Seine River waters flowing north in the Channel and to the Southern North Sea have been recognised as a major threat for eutrophication. France has therefore been convicted several times by the EU Court of Justice for not sufficiently reducing its N fluxes [[82](#ref-CR82 "Passy P, Le Gendre R, Garnier J et al (2016) Eutrophication modelling chain for improved management strategies to prevent algal blooms in the Bay of Seine. Mar Ecol Prog Ser 543:107–125. https://doi.org/10.3354/meps11533
          "), [88](#ref-CR88 "Lancelot C, Thieu V, Polard A et al (2011) Cost assessment and ecological effectiveness of nutrient reduction options for mitigating Phaeocystis colony blooms in the Southern North Sea: an integrated modeling approach. Sci Total Environ 409:2179–2191.
            https://doi.org/10.1016/j.scitotenv.2011.02.023

          ")\].
An indicator for assessing the risk of coastal eutrophication potential (ICEP), based on the nutrient imbalance in riverine fluxes with respect to the algae requirement, has been calculated. The N- and P-ICEP [[89](#ref-CR89 "Billen G, Garnier J (2007) River basin nutrient delivery to the coastal sea: assessing its potential to sustain new production of non-siliceous algae. Mar Chem 106:148–160. https://doi.org/10.1016/j.marchem.2006.12.017
")\] are based on the C:N:P:Si molar ratios of 106:16:1:20 \[[90](#ref-CR90 "Redfield AC, Ketchum BH, Richards FA (1963) The sea. Ideas and observations on progress in the study of the seas. The composition of the sea-water comparative and descriptive oceanography. Interscience Publishers, New York, pp 26–77")\]. The ICEP can be positive or negative and represents the excess or the deficit of either N or P, respectively, with respect to silica (Fig. [10b](#Fig10)). In the 1980s conditions, both N and P were in excess compared to silica. The reference situation shows that P is now much less in excess and nearly balanced compared to Si, whereas N is systematically far above a balanced N/Si situation. Improving agricultural practices, which would further decrease N-ICEP, would reduce the risk of coastal eutrophication. The most radical agricultural scenario (A/R/D) has the advantage of also banishing pesticides.Fig. 10
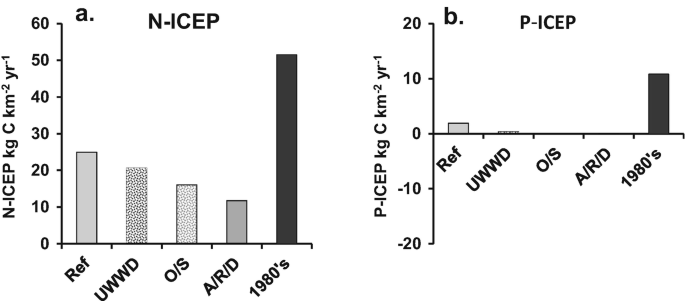

Indicator of coastal eutrophication potential (ICEP) for N and P for the reference and the different scenarios. (a) N-ICEP, (b) P-ICEP
The scenarios of modified agricultural practices and urban sewage treatments highlighted that changes, not only in agricultural practices but also in the agricultural production system, are needed to reduce exports of nitrogen to the coastal zone and associated eutrophication risks. However, these changes in human practices might take place in a context of climate change that also impacts water quality.
5.4 The Context of Climate Change
Scenarios were developed to evaluate the impact of climate change on river water quality and eutrophication indices [[91](#ref-CR91 "Raimonet M, Thieu V, Silvestre M et al (2018) Landward perspective of coastal eutrophication potential under future climate change: the Seine River case (France). Front Mar Sci 5:136. https://doi.org/10.3389/fmars.2018.00136
")\]. For all scenarios, eutrophication indices remained high, indicating that climate change is not expected to decrease eutrophication risks in the future and confirming that changes in human practices are needed.When investigating changes landward in the river system, water quality is expected to be mostly modified in summer. At the river outlet, climate change has been shown to increase nitrate and phosphate concentrations during low flow due to a decreasing river discharge. This indicates a higher sensitivity to urban release from WWTPs during low flow in the future and a higher sensitivity to WWTP malfunctioning. These increases in nitrate and phosphate concentrations are particularly high in stream orders greater than 4 (up to +19% and 42%, respectively, at the outlet for the driest RCP 8.5 projection). Changes in water temperature are even expected to superimpose with potential modifications of phytoplankton biomass and composition as well as oxygen concentrations, as shown by the sensitivity analysis performed by Wang et al. [[73](#ref-CR73 "Wang S, Flipo N, Romary T (2018) Time-dependent global sensitivity analysis of the C-RIVE biogeochemical model in contrasted hydrological and trophic contexts. Water Res 144:341–355. https://doi.org/10.1016/j.watres.2018.07.033
")\]. Acting on diffuse sources and, to a lesser extent, on point sources (as discussed above) is therefore even more necessary in a context of climate change.6 Conclusions and Perspectives
The PIREN-Seine program is a rare example of an interdisciplinary scientific project successfully spanning 30 years. Owing to its longevity, it has been able to document the long-term changes experienced by the Seine River system and its metabolism.
At the time the program was launched, in the late 1980s, the major water quality issue was the oxygen deficits caused by discharge of insufficiently treated urban wastewater, particularly in the main branch of the Seine downstream from Paris. The heterotrophic degradation of the organic matter and the nitrification of the reduced nitrogen brought by these point sources of pollution were responsible for severe oxygen depletion in these sectors.
One decade later, the problem of algal blooms in the large tributaries of the Seine upstream from Paris appeared as a major threat for drinking water production from surface water (about half the supply of the Paris agglomeration) and also as a significant contributor to organic matter loading in the downstream sectors. The abundance of phosphorus, coming from point sources, and the resulting lack of any limitation of algal growth appeared as the major cause of this river’s eutrophication problem. The strong contrast between autotrophy in these upstream sectors and the heterotrophy of the downstream sectors of the river network was particularly striking.
In the early 2000s, major progress in wastewater treatment, including the drastic reduction of organic matter loading, as well as the treatment of phosphorus, completely changed the situation. Good oxygen levels were recovered nearly everywhere, while algal blooms were considerably reduced as a result of the limitation of phosphorus.
While the WWTP outflows of nutrients were drastically reduced following the European regulations of the Water Framework Directive [65], diffuse pollutions have not yet produced the same success story. Nitrate (and pesticide) contamination is still a major threat for groundwater quality and the drinking water supply, for river water quality and the diversity of its biological communities and for marine coastal zones and the occurrence of toxic algal blooms.
In essence, controlling diffuse pollutions is much more difficult to achieve than containing point source pollutions. It requires not only technical measures but also a complete overhaul of the structure of the agro-food system and hence of the socioecological metabolism of the watershed. Moreover, inertia of groundwater transfer time delays improvements, which is most often difficult for farmers to accept, in view of the efforts required of them.
In addition to the PIREN-Seine program, another parallel long-term program on the Seine Estuary has made it possible to quantify the role of the Seine estuary in the transfer and transformation of the nutrients and carbon fluxes from the upstream hydrological network [[92](#ref-CR92 "Garnier J, Beusen A, Thieu V et al (2010) N:P:Si nutrient export ratios and ecological consequences in coastal seas evaluated by the ICEP approach. Glob Biogeochem Cycles 24:GB0A05. https://doi.org/10.1029/2009GB003583
          "), [93](#ref-CR93 "Romero E, Le Gendre R, Garnier J et al (2016) Long-term water quality in the lower Seine: lessons learned over 4 decades of monitoring. Environ Sci Pol 58:141–154.
            https://doi.org/10.1016/j.envsci.2016.01.016

          ")\]. Riverstrahler has already combined with coastal zone models in a chain that has quantified the impact of the Seine River nutrient deliveries at the coastal zone, showing that nutrient imbalance, i.e. a large excess of N over Si and P, was the cause of coastal eutrophication, with toxic algae events in the Seine Bight and fishing closure \[[94](#ref-CR94 "Desmit X, Thieu V, Billen G et al (2018) Reducing marine eutrophication may require a paradigmatic change. Sci Total Environ 635:1444–1466.
            https://doi.org/10.1016/j.scitotenv.2018.04.181

          ")\]. However, the often neglected buffer role of the estuary is now being included in the model chain.
References
- Odum EP (1959) Fundamental of ecology. W.B. Saunders Company, Philadelphia
Google Scholar - Wetzel RG (1983) Limnology2nd edn. Saunders College Publishing, Philadelphia
Google Scholar - Schindler DW (1974) Eutrophication and recovery in experimental lakes: implications for lake management. Science 184:897–899. https://doi.org/10.1126/science.184.4139.897
Article CAS Google Scholar - Schindler DW (1998) Replication versus realism: the need for ecosystem-scale experiments. Ecosystems 1:323–334. https://doi.org/10.1007/s100219900026
Article Google Scholar - Schelske CL, Stoermer EF (1971) Eutrophication, silica depletion, and predicted changes in algal quality in Lake Michigan. Science 173:423–424. https://doi.org/10.1126/science.173.3995.423
Article CAS Google Scholar - Ward JV (1989) The four-dimensional nature of lotic ecosystems. J N Am Benthol Soc 8:2–8
Article Google Scholar - Vannote RL, Minshall GW, Cummins KW et al (1980) The river continuum concept. Can J Fish Aquat Sci 37:130–137. https://doi.org/10.1139/f80-017
Article Google Scholar - Strahler AN (1957) Quantitative analysis of watershed geomorphology. Geophys Union Trans 38:913–920
Article Google Scholar - Garnier J, Billen G (1994) Ecological interactions in a shallow sand-pit lake (Lake Créteil, Parisian Basin, France): a modelling approach. Hydrobiologia 275/276:97–114
Article Google Scholar - Garnier J, Billen G, Sanchez N, Leporcq B (2000) Ecological functioning of the Marne reservoir (Upper Seine Basin, France). Regul Rivers Res Manage 16:51–71
Article Google Scholar - Passy P, Garnier J, Billen G et al (2012) Restoration of ponds in rural landscapes: modelling the effect on nitrate contamination of surface water (the Seine River Basin, France). Sci Total Environ 430:280–290. https://doi.org/10.1016/j.scitotenv.2012.04.035
Article CAS Google Scholar - Billen G, Ramarson A, Thieu V et al (2018) Nitrate retention at the river–watershed interface: a new conceptual modeling approach. Biogeochemistry 139:31–51. https://doi.org/10.1007/s10533-018-0455-9
Article CAS Google Scholar - Flipo N, Even S, Poulin M et al (2007) Modelling nitrate fluxes at the catchment scale using the integrated tool CaWaQS. Sci Total Environ 375:69–79. https://doi.org/10.1016/j.scitotenv.2006.12.016
Article CAS Google Scholar - Flipo N, Jeannée N, Poulin M et al (2007) Assessment of nitrate pollution in the Grand Morin aquifers (France): combined use of geostatistics and physically-based modeling. Environ Pollut 146:241–256. https://doi.org/10.1016/j.envpol.2006.03.056
Article CAS Google Scholar - Flipo N, Rabouille C, Poulin M et al (2007) Primary production in headwater streams of the Seine basin: the Grand Morin case study. Sci Total Environ 375:98–109. https://doi.org/10.1016/j.scitotenv.2006.12.015
Article CAS Google Scholar - Newcomer ME, Hubbard SS, Fleckenstein JH et al (2016) Simulating bioclogging effects on dynamic riverbed permeability and infiltration. Water Resour Res 52:2883–2900. https://doi.org/10.1002/2015WR018351
Article Google Scholar - Newcomer ME, Hubbard SS, Fleckenstein JH et al (2018) Influence of hydrological perturbations and riverbed sediment characteristics on hyporheic zone respiration of CO2 and N2. J Geophys Res Biogeosci 123:902–922. https://doi.org/10.1002/2017JG004090
Article CAS Google Scholar - Billen G, Garnier J, Le Noë J et al (2020) The Seine watershed water-agro-food system: long-term trajectories of C, N, P metabolism. In: Flipo N, Labadie P, Lestel L (eds) The Seine River basin. Handbook of environmental chemistry. Springer, Cham. https://doi.org/10.1007/698_2019_393
- Flipo N, Gallois N, Labarthe B et al (2020) Pluri-annual water budget on the Seine basin: past, current and future trends. In: Flipo N, Labadie P, Lestel L (eds) The Seine River basin. Handbook of environmental chemistry. Springer, Cham. https://doi.org/10.1007/698_2019_392
- Flipo N, Mouhri A, Labarthe B et al (2014) Continental hydrosystem modelling: the concept of nested stream-aquifer interfaces. Hydrol Earth Syst Sci 18:3121–3149. https://doi.org/10.5194/hess-18-3121-2014
Article Google Scholar - Billen G, Garnier J (1997) The Phison River plume: coastal eutrophication in response to changes in land use and water management in the watershed. Aquat Microb Ecol 13:3–17. https://doi.org/10.3354/ame013003
Article Google Scholar - Billen G, Garnier J, Ficht A, Cun C (2001) Modeling the response of water quality in the Seine River estuary to human activity in its watershed over the last 50 years. Estuaries 24:977–993
Article CAS Google Scholar - Billen G, Garnier J, Hanset P (1994) Modelling phytoplankton development in whole drainage networks: the RIVERSTRAHLER model applied to the Seine river system. Hydrobiologia 289:119–137
Article Google Scholar - Garnier J, Billen G, Coste M (1995) Seasonal succession of diatoms and chlorophycae in the drainage network of the river Seine: observations and modelling. Limnol Oceanogr 40:750–765
Article CAS Google Scholar - Brion N, Billen G (1998) Une réevaluation de la méthode de mesure de l’activité nitrifiante autotrophe par la méthode d’incorporation de bicarbonate marqué H14CO3 - et son application pour estimer des biomasses de bactéries nitrifiantes. Rev des Sci l’Eau 11:283–302
CAS Google Scholar - Brion N, Billen G, Guézennec L, Ficht A (2000) Distribution of nitrifying activity in the Seine River (France) from Paris to the estuary. Estuar Coasts 23:669–682. https://doi.org/10.2307/1352893
Article CAS Google Scholar - Raimonet M, Vilmin L, Flipo N et al (2015) Modelling the fate of nitrite in an urbanized river using experimentally obtained nitrifier growth parameters. Water Res 73:373–387. https://doi.org/10.1016/j.watres.2015.01.026
Article CAS Google Scholar - Garnier J, Billen G, Cébron A (2007) Modelling nitrogen transformations in the lower Seine river and estuary (France): impact of wastewater release on oxygenation and N2O emission. Hydrobiologia 588:291–302. https://doi.org/10.1007/s10750-007-0670-1
Article CAS Google Scholar - Aissa-Grouz N, Garnier J, Billen G et al (2015) The response of river nitrification to changes in wastewater treatment (The case of the lower Seine River downstream from Paris). Ann Limnol Int J Limnol 51:351–364. https://doi.org/10.1051/limn/2015031
Article Google Scholar - Némery J, Garnier J (2007) Origin and fate of phosphorus in the Seine watershed (France): agricultural and hydrographic P budgets. J Geophys Res 112:1–14. https://doi.org/10.1029/2006JG000331
Article CAS Google Scholar - Vilmin L, Aissa-Grouz N, Garnier J et al (2015) Impact of hydro-sedimentary processes on the dynamics of soluble reactive phosphorus in the Seine River. Biogeochemistry 122:229–251. https://doi.org/10.1007/s10533-014-0038-3
Article CAS Google Scholar - Flipo N, Even S, Poulin M et al (2004) Biogeochemical modelling at the river scale: plankton and Periphyton dynamics - Grand Morin case study, France. Ecol Model 176:333–347
Article CAS Google Scholar - Thouvenot-Korppoo M, Billen G, Garnier J (2009) Modelling benthic denitrification processes over a whole drainage network. J Hydrol 379:239–250. https://doi.org/10.1016/j.jhydrol.2009.10.005
Article Google Scholar - Marescaux A, Thieu V, Borges AV, Garnier J (2018) Seasonal and spatial variability of the partial pressure of carbon dioxide in the human-impacted Seine River in France. Sci Rep 8:13961. https://doi.org/10.1038/s41598-018-32332-2
Article CAS Google Scholar - Garnier J, Billen G, Hannon E et al (2002) Modeling transfer and retention of nutrients in the drainage network of the Danube River. Estuar Coast Shelf 54:285–308
Article CAS Google Scholar - Le TPQ, Billen G, Garnier J, Chau VM (2014) Long-term biogeochemical functioning of the Red River (Vietnam): past and present situations. Reg Environ Chang 15:329–339. https://doi.org/10.1007/s10113-014-0646-4
Article Google Scholar - Sferratore A, Garnier J, Billen G et al (2006) Diffuse and point sources of silica in the Seine River watershed. Environ Sci Technol 40:6630–6635. https://doi.org/10.1021/es060710q
Article CAS Google Scholar - Even S, Poulin M, Mouchel J-M et al (2004) Modelling oxygen deficits in the Seine River downstream of combined sewer overflows. Ecol Model 173:177–196
Article CAS Google Scholar - Even S, Mouchel J-M, Servais P et al (2007) Modeling the impacts of combined sewer overflows on the river Seine water quality. Sci Total Environ 375:140–151. https://doi.org/10.1016/j.scitotenv.2006.12.007
Article CAS Google Scholar - Even S, Poulin M, Garnier J et al (1998) River ecosystem modelling: application of the ProSe model to the Seine river (France). Hydrobiologia 373:27–37
Article Google Scholar - Vilmin L, Flipo N, Escoffier N et al (2016) Carbon fate in a large temperate human-impacted river system: focus on benthic dynamics. Glob Biogeochem Cycles 30:1086–1104. https://doi.org/10.1002/2015GB005271
Article CAS Google Scholar - Vilmin L, Flipo N, Escoffier N, Groleau A (2018) Estimation of the water quality of a large urbanized river as defined by the European WFD: what is the optimal sampling frequency? Environ Sci Pollut Res 25:23485–23501. https://doi.org/10.1007/s11356-016-7109-z
Article CAS Google Scholar - Polus E, Flipo N, de Fouquet C, Poulin M (2011) Geostatistics for assessing the efficiency of distributed physically-based water quality model. Application to nitrates in the Seine River. Hydrol Process 25:217–233. https://doi.org/10.1002/hyp.7838
Article Google Scholar - Vilmin L, Flipo N, De Fouquet C, Poulin M (2015) Pluri-annual sediment budget in a navigated river system: The Seine River (France). Sci Total Environ 502:48–59. https://doi.org/10.1016/j.scitotenv.2014.08.110
Article CAS Google Scholar - Eckhardt N (2008) A comparison of baseflow indices, which were calculated with seven different baseflow separation methods. J Hydrol 352:168–173
Article Google Scholar - Billen G, Garnier J (2000) Nitrogen transfers through the Seine drainage network: a budget based on the application of the “Riverstrahler” model. Hydrobiologia 410:139–150
Article Google Scholar - Garnier J, Némery J, Billen G, Théry S (2005) Nutrient dynamics and control of eutrophication in the Marne River system: modelling the role of exchangeable phosphorus. J Hydrol 304:397–412
Article CAS Google Scholar - Thieu V, Billen G, Garnier J (2009) Nutrient transfer in three contrasting NW European watersheds: the Seine, Somme, and Scheldt Rivers. A comparative application of the Seneque/Riverstrahler model. Water Res 43:1740–1754. https://doi.org/10.1016/j.watres.2009.01.014
Article CAS Google Scholar - Billen G, Garnier J, Némery J et al (2007) A long-term view of nutrient transfers through the Seine River continuum. Sci Total Environ 375:80–97. https://doi.org/10.1016/j.scitotenv.2006.12.005
Article CAS Google Scholar - Passy P, Gypens N, Billen G et al (2013) A model reconstruction of riverine nutrient fluxes and eutrophication in the Belgian Coastal Zone since 1984. J Mar Syst 128:106–122
Article Google Scholar - Flipo N, Lestel L, Labadie P et al (2020) Trajectories of the Seine River basin. In: Flipo N, Labadie P, Lestel L (eds) The Seine River basin. Handbook of environmental chemistry. Springer, Cham. https://doi.org/10.1007/698_2019_437
- Garnier J, Laroche L, Pinault S (2006) Determining the domestic specific loads of two wastewater plants of the Paris conurbation (France) with contrasted treatments: a step for exploring the effects of the application of the European directive. Water Res 40:3257–3266. https://doi.org/10.1016/j.watres.2006.06.023
Article CAS Google Scholar - Servais P, Garnier J, Demarteau N et al (1999) Supply of organic matter and bacteria to aquatic ecosystems through waste water effluents. Water Res 33:3521–3531
Article CAS Google Scholar - Bossard M, Feranec J, Otahel J (2000) CORINE land cover technical guide: addendum 2000. Union Eur Brussels, Brussels
Google Scholar - Billen G, Lassaletta L, Garnier J (2014) A biogeochemical view of the global agro-food system: nitrogen flows associated with protein production, consumption and trade. Glob Food Sec 3:209–219. https://doi.org/10.1016/j.gfs.2014.08.003
Article Google Scholar - Le Noë J, Billen G, Garnier J (2017) How the structure of agro-food systems shapes nitrogen, phosphorus, and carbon fluxes: the generalized representation of agro-food system applied at the regional scale in France. Sci Total Environ 586:42–55. https://doi.org/10.1016/j.scitotenv.2017.02.040
Article CAS Google Scholar - Anglade J, Billen G, Garnier J et al (2015) Nitrogen soil surface balance of organic vs conventional cash crop farming in the Seine watershed. Agric Syst 139:82–92. https://doi.org/10.1016/j.agsy.2015.06.006
Article Google Scholar - Ledoux E, Gomez E, Monget JM et al (2007) Agriculture and groundwater nitrate contamination in the Seine basin. The STICS-MODCOU modelling chain. Sci Total Environ 375:33–47
Article CAS Google Scholar - Marescaux A, Thieu V, Garnier J (2018) Carbon dioxide, methane and nitrous oxide emissions from the human-impacted Seine watershed in France. Sci Total Environ 643:247–259. https://doi.org/10.1016/j.scitotenv.2018.06.151
Article CAS Google Scholar - Rocher V, Azimi S (2017) Evolution de la qualité de la Seine en lien avec les progrès de l’assainissement. Editions Johannet, Paris
Google Scholar - Azimi S, Rocher V (2016) Influence of the water quality improvement on fish population in the Seine River (Paris, France) over the 1990-2013 period. Sci Total Environ 542:955–964. https://doi.org/10.1016/j.scitotenv.2015.10.094
Article CAS Google Scholar - Vilmin L (2014) Modélisation du fonctionnement biogéochimique de la Seine de l’agglomération parisienne à l’estuaire à différentes échelles temporelles. MINES ParisTech, Paris
Google Scholar - Cébron A (2004) Nitrification, bactéries nitrifiantes et émission de N2O. Université Pierre et Marie Curie, Paris
Google Scholar - Parliament Council of the European Union (1991) Council Directive 91/271/EEC concerning urban waste-water treatment
Google Scholar - Parliament Council of the European Union (2000) Council Directive 2000/60/EC establishing a framework for community action in the field of water policy
Google Scholar - Garnier J, Servais P, Billen G et al (2001) Lower Seine river and estuary (France) carbon and oxygen budgets during low flow. Estuaries 24:964–976. https://doi.org/10.2307/1353010
Article CAS Google Scholar - Billen G, Décamps H, Garnier J et al (1995) Atlantic river systems of Europe (France, Belgium, The Netherlands). In: Cushing C, Cummins K, Minshall G (eds) River and stream ecosystems. Elsevier, Amsterdam, pp 389–418
Google Scholar - Warren CE, Doudoroff P, Shumway DL (1973) Development of dissolved oxygen criteria for freshwater fish. US EPA, Washington
Google Scholar - Escoffier N, Bensoussan N, Vilmin L et al (2018) Estimating ecosystem metabolism from continuous multi-sensor measurements in the Seine river. Environ Sci Pollut Res 25:23451–23467. https://doi.org/10.1007/s11356-016-7096-0
Article CAS Google Scholar - Needoba JA, Peterson TD, Johnson KS (2012) In: Tisuia-Arashiro SM (ed) Molecular biological technologies for ocean sensing. Humana Press, New York, pp 73–101
Chapter Google Scholar - Kanwisher J (1959) Polarographic oxygen electrode. Limnol Oceanogr 4:210–217. https://doi.org/10.2307/2832703
Article CAS Google Scholar - Klimant I, Meyer V, Kühl M (1995) Fiber-optic oxygen microsensors, a new tool in aquatic biology. Limnol Oceanogr 40:1159–1165. https://doi.org/10.4319/lo.1995.40.6.1159
Article CAS Google Scholar - Wang S, Flipo N, Romary T (2018) Time-dependent global sensitivity analysis of the C-RIVE biogeochemical model in contrasted hydrological and trophic contexts. Water Res 144:341–355. https://doi.org/10.1016/j.watres.2018.07.033
Article CAS Google Scholar - Guillon S, Thorel M, Flipo N et al (2019) Functional classification of artificial alluvial ponds driven by connectivity with the river: consequences for restoration. Ecol Eng 127:394–403. https://doi.org/10.1016/j.ecoleng.2018.12.018
Article Google Scholar - Odum HT (1956) Primary production in flowing waters. Limnol Oceanogr 1:795–801
Article Google Scholar - Dodds WK, Veach AM, Ruffing CM et al (2013) Abiotic controls and temporal variability of river metabolism: multiyear analyses of Mississippi and Chattahoochee River data. Freshwater Sci 32:1073–1087. https://doi.org/10.1899/13-018.1
Article Google Scholar - Battin TJ, Kaplan LA, Findlay S et al (2008) Biophysical controls on organic carbon fluxes in fluvial networks. Nat Geosci 1:95–100
Article CAS Google Scholar - Garnier J, Billen G (2007) Production vs. Respiration in river systems: an indicator of an “ecological status”. Sci Total Environ 375:110–124. https://doi.org/10.1016/j.scitotenv.2006.12.006
Article CAS Google Scholar - Marescaux A (2018) Carbon cycling across the human-impacted Seine River basin: from the modelling of carbon dioxide outgassing to the assessment of greenhouse gas emissions. Sorbonne Université, Paris
Google Scholar - Le Quéré C, Andrew RM, Friedlingstein P et al (2018) Global carbon budget 2018. Earth Syst Sci Data 10:2141–2194. https://doi.org/10.5194/essd-10-2141-2018
Article Google Scholar - Cole JJ, Prairie YT, Caraco NF et al (2007) Plumbing the global carbon cycle: integrating inland waters into the terrestrial carbon budget. Ecosystems 10:171–184
Article CAS Google Scholar - Passy P, Le Gendre R, Garnier J et al (2016) Eutrophication modelling chain for improved management strategies to prevent algal blooms in the Bay of Seine. Mar Ecol Prog Ser 543:107–125. https://doi.org/10.3354/meps11533
Article CAS Google Scholar - Blanchoud H, Schott C, Tallec G et al (2020) How agricultural practices should be integrated to understand and simulate long-term pesticide contamination in the Seine River basin? In: Flipo N, Labadie P, Lestel L (eds) The Seine River basin. Handbook of environmental chemistry. Springer, Cham. https://doi.org/10.1007/698_2019_385
- Sutton MA, Howarth CM, Erisman JW et al (2011) The European nitrogen assessment: sources, effects and policy perspectives. Cambridge University Press, Cambridge
Book Google Scholar - Billen G, Thieu V, Garnier J, Silvestre M (2009) Modelling the N cascade in regional watersheds: the case study of the Seine, Somme and Scheldt rivers. Agric Ecosyst Environ 133:234–246. https://doi.org/10.1016/j.agee.2009.04.018
Article CAS Google Scholar - Garnier J, Billen G, Vilain G et al (2014) Curative vs. preventive management of nitrogen transfers in rural areas: lessons from the case of the Orgeval watershed (Seine River basin, France). J Environ Manag 144:125–134. https://doi.org/10.1016/j.jenvman.2014.04.030
Article CAS Google Scholar - Garnier J, Anglade J, Benoit M et al (2016) Reconnecting crop and cattle farming to reduce nitrogen losses to river water of an intensive agricultural catchment (Seine basin, France): past, present and future. Environ Sci Pol 63:76–90. https://doi.org/10.1016/j.envsci.2016.04.019
Article CAS Google Scholar - Lancelot C, Thieu V, Polard A et al (2011) Cost assessment and ecological effectiveness of nutrient reduction options for mitigating Phaeocystis colony blooms in the Southern North Sea: an integrated modeling approach. Sci Total Environ 409:2179–2191. https://doi.org/10.1016/j.scitotenv.2011.02.023
Article CAS Google Scholar - Billen G, Garnier J (2007) River basin nutrient delivery to the coastal sea: assessing its potential to sustain new production of non-siliceous algae. Mar Chem 106:148–160. https://doi.org/10.1016/j.marchem.2006.12.017
Article CAS Google Scholar - Redfield AC, Ketchum BH, Richards FA (1963) The sea. Ideas and observations on progress in the study of the seas. The composition of the sea-water comparative and descriptive oceanography. Interscience Publishers, New York, pp 26–77
Google Scholar - Raimonet M, Thieu V, Silvestre M et al (2018) Landward perspective of coastal eutrophication potential under future climate change: the Seine River case (France). Front Mar Sci 5:136. https://doi.org/10.3389/fmars.2018.00136
Article Google Scholar - Garnier J, Beusen A, Thieu V et al (2010) N:P:Si nutrient export ratios and ecological consequences in coastal seas evaluated by the ICEP approach. Glob Biogeochem Cycles 24:GB0A05. https://doi.org/10.1029/2009GB003583
Article CAS Google Scholar - Romero E, Le Gendre R, Garnier J et al (2016) Long-term water quality in the lower Seine: lessons learned over 4 decades of monitoring. Environ Sci Pol 58:141–154. https://doi.org/10.1016/j.envsci.2016.01.016
Article CAS Google Scholar - Desmit X, Thieu V, Billen G et al (2018) Reducing marine eutrophication may require a paradigmatic change. Sci Total Environ 635:1444–1466. https://doi.org/10.1016/j.scitotenv.2018.04.181
Article CAS Google Scholar