Erk 1,2 phosphorylates p27Kip1: Functional evidence for a role in high glucose-induced hypertrophy of mesangial cells (original) (raw)
Glomerular hypertrophy is one of the earliest morphologic changes of Type 1 and 2 diabetic nephropathy, and is principally due to mesangial cell growth [1, 2]. Experimental and clinical studies show that mesangial hypertrophy contributes to the subsequent development of glomerulosclerosis and decline in renal function [3, 4, 5]. Thus, delineating the mechanisms underlying mesangial hypertrophy are essential to the design of potential interventions in diabetic nephropathy. We and others have previously shown that cultured mesangial cells exposed to high glucose undergo hypertrophy after 48 h of incubation [6, 7, 9]. Cell cycle analysis showed that cells arrest in the G1 phase of the cell cycle following prolonged exposure to high glucose-containing medium [6], supporting the idea that the cell cycle plays a critical role in diabetic renal disease.
The cell cycle is positively controlled by cyclins and partner cyclin-dependent kinases (CDK), and is negatively governed by CDK inhibitors. We have recently shown that glucose-induced G1 arrest was associated with an up-regulation of the CDK inhibitor, p27Kip1 protein, but not mRNA expression [10]. In vivo studies also showed increased mesangial p27Kip1 in models of experimental diabetic nephropathy [11]. A functional role for p27Kip1 in mediating mesangial hypertrophy was proven by showing that in contrast to p27Kip1 wild-type mesangial cells (+/+), high glucose failed to induce hypertrophy in p27Kip1 –/– mesangial cells. Indeed, high glucose facilitated cell cycle progression in p27Kip1–/– cells, but caused cell cycle arrest in p27Kip1+/+ cells [12]. Finally, reconstituting p27Kip1 with an inducible vector system restored high glucose-mediated hypertrophic phenotype in p27Kip1 –/– cells [12]. These results show that p27Kip1 is functionally required for glucose-induced cell cycle arrest and hypertrophy [12].
The mechanisms whereby high glucose increases p27Kip1 protein expression by post-transcriptional mechanisms has not been well elucidated. Studies have shown that MAP kinases (Erk 1,2) are activated in diabetic nephropathy, and that inhibition of MAP kinase activation inhibits mesangial hypertrophy [13, 14]. Accordingly, we tested the hypothesis that Erk 1,2 phosphorylates p27Kip1 in vitro. In this study we identified specific phosphorylation sites in p27Kip1 that are phosphorylated by Erk 1,2, and we utilized mutational analysis to show which of these is required for glucose-induced hypertrophy of mesangial cells.
Material and methods
Cell culture and characterization of mouse mesangial cells
Mesangial cells (MCs) from litter mate p27Kip1 +/+ and p27Kip1 –/– mice were originally isolated by differential sieving [12]. MCs were grown in Dulbecco's Modified Eagle's Medium (DMEM; Gibco-BRL, Eggenstein, Germany) containing 100 mg/dl (5.5 mmol/l) D-glucose supplemented with 10% foetal calf serum (FCS), 100 U/ml penicillin, 100 µg/ml streptomycin, and 2 mmol/l glutamine. They were cultured at 37°C in 5% CO2, and passaged every 4 to 5 days. Experiments were carried out on passage 15 to 30 cells.
Cells of passage 20 were again characterized for this study by light microscopy and immunohistochemistry according to published criteria [13, 14]. Cells were fixed in methanol at −20°C for 20 min and were then washed in phosphate-buffered saline (PBS). Primary antibodies were diluted in PBS containing 1% BSA. All primary antibodies were incubated on the cells at 4°C overnight. The following primary antibodies were used: mouse anti-smooth muscle actin 1:500 (Sigma, Deisenhofen, Germany); mouse anti-desmin 1:100 (Research Diagnostics, Flanders, N.J., USA); mouse-anti-vimentin 1:50 (Dako, Carpenteria, Calif., USA); mouse anti-myosin 1:100 (Dako); goat anti-collagen I 1:200 (Southern Biotechnology Associates, Birmingham, Ala., USA); mouse anti-collagen IV 1:50 (Dako);and rabbit anti-AT1 receptor 1:50 (Santa Cruz Biotechnology, Santa Cruz, Calif., USA). The unbound primary antibody was washed away and the following secondaries were applied: biotinylated-horse-anti-mouse IgG 1:500 (Vector Labs, Burlingame, Calif., USA), biotinylated-goat-anti-rabbit IgG 1:200 (Vector Labs), and biotinylated-rabbit-anti-goat IgG 1:200 (Zymed, San Francisco, Calif., USA); and incubated at room temperature for 30 min. Antibodies were visualized using streptavidin-conjugated with Alexa Fluor. 594, 1:200 (Molecular Probes, Eugene, Ore., USA). Images of stained cells were taken on a Leica DMIL inverted microscope (Bartels & Atout, Bellevue, Wash., USA) using a digital CoolSNAPpro camera (Media Cybernetics, Silver Springs, Md., USA).
Leucine Incorporation
The incorporation of 3[H]leucine was used to assess de novo protein synthesis as previously reported [6, 12]. Briefly, cells were plated (105 per well) in 24-well plates, and were made quiescent for 12 h in serum-free media with a normal concentration of glucose (5.5 mmol/l). After an additional 12 h, the medium was replaced with either normal glucose or high glucose (450 mg/dl, 25 mmol/l) for 48 h. 18.5×10⁴ Bq of 3[H]leucine (5.25×10¹² Bq /mmol, Amersham-Pharmacia Biotech, Freiburg, Germany) was added to each well for the last 12 h of the experiment. At the end of the incubation period, MCs were washed twice in ice-cold PBS and proteins were subsequently precipitated with ice-cold 10% trichloroacetic acid. After redissolving the precipitates in 0.5 mol/l NaOH containing 0.1% Triton X-100, 5 ml scintillation cocktail (Roth, Karlsruhe, Germany) was added, and radioactivity was measured by liquid scintillation spectroscopy. 3[H]leucine incorporation experiments were repeated five times with duplicate measurements for each experiment.
Thymidine Incorporation
The incorporation of 3[H]thymidine into DNA was used to measure proliferation [6, 12]. Cells (104 cells per well) were transferred to a 96-well microtitre plate. After incubation for 12 h in normal glucose medium, MCs were subsequently grown for another 48 h in either normal or high glucose. Cells were pulsed with 3.7×10⁴ Bq 3[H]thymidine (18.5×10¹⁰ Bq/mmol, Amersham) during the last 6 h of culture. At the end of the incubation period, MCs were washed in PBS, trypsinized for 10 min a 37°C, and finally collected on glass-fibre paper with an automatic cell harvester. Radioactivity of dry filters was measured by liquid scintillation spectroscopy. 3[H]thymidine experiments were independently carried out four times with triplicate measurements.
Total protein to cell count ratio
The ratio of total protein content to cell number is another well established measure of cellular hypertrophy [12]. To measure this ratio, 105 p27Kip1 +/+ and p27Kip1 –/– MCs were seeded into each well of a six-well plate and were synchronized into quiescence for 12 h in serum-free medium containing a normal glucose concentration. p27Kip1 –/– MCs were transfected with the various constructs and cultured in either normal or high glucose containing medium. In selected experiments, p27Kip1 +/+ MCs were also exposed to the specific MAP kinase kinase 1 (MEK1) inhibitor PD98059 [2-(2′-amino-3′-methoxyphenyl)oxanaphthalen-4-one] (10-5 mol/l, Calbiochem-Novabiochem, Bad Soden, Germany). After incubation for another 48 h, cells were trypsinized, scraped off the plate with a rubber policeman, and washed twice in PBS. A small aliquot of cells were used for cell counting in a Fuchs-Rosenthal chamber after re-suspension in PBS to calculate the cell number/protein ratio. The remaining cells were lysed in 0.5 mol/l NaOH, and total protein content was measured by a modified Lowry method. Total protein content was expressed as µg protein per 103 cells. These experiments were independently carried out five times.
Cell cycle analysis
In order to carry out cell cycle analysis, cells were trypsinized, washed in ice-cold PBS, and stained for 15 min with 50 µg/ml propidium iodide in staining buffer (0.1% citrate, 0.1% Triton X100, 50 µg/ml RNAse). Cells were analyzed with FACSCalibur (Becton Dickinson, Franklin Lakes, N.J., USA) using CellQuest software (Becton Dickinson). Cell cycle analysis was done with the ModFit LT V 2.0 program (Verity Software House, Topsham, Me., USA). Cell cycle analysis was carried out separately on two occasions. In addition to cell cycle analysis, forward cell scatter was used to measure cell size. Microbead standards (Bangs Laboratories, Fishers, Ind., USA) with defined sizes [4.3, 6.8, 7.9, 8.7, 10.8×10⁻⁶ m diameter) were analyzed in parallel. The peak channel number of each microbead was measured and plotted against bead diameter. A linear relationship was obtained and cell diameters were calculated from this graph. Forward cell scatter experiments were independently done three times (independent stimulation and transfection, if appropriate).
Western blot analysis
MCs were grown in 50 ml flasks in DMEM with 10% FCS to 70 to 80% confluence, at which time the medium was changed to serum-free DMEM for 24 h and cells were subsequently grown in normal or high glucose. At the end of the stimulation period, cells were washed with PBS and lysed with 100 µl lysis buffer (2% SDS, 60 mmol/l Tris-HCl, pH 6.8), and the lysates were cleared by centrifugation. Samples of 80 µg protein (measured by a modification of the Lowry method) were denatured by the addition of 5% glycerol, 5% mercapthoethanol and 0.03% bromophenol blue, and boiled for 10 min. After centrifugation, the supernatants were loaded on a 12% SDS-polyacrylamide gel. Low molecular weight marker (Rainbow-marker, Amersham) served as the molecular weight standard. After electrophoresis, proteins were electroblotted semi-dry for 1 h at 0.8 mA/cm2 to a PVDF membrane (Hybond P, Amersham). Selected membranes were stained with Ponceau S (Sigma) to ensure equal loading and transfer of proteins. The blots were blocked in 5% non-fat dry milk in PBS containing 0.1% Tween 20 for 1 h at room temperature. The following antibodies were all used in a 1:1000 dilution: a mouse monoclonal anti-p27Kip1 antibody (BD Bioscience, Heidelberg, Germany), a rabbit polyclonal anti-Erk 1,2 antibody, and a monoclonal mouse phospho-specific Erk 1,2 (Thr202/Tyr204) antibody (all from New England Biolabs; Beverly, Mass., USA). Incubation was carried out for 1 h at room temperature. The blots were then washed once for 15 min and twice for 5 min in PBS containing 0.1% Tween 20. After incubation with an appropriate secondary antibody coupled to horseradish peroxidase, blots were washed again for 25 min and the detection was carried out using the ECL system (Amersham). Selected blots were washed and reprobed with an antibody against β-actin (Sigma) to control for small variations in protein loading and transfer. Exposed films were scanned with Fluor-S multi-imager (Bio-Rad Laboratories, Hercules, USA), and data were analyzed with the computer program Multi-Analyst from Bio-Rad. Signal intensities in control lanes were arbitrarily assigned a value of 1.00. Western blots were repeated three times.
Gene construct and transfections
A full length mouse p27Kip1 cDNA was cloned into Bluescript (Stratagene, Heidelberg, Germany). The following putative phosphorylation sites for Erk 1,2 were mutated using standard PCR techniques: serine10 to arginine, serine178 to alanine, and threonine187 toalanine. Wild-type and mutated cDNAs were cloned into the pIND vector (Invitrogen, Leek, Netherlands) and were sequenced to confirm correct orientation and the presence or absence of mutations. The expression plasmid pIND contains five modified ecdysone response elements upstream of a minimal heat shock promoter allowing inducible expression. For transient transfections, 105 p27Kip1 –/– MCs were first grown in serum-free medium for 24 h and then co-transfected with 10 µg of pINDp27Kip1 and 10 µg of the plasmid pVgRXR (Invitrogen) encoding subunits of the ecdysone receptor using lipofectin (Gibco-BRL) [12]. Cells were then incubated for 48 h in either normal or high glucose in the presence or absence of the inducer muristone (1 µg/ml). Hypertrophy, proliferation, and cell cycle analysis were carried out after 48 h of stimulation.
Expression of recombinant p27Kip1 and phosphorylation assays
A full length mouse p27Kip1 cDNA with a polyhistidine (6×His) tag cloned into pcDNA 3 was a gift of M. Eilers, University of Marburg, Germany [17]. Recombinant p27Kip1 protein was expressed in E.coli and isolated by affinity chromatography using the TALONsystem (Clontech, Heidelberg, Germany) according to the manufacturer's recommendations. p27Kip1 protein was eluted in the second and third fraction. SDS-polyacrylamide electrophoresis and Western blot analysis with a monoclonal anti-p27Kip1 antibody revealed the presence of a single band (data not shown). Recombinant p27Kip1 (5 µg) was incubated with 2 µg of activated recombinant rat MAP kinase (Erk 2, activity >600 units/µg protein; Calbiochem-Novabiochem, Bad Soden, Germany), 1 µl 10 mmol/l ATP, and 1 µl adenosine 5′-[γ-32P]triphosphate (>5000 Ci/mmol; Amersham) in kinase buffer (25 mmol/l Tris-HCl, pH 7.5; 2 mmol/l dithiothreitol, 0.1 mmol/l Na3VO4, 10 mmol/l MgCl2) for 30 min at 30°C. The product was separated on a 12% SDS-polyacrylamide gel and autoradiography was carried out for 4 days. Radioactive bands were cut out of the gel, treated with 50 mmol/l ammonium bicarbonate and proteins were precipitated with trichloroacetic acid. After resuspension, proteolyses was done with 6 N HCl for 60 min at 110°C. Electrophoresis was carried out on thin-layer cellulose plates using a Hunter thin layer peptide mapping electrophoresis system [18]. Cold phosphoamino acids (tyrosine, serine, threonine from Sigma) were run together with the sample and served as standards [18]. Bands were visualized with ninhydrin following electrophoresis, and autoradiography of the cellulose plate was then carried out. Phosphoamino acid mapping experiments were done independently on two occasions.
To test whether in vivo activated Erk 1,2 could phosphorylate recombinant p27Kip1, wild-type (p27Kip1 +/+) MCs were exposed for 10 min or 18 h in either normal or high glucose serum-free DMEM. Some cells were also treated with 10-5 mol/l PD98059. At the end of the incubation, total Erk 1,2 was immunoprecipitated as described above. After extensive washing, immunoprecipitated Erk 1,2 was incubated with recombinant p27Kip1 and in vitro phosphorylation was measured.
Statistical analysis
All values are shown as means ± SEM. Statistical significance among multiple groups was tested with non-parametric Kruskal-Wallis test. Individual groups were then tested using the Wilcoxon-Mann-Whitney test. A p value of less than 0.05 was considered statistically significant.
Results
Characterization of p27Kip1 +/+ and –/– mouse MCs
Mouse MCs were again characterized for this study. p27Kip1 +/+ and –/– MCs had a "stellate" appearance, overlapped one another and had many processes by light-microscopy (Fig. 1A). They did not grow in the "cobblestone" pattern of glomerular endothelial and epithelial cell types, also they did not form swirls upon confluence as fibroblasts do. p27Kip1 –/– MCs stained strongly positive for α-smooth muscle actin and, to a lesser extent, positive for the cytoskeletal filaments desmin and vimentin (Fig. 1B). Staining MCs with antibody recognizing collagen type I showed a typical intracellular staining pattern whereas collagen type IV was mainly localized to the basement membrane (Fig. 1B). MCs also expressed angiotensin II receptors of the AT1 type. p27Kip1 +/+ MCs showed exactly the same staining pattern (data not shown). Taken together, these findings clearly indicate that our cells were of mesangial origin.
Fig. 1A, B.
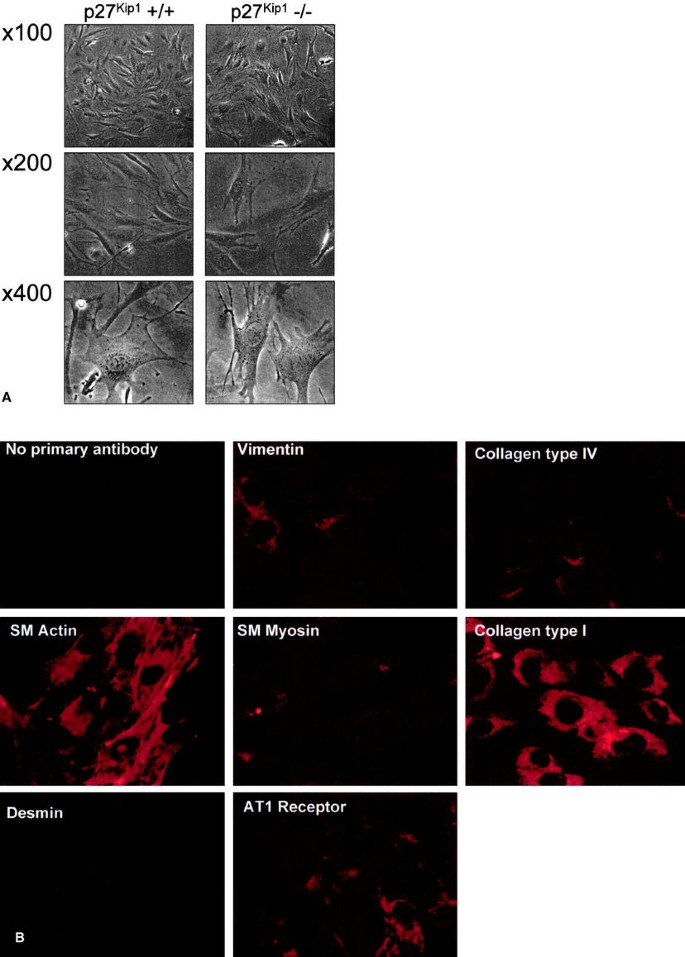
Characterization of mouse mesangial cells. (A) p27Kip1 +/+ and –/– MCs grow in a "stellate" pattern and exhibited many processes. Furthermore, immunohistochemistry exemplarily shown for p27Kip1 –/– MCs revealed a strong postive staining for α-smooth muscle (MC) actin, and a lesser positive staining pattern for the cytoskeletal filaments vimentin and desmin (B). Moreover, an antibody against collagen type I stained MCs in a typical intracellular staining pattern whereas collagen type IV was mainly localized to the basement membrane (B). MCs also expressed angiotensin II receptors of the AT1 type whereas negative controls without primary antibody revealed no specific staining. p27Kip1 ±/± MCs revealed exactly the same staining pattern (data not shown)
High glucose mediates Erk 1,2 activation and hypertrophy
To test the hypothesis that the post-transcriptional increase in p27Kip1 induced by high glucose requires MAPK activation, we began by measuring ERK1,2 activity. Western blots using a phospho-specific anti-Erk1,2 antibody showed phosphorylation of Erk 1,2 after 6 h exposure of high glucose medium in p27Kip1 +/+ and –/– MCs (Fig. 2A,B). Re-probing the Western blot with an antibody to total Erk 1,2 showed equal protein loading.
Fig. 2A, B.
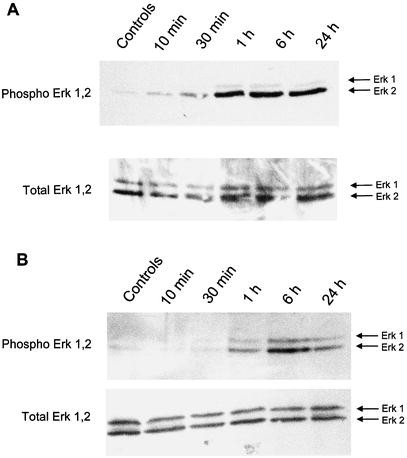
Western blot for Erk 1,2. Incubation of p27Kip1 +/+ (A) and p27Kip1 –/– (B) mesangial cells in high glucose (450 mg/dl, 25 mmol/l) containing medium induced after 6 h phosphorylation of Erk 1,2. Phosphorylation was more pronounced for Erk 2 compared to Erk 1. Phosphorylation of Erk 1,2 occurred earlier and was more sustained in p27Kip1 –/– cells. The Western blot was reprobed with an antibody against total Erk 1,2 indicating that total amount of Erk 1,2 did not change. This blot is representative of three independent experiments with qualitatively similar results
To test whether inhibition of Erk 1,2 modulates high glucose-induced hypertrophy, p27Kip1 +/+ MC were exposed to high glucose serum-free medium in the absence or presence of the MEK1 inhibitor PD98059. Total protein per cell number, a well-established parameter of hypertrophy, was measured. As predicted, exposing mesangial cells to high glucose for 48 h induced hypertrophy. However, co-incubation with 10–5 mol/l PD98059 prevented high glucose-induced hypertrophy (normal glucose:1.37±0.06, normal glucose + PD98059:1.42±0.14, high glucose: 1.74±0.05**, high glucose + PD98059:1.51±0.08 µg protein/103 cells; **p<0.01 vs normal glucose, _n_=6).
MAP kinase phosphorylates p27Kip1
As we showed that an increase in p27Kip1 expression is necessary for glucose-induced hypertrophy of mesangial cells [12] we tested whether Erk 2 directly phosphorylates p27Kip1. This isoform was selected because the increase in Erk 2 was more pronounced than Erk 1 in the presence of high glucose (Fig. 2A,B). Exogenous activated Erk 2 enzyme phosphorylated recombinant mouse p27Kip1 in vitro (Fig. 3A). Amino acid mapping using two-dimensional thin layer electrophoresis showed that serine and threonine, but not tyrosine residues, are phosphorylated by MAP kinase (Fig. 3B).
Fig. 3A–C.
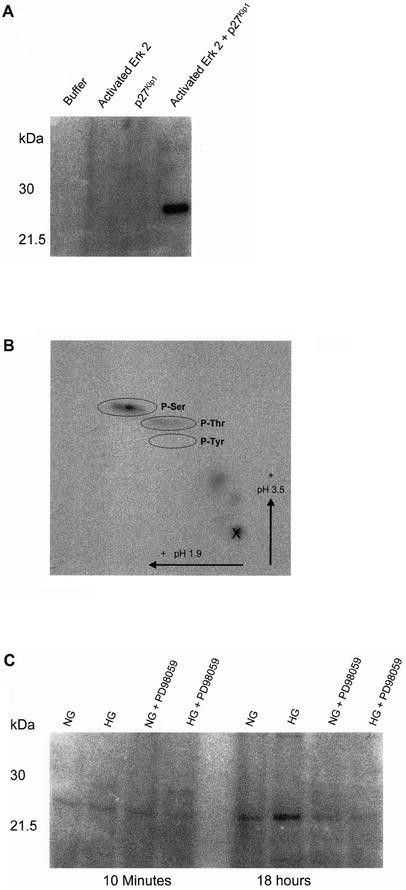
MAP kinase induced phosphorylation of p27Kip1. (A) Recombinant p27Kip1 was expressed and incubated with activated phosphorylated Erk 2 in the presence of [γ-32P]ATP in kinase buffer. Proteins were separated by SDS-polyacrylamide electrophoresis and the autoradiography shows a phosphorylated band at 27 000 Mr. This gel is representative for three independent experiments using different batches of recombinant p27Kip1 and Erk 2. (B) Phospho amino acid mapping. Phosphorylated p27Kip1 was cut out of the gel and treated as described. Phosphopeptide mapping was done with two-dimensional electrophoresis on thin layer chromatographic plates. Non-radioactive phosphorylated amino acids were run as standards in parallel and were detected with ninhydrin. Erk 2 induces serine and threonine, but not tyrosine phosphorylation of p27Kip1. Phosphopeptide mapping was carried out twice with similar results. (C) Phosphorylation of recombinant p27Kip1 by immunoprecipitated Erk 1,2. MCs were incubated for 10 min or 18 h in normal glucose (NG) or high glucose (HG) in the presence and absence of the MEK1 inhibitor PD98059. Total Erk 1,2 was immunoprecipitated and the precipitates were tested whether they could phosphorylate p27Kip1 in vitro. Erk 1,2 immunoprecipitated from mesangial cells grown for 18 h, but not for 10 min in high glucose medium phosphorylate recombinant p27Kip1. This effect was inhibited by the MEK1 kinase inhibitor. This autoradiography is representative for three independent experiments with qualitatively similar results
In order to investigate whether high glucose mediated activation of Erk 1,2 phosphorylate p27Kip1 in vitro, MAP kinases were immunoprecipitated from cells grown in high glucose with an antibody against total Erk 1,2 and immunoprecipitates were used for an in vitro phosphorylation assay of recombinant p27Kip1. Immunoprecipitated complexes containing Erk 1,2 from MCs grown for 18 h, but not for 10 min, in high glucose phosphorylated recombinant p27Kip1 (Fig. 3C). In vitro phosphorylation was prevented when Erk 1,2 was precipitated from cells grown in high glucose medium in the presence of PD98059 (Fig. 3C).
Mutation of serine178 prevents the high glucose-induced expression of p27Kip1
The p27Kip1 protein contains three consensus sites for MAP kinase-induced phosphorylation (serine10, serine178, and threonine187). These amino acids were individually mutated and cloned into an ecdysone-inducible vector system.
p27Kip1 –/– cells were transfected with individual mutant cDNAs and the plasmid pVgRXR encoding subunits of the ecdysone receptor. Transfected cells were exposed to either normal or high glucose for 48 h in the presence of 1 µg/ml muristone, which induced expression. Western blot analysis showed that there was a similar increase in p27Kip1 expression in p27Kip1 +/+ cells and in p27Kip1 –/– MCs transfected with the serine10 and threonine187 mutant p27Kip1 when exposed to high glucose. In contrast glucose did not increase p27Kip1 levels in p27Kip1–/– cells transfected with the serine178 mutant construct (Fig. 4A; wild-type normal glucose:1.00, wild-type high glucose: 3.34±0.7*, serine10 mutant normal glucose: 1.00, serine10 mutant high glucose:2.5±0.3*, serine178 mutant normal glucose:1.00, serine178 mutant high glucose:0.79±0.6, threonine187 mutant normal glucose:1.00, threonine187 mutant high glucose: 2.06±0.6* relative p27Kip1 expression normalized to β-actin, *p<0.05 versus normal glucose, _n_=3). These results show that the increase in p27Kip1 by glucose specifically requires phosphorylation on serine178.
Fig. 4.
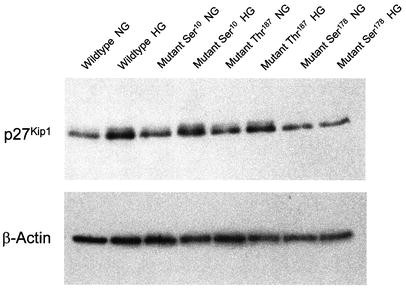
Western blot for p27Kip1. p27Kip1 cDNAs with mutations encoding serine10, serine178, and threonine187 were transfected into p27Kip1 –/– mesangial cells and incubated for 24 h in either normal (NG) or high glucose (HG) with the inducer muristone (1 µg/ml). p27Kip1 +/+ wild-type cells, also treated with muristone, served as controls. High glucose stimulates p27Kip1 expression in wild-type as well as p27Kip1 –/– MCs transfected with serine10 and threonine187, but not serine178 mutants. These blots are representative for three independent experiments
Functional role of serine 178 mutation of p27Kip1 in high glucose-induced hypertrophy
We have previously shown [12] that high glucose inhibits proliferation of p27Kip1 +/+ MCs, but enhances thymidine incorporation in p27Kip1 –/– cells (Fig. 5A). In the current study our results show that reconstitution of p27Kip1 –/– cells with the serine10, and threonine187, but not serine178 mutants reduced thymidine incorporation in cells grown in high glucose, and thus restored the antiproliferative effect of high glucose medium (Fig. 5A). Similar results were shown using cell cycle analysis. High glucose arrested p27Kip1 +/+ cells and p27Kip1 –/– reconstituted with serine10 and threonine187 mutants in the G1 phase of the cell cycle, and this was accompanied by significantly fewer cells progressing into the S-phase. In contrast, in p27Kip1 –/– cells or MCs p27Kip1 –/– transfected with the serine178 mutant, high glucose-stimulated cell cycle progression (Table 1).
Fig. 5A–C.
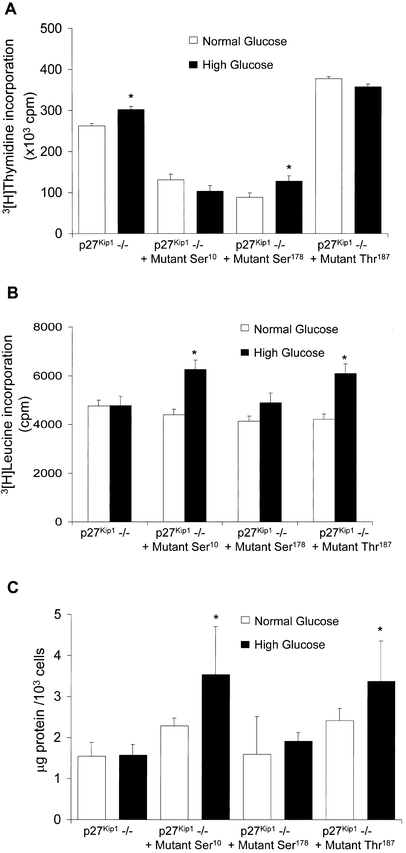
Functional consequences of p27Kip1 mutations. (A) Proliferation measured by 3[H]thymidine incorporation. High glucose medium stimulates proliferation in p27Kip1 –/– MCs and cells transfected with the serine178 mutant. In contrast, high glucose failed to stimulate thymidine incorporation in p27Kip1 –/– cells reconstituted with the serine10 or threonine187. *p<0.01 vs normal glucose, _n_=12. (B) 3[H]leucine incorporation into de novo synthesized proteins. High glucose stimulates de novo protein synthesis in p27Kip1 –/– MCs transfected with the serine10 or threonine187 mutant p27Kip1 expression vectors, but not with the serine178 mutant or untransfected p27Kip1 –/– cells. *p<0.01 vs high glucose, _n_=5. (C) Measurement of the quotient µg protein/cell number as hypertrophy index. p27Kip1 –/– cells reconstituted with p27Kip1 serine10 and threonine187 mutants develop cellular hypertrophy after exposure to high glucose, but not in p27Kip1 –/– cells. The p27Kip1 serine178 mutant failed to reconstitute the hypertrophic phenotype. *p<0.05 vs high glucose, _n_=5
Table 1. Cell cycle analysis
3[H]leucine incorporation, a measure of hypertrophy, was increased by high glucose in p27Kip1 +/+ and p27Kip1 –/– MCs reconstituted with serine10 and threonine187 mutants. In contrast, 3[H]leucine incorporation was not increased in p27Kip1 –/– cells or p27Kip1 –/– cells reconstituted with p27Kip1 mutated at serine178 (Fig. 5B). In addition, calculating µg protein/cell number, a well-established parameter of hypertrophy, also revealed an increase in p27+/+ and p27Kip1 –/– cells reconstituted with serine10 and threonine187 mutants after exposure to high glucose, but not in p27Kip1 –/– cells transfected with at serine178. Again, the serine178 mutant failed to reconstitute the hypertrophic phenotype (Fig. 5C). Finally, we also measured cell size using forward cell scatter. In contrast to p27Kip1 –/– cells that slightly reduced their individual size, high glucose increased cell size in p27Kip1 +/+ MCs. Reconstitution of p27Kip1 (–/–) MCs with serine10 and threonine187 mutants restored the high glucose-induced increase in cell size in p27Kip1 –/– cells. However, the p27Kip1 serine178 mutant was without effect (Table 2). These results show that the hypertrophic and anti-proliferative phenotype induced by high glucose requires phosphorylation of serine178 of p27Kip1.
Table 2. Cell Size (measured by Forward Cell Scatter compared with beads of standard size)
Discussion
High glucose induces G1 phase arrest of cultured mesangial cells with the concomitant development of hypertrophy. We have shown that expression of the CDK-inhibitors p27Kip1 and p21Cip1 are increased by high glucose in mesangial cells in vivo and in vitro [12, 19, 20, 21]. Studies in p27Kip1 –/– and p21Cip1 –/– MCs revealed that these CDK-inhibitors are essential for high glucose-mediated hypertrophy of mesangial cells. Furthermore, treatment of BBdp rats, a model of autoimmune diabetes mellitus Type 1, with angiotensin-converting enzyme inhibitors reduced the glomerular expression of p27Kip1 and this was accompanied by a decrease in renal hypertrophy [20]. In addition, p21Cip1 –/– [21] and p27Kip1 –/– [22] mice are protected to some extent of the development of morphological and functional changes of diabetic nephropathy. These studies clearly show a pivotal role for these specific CDK-inhibitors in the development of glomerular hypertrophy of diabetes mellitus.
The observation that high glucose stimulates p27Kip1 protein expression in MCs without changes in mRNA abundance suggests a probable post-transcriptional regulation of p27Kip1 [10, 12, 19, 23]. Since MAP kinases are activated during diabetic nephropathy, and renal hypertrophy is dependent on MAP kinase activation in other situations [13, 14], in the current study we studied the potential relationship between Erk 1,2 activation and regulation of p27Kip1. Similar to previous studies, we showed Erk 1,2 phosphorylation by high glucose in cultured mesangial cells [13, 14, 24, 25, 26]. The molecular mechanisms underlying high glucose-induced activation of MAP kinases have been recently delineated [27, 28]. Superoxide formation induced by high glucose-mediated activation of the mitochondrial electron-transport chain plays a pivotal role [28]. Excess superoxide inhibits the glycolytic enzyme GAPDH, thereby diverting metabolites from glycolysis into the protein kinase C (PKC) pathway [27, 28]. In turn, stimulation of PKC activates Erk 1,2, partly by inhibiting expression of MAPK phosphatase-1 (MKP-1; 29).
In this study we showed that inhibition of high glucose-induced Erk 1,2 phosphorylation prevented mesangial cell hypertrophy. Accordingly, we asked if Erk 1,2 directly phosphorylates p27Kip1. Our results showed that active Erk 2 directly phosphorylated recombinant p27Kip1 in vitro. Furthermore, Erk 1,2 immunoprecipitated from cells grown in high glucose phosphorylated recombinant p27Kip1, which did not occur when Erk 1,2 was immunoprecipitated from cells grown in medium with normal glucose. Further proof that Erk 1,2 directly phosphorylates p27Kip1 was provided by phospho amino acid mapping. We then mutated the three MAP kinase phosphorylation sites of p27Kip1, and showed that changing the serine178 to alanine prevented glucose-induced p27Kip1 expression. Finally, functional studies showed that serine178 mutation, in contrast to wild-type or serine10, and threonine187 failed to promote high glucose-induced hypertrophy of mesangial cells, showing the role for specific protein phosphorylation in mediating the effect of glucose on mesangial cell growth.
p27Kip1 expression is thought to be regulated by both translational and post-translational mechanisms, and only under very limited circumstances at the level of transcription [23, 30]. The ubiquitin-proteasome pathway of protein degradation is a major factor in regulating p27Kip1 abundance [30]. This is a complex process initiated by CDK2/cyclin E activated phosphorylation of the threonine187 residue [31, 32]. A multienzyme protein, SCFSkp2, complexes with ubiquitin ligase, then binds to phosphorylated p27Kip1 [33]. A critical protein in this complex is Skp2 this assembles the other members of the protein SCFSkp2 complex through the F-box motif, while its C-terminal region binds to the phosphorylated threonine187 of the substrate p27Kip1 [33]. It has been recently discovered that the CDK protein Cks1 is an essential accessory factor for the SCFSkp2 complex [35]. Cks1 apparently promotes allosteric changes of Skp2 so that SCFSkp2 could bind to the phosphorylated threonine187 of p27Kip1. In addition, Cks1 might also facilitate the recruitment of phosphorylated p27Kip1 to the SCFSkp2 complex and stabilizes their interaction [35]. Recent studies suggest that p27Kip1 degradation is differentially regulated in G0/G1 and S/G2 transitions [37, 38]. One study produced mice expressing p27Kip1 in which threonine187 is mutated to alanine. [38] Although these mice were unable to down-regulate p27Kip1 in the S/G2 phase transition because Skp2 can not bind to p27Kip1, p27Kip1 degradation in G1 was unaffected [38]. Thus, this G1 phase proteolytic pathway for p27Kip1 also required Skp2 binding to p27Kip1 but independent of threonine187 phosphorylation.
The effect of MAP kinase activation on expression of CDK inhibitors varies depending on cell type, stimulus and duration of activation. In fibroblasts, activation of MAP kinases leads to an increase in p27Kip1 degradation that is independent of phosphorylation by CDK2/cyclin E [39, 40, 41]. In contrast, a more delayed and prolonged activation of MAP kinases, for example induced in PC12 cells and fibroblasts by nerve growth factor, leads to cell cycle arrest [42]. This effect is associated by an Erk 1,2-dependent increase in the expression of CDK-inhibitors including p27Kip1 [42]. However, the mechanism of this MAP kinase mediated increase in p27Kip1 expression has been not investigated.
In agreement with our findings, it has been previously reported that Erk 1,2 phosphorylates p27Kip1 in vivo and in vitro [39, 43]. Similar to our experiments, others mutated the three serine/threonine kinase consensus sites of p27Kip1 [43]. They found that phosphorylation of serine10 accounted for 70% of the total p27Kip1 phosphorylation [43]. All three p27Kip1 mutants inhibited the kinase activity of CDK2/cyclin E or CDK4/cyclin D2 to a similar extent [43]. The same study provides evidence that phosphorylation of serine10 increased the half-life of p27Kip1 about two-fold by promoting binding to CRM1, a carrier protein for nuclear transport, and facilitating cytoplasmatic export from the nucleus [44]. In this study, nuclear export controlled by serine10 phosphorylation was necessary for p27Kip1 down-regulation and mitogen-induced G0/G1 transition [44]. Others have reported a similar mechanism of serine10 phosphorylation in nuclear export and cell cycle progression, but found no evidence that this phosphorylation increased p27Kip1 expression because serine10 mutants were efficiently recognized by Skp2 [45]. The effect of serine178 phosphorylation on p27Kip1 stability was not investigated in these studies [44, 45].
However, since high glucose mediates cell cycle arrest with an increase in p27Kip1 [10, 12], it is very unlikely that phosphorylation of serine10 which would induce G0/G1-phase progression plays a role in hypertrophy of mesangial cells. Moreover, although one study reported that Erk 1,2 phosphorylates p27Kip1 at serine10 and serine178 in vitro, serine10 was not phosphorylated in vivo [43]. This could very well explain our observation that mutation of serine178 attenuates the high glucose induced increase in p27Kip1 and hypertrophy. Assuming that high glucose-induced activation of Erk 1,2 only phosphorylates serine178 in vivo, it is tempting to assume that phosphorylation of this amino acid might counteract nuclear export transport as mediated by serine10 phosphorylation. As a consequence, less p27Kip1 translocates into the cytoplasm subjected to degradation after binding to Skp2. Alternatively, phosphorylation of serine178 could directly influence binding of p27Kip1 to the SCFSkp2complex by modulating the three dimensional structure of the complex. Further studies are necessary to test these hypothesis. Finally, we have recently observed that under certain conditions cell cycle arrest and hypertrophy are independently regulated by CDK-inhibitors [46]. Transforming growth factor-β still induces G1 phase arrest in p27Kip1 –/– MCs, but not hypertrophy compared to wild-type cells [46]. This observation suggests that p27Kip1 can induce hypertrophy by other, currently unknown mechanisms than cell cycle arrest [46]. Perhaps, phosphorylation of serine178 of p27Kip1 could be important for this cell cycle independent pathway of hypertrophy. However, in our study inhibition of proliferation, hypertrophy, and p27Kip1 expression was closely associated making this a cell cycle independent mechanism of hypertrophy mediated by p27Kip1 less likely.
References
- Bak M, Thomsen K, Christiansen T, Flyvbjerg A (2000) Renal enlargement precedes renal hyperfiltration in early experimental diabetes in rats. J Am Soc Nephrol 11:1287–1292
CAS PubMed Google Scholar - Drummond K, Mauer M (2002) The early natural history of nephropathy in type 1 diabetes. II. Early renal structural changes in type 1 diabetes. Diabetes 51:1580–1587
CAS PubMed Google Scholar - Baumgartl HJ, Sigl G, Banholzer P, Halsbeck M, Standl E (1998) On the prognosis of IDDM patients with larger kidneys. Nephrol Dial Transplant 13:630–634
Article CAS PubMed Google Scholar - Fogo A, Ichikawa I (1991) Evidence for a pathogenic linkage between glomerular hypertrophy and sclerosis. Am J Kidney Dis 17:666–669
CAS PubMed Google Scholar - Wolf G, Ziyadeh FN (1999) Molecular mechanisms of diabetic renal hypertrophy. Kidney Int 56:393–405
Article CAS PubMed Google Scholar - Wolf G, Sharma K, Chen Y, Ericksen M, Ziyadeh FN (1992) High glucose-induced proliferation in mesangial cells is reversed by autocrine TGF-β. Kidney Int 42:647–656
CAS PubMed Google Scholar - Huang HC, Preisig PA (2000). G1 kinases and transforming growth factor-β signaling are associated with a growth pattern switch in diabetes-induced renal growth. Kidney Int 58:162–172
Article CAS PubMed Google Scholar - Cosio FG (1995) Effects of high glucose concentrations on human mesangial cell proliferation. J Am Soc Nephrol 5:1600–1609
CAS PubMed Google Scholar - Kuan CJ, Al-Douahji M, Shankland SJ (1998) The cyclin kinase inhibitor p21WAF1,CIP1 is increased in experimental diabetic nephropathy: potential role in glomerular hypertrophy. J Am Soc Nephrol 9:986–993
CAS PubMed Google Scholar - Wolf G, Schroeder R, Ziyadeh FN, Thaiss F, Zahner G, Stahl RAK (1997) High glucose stimulates expression of p27Kip1 in cultured mouse mesangial cells: relationship to hypertrophy. Am J Physiol 273:348–356
Google Scholar - Wolf G, Schroeder R, Thaiss F, Ziyadeh FN, Helmchen U, Stahl RAK (1998) Glomerular expression of p27Kip1 in diabetic db/db mouse: role of hyperglycemia. Kidney Int 53:869–879
Article CAS PubMed Google Scholar - Wolf G, Schroeder R, Zahner G, Stahl, RAK, Shankland SJ (2001) High glucose-induced hypertrophy of mesangial cells requires p27Kip1, an inhibitor of cyclin-dependent kinases. Am J Pathol 158:1091–1100
CAS PubMed Google Scholar - Wolf G, Haberstroh U, Neilson EG (1992) Angiotensin II stimulates the proliferation and biosynthesis of type I collagen in cultured murine mesangial cells. Am J Pathol 140:95–107
CAS PubMed Google Scholar - Ernest S, Bello-Reus E (1996) Xenobiotic transport differences in mouse mesangial cell clones mdr1 and mdr3. Am J Physiol 270 (Cell Physiol 39):C910–C919
CAS PubMed Google Scholar - Isono M, Iglesias-de la Cruz MC, Chen S, Hong SW, Ziyadeh FN (2000) Extracellular signal-regulated kinase mediates stimulation of TGF-β1 and matrix by high glucose in mesangial cells. J Am Soc Nephrol 11:2222–2230
CAS PubMed Google Scholar - Awazu M, Ishikura K, Hida M, Hoshiya M (1999) Mechanisms of mitogen-activated protein kinase activation in experimental diabetes. J Am Soc Nephrol 10:738–745
CAS PubMed Google Scholar - Müller D, Thieke K, Bürgin A, Dickmanns A, Eilers M (2000) Cyclin E-mediated elimination of p27 requires its interaction with the nuclear pore-associated protein mNPAP60. EMBO J 1119:2168–2180
Article Google Scholar - Boyle WJ, van der Geer P, Hunter T (1991) Phosphopeptide mapping and phosphoamino acid analysis by two-dimensional separation on thin-layer cellulose plates. Methods Enzymol 201:110–149
CAS PubMed Google Scholar - Hannken T, Schroeder R, Zahner G, Stahl RAK, Wolf G (2000) Reactive oxygen species stimulate p44/42 MAP kinase and induce p27Kip1: role in angiotensin II-mediated hypertrophy of proximal tubular cells. J Am Soc Nephrol 11:1387–1397
PubMed Google Scholar - Wolf G, Wenzel U, Ziyadeh, FN, Stahl RAK (1999) ACE-inhibitor treatment reduces glomerular p16INK4 and p27Kip1 expression in diabetic BBdp rats. Diabetologia 42:1425–1432
Article CAS PubMed Google Scholar - Al-Douahji M, Brugarolas J, Brown PA, Stehman-Breen CO, Alpers CE, Shankland SJ (1999) The cyclin kinase inhibitor p21WAF/CIP1 is required for glomerular hypertrophy in experimental diabetic hypertrophy. Kidney Int 56:1691–1699
Article CAS PubMed Google Scholar - Awazu M, Omori S, Ishikura K, Hida M, Fujita H (2003) The lack of cyclin kinase inhibitor p27Kip1 ameliorates progression of diabetic nephropathy. J Am Soc Nephrol 14:699–708
CAS PubMed Google Scholar - Alessandrini A, Chiaur DS, Pagano M (1997) Regulation of the cyclin-dependent kinase inhibitor p27 by degradation and phosphorylation. Leukemia 11:342–345
CAS PubMed Google Scholar - Wilkinson MG, Millar JBA (2000) Control of the eukaryotic cell cycle by MAP kinase signaling pathways. FASEB J 14:2147–2157
CAS PubMed Google Scholar - Tian W, Zhang Z, Cohen DM (2000) MAPK signaling and the kidney. Am J Physiol Renal Physiol 279:F593–F604
CAS PubMed Google Scholar - Ingram AJ, Ly H, Thai K, Kang MJ, Scholey JW (1999) Mesangial cell signaling cascades in response to mechanical strain and glucose. Kidney Int 56:1721–1728
Article CAS PubMed Google Scholar - Brownlee M (2001) Biochemistry and molecular cell biology of diabetic complications. Nature 414:813–820
Google Scholar - Nishikawa T, Edelstein D, Du XL et al. (2000) Normalizing mitochondrial superoxide production blocks three pathways of hyperglycaemic damage. Nature 404:787–790
PubMed Google Scholar - Jacobs D, Glossip D, Xing H, Muslin AJ, Kornfeld K (1999) Multiple docking sites on substrate proteins form a modular system that mediates recognition by ERK MAP kinase. Genes Dev 13:163–175
Article CAS PubMed Google Scholar - Pagano M, Tam SW, Theodoras AM et al. (1995) Role of the ubiquitin-proteasome pathway in regulating abundance of the cyclin-dependent kinase inhibitor p27. Science 269:682–685
CAS PubMed Google Scholar - Sheaff RJ, Groudine M, Gordon M, Roberts JM, Clurman BE (1997) Cyclin E-CDK2 is a regulator of p27Kip1. Genes Dev 11:1464–1478
CAS PubMed Google Scholar - Vlach J, Hennecke S, Amati B (1997) Phosphorylation-dependent degradation of the cyclin-dependent kinase inhibitor p27Kip1. EMBO J 16:5334–5344
Article CAS PubMed Google Scholar - Tsvetkov LM, Yeh KH, Lee SJ, Sun H, Zhang H (1999) p27Kip1 ubiquitination and degradation is regulated by the SCFSkp2 complex through phosphorylated Thr187 in p27. Curr Biol 9:661–664
Article CAS PubMed Google Scholar - Nakayama K, Nagahama H, Minamishima YA et al. (2000) Targeted disruption of Skp2 results in accumulation of cyclin E and p27Kip1, polyploidy and centrosome overduplication. EMBO J 19:2069–2081
Article CAS PubMed Google Scholar - Spruck C, Strohmaier H, Watson M et al. (2001) A CDK-independent function of Cks1: targeting of SCFSkp2 to the CDK inhibitor p27Kip1. Mol Cell 7:639–650
CAS PubMed Google Scholar - Hara T, Kamura T, Nakayama K, Oshikawa K, Hatakeyama S, Nakayama KI (2001) Degradation of p27Kip1 at the G0-G1 transition mediated by a Skp2-independent ubiquitination pathway. J Biol Chem 276:48937–48943
Article CAS PubMed Google Scholar - Shirane M, Harumiya Y, Ishida N et al. (1999) Down-regulation of p27Kip1 by two mechanisms, ubiquitin-mediated degradation and proteolytic processing_._ J Biol Chem 274:13886–13893
Article CAS PubMed Google Scholar - Malek NP, Sundberg H, McGrew S, Nakayama K, Kyriakidis TR, Roberts JM (2001) A mouse knock-in model exposes sequential proteolytic pathways that regulate p27Kip1 in G1 and S phase. Nature 413:323–327
Article CAS PubMed Google Scholar - Kawada M, Yamagoe S, Murakami Y, Suzuki K, Mizuno S, Uehara Y (1997) Induction of p27Kip1 degradation and anchorage independence by Ras through the MAP kinase signaling pathway. Oncogene 15:629–637
CAS PubMed Google Scholar - Delmas C, Manenti S, Boudjelal A, Peyssonnaux C, Eychène A, Darbon JM (2001) The p42/p44 mitogen-activated protein kinase activation triggers p27Kip1 degradation independently of CDK2/cyclin E in NIH 3T3 cells. J Biol Chem 276:34958–34965
Article CAS PubMed Google Scholar - Cheng M, Sexl V, Sherr CJ, Roussel MF (1998) Assembly of cyclin D-dependent kinase and titration of p27Kip1 regulated by mitogen-activated protein kinases kinase (MEK1). Proc Natl Acad Sci USA 95:1091–1096
Article CAS PubMed Google Scholar - Pumiglia KM, Decker SJ (1997) Cell cycle arrest mediated by the MEK/mitogen-activated protein kinase pathway. Proc Natl Acad Sci USA 94:448–452
Article CAS PubMed Google Scholar - Ishida N, Kitagawa M, Hatakeyama S, Nakayama KI (2000) Phosphorylation at serine 10, a major phosphorylation site of p27Kip1, increases its protein stability. J Biol Chem 275:25146–25154
CAS PubMed Google Scholar - Ishida N, Hara T, Kamura T, Yoshida M, Nakayama K, Nakayama KI (2002) Phosphorylation of p27Kip1 on serine 10 is required for its binding to CRM1 and nuclear export. J Biol Chem 277:14355–14358
Article CAS PubMed Google Scholar - Rodier G, Montagnoli A, Di Marcotullio L et al. (2001) p27 cytoplasmic localization is regulated by phosphorylation on Ser10 and is not a prerequisite for its proteolysis. EMBO J 20:6672–6682
Article CAS PubMed Google Scholar - Monkawa T, Hiromura K, Wolf G, Shankland SJ (2002) The hypertrophic effect of transforming growth factor-β is reduced in the absence of cyclin-dependent kinase-inhibitors p21 and p27. J Am Soc Nephrol 13:1172–1178
CAS PubMed Google Scholar