Visceral fat and beta cell function in non-diabetic humans (original) (raw)
Abstract
Aims/hypothesis
Preferential visceral adipose tissue (VAT) accumulation has been clearly associated with insulin resistance. In contrast, the impact of visceral obesity on beta cell function is controversial.
Methods
In 62 non-diabetic women and men (age 24–69 years, BMI 21–39 kg/m2), we measured VAT and subcutaneous adipose tissue (SAT) fat mass by magnetic resonance imaging. We also measured insulin secretion and beta cell function by C-peptide deconvolution and physiological modelling of data from a frequently sampled, 75-g, 3-h OGTT, respectively.
Results
VAT (range 0.1–3.1 kg) was strongly related to sex, age and BMI; SAT was related to sex and BMI. Controlling for sex, age, BMI and SAT by multivariate analysis, excess VAT was associated with a clinical phenotype comprising higher plasma glucose levels, BP, heart rate and serum transaminases. The corresponding metabolic phenotype consisted of insulin resistance (partial _r_=−0.38) and hyperinsulinaemia (partial _r_=0.29). The latter, however, was appropriate for the degree of insulin resistance regardless of obesity and abdominal fat distribution. Moreover, none of the model-derived parameters describing beta cell function (glucose sensitivity, rate sensitivity and potentiation) was independently associated with excess VAT.
Conclusions/interpretation
In non-diabetic Caucasian adults of either sex, preferential visceral fat deposition in itself is part of an insulin-resistant phenotype. The insulin secretory response to a physiological challenge is increased to fully compensate for the insulin resistance, but the dynamics of beta cell function (glucose sensitivity, rate sensitivity and potentiation) are largely preserved.
Introduction
The role of adipose tissue in the regulation of glucose and lipid metabolism is still the focus of intense investigation. Overall adiposity, and visceral adipose tissue (VAT) accumulation in particular, have been clearly associated with the presence of insulin resistance [1], IGT and overt type 2 diabetes [2]. The specific role of visceral adiposity in beta cell function is unclear, however, because it is not easily distinguished from the impact of overall obesity. In normal individuals, as insulin sensitivity (S I) declines [3] or body weight increases [4], the beta cell compensates by secreting more insulin. Moreover, a progressive decline in beta cell function begins within the normal glucose tolerance range [5], and is fully established in IGT [6], independently of obesity. Finally, age is a powerful correlate of VAT accumulation [7] and beta cell function [8]. Thus, any independent effect of VAT excess on beta cell function must be assessed after carefully controlling for potential confounders. Few studies have reported the relationship between abdominal fat and insulin response. In African–American and white children, no independent association could be observed between VAT and either S I or the acute insulin response (AIR) [9] as calculated from a frequently sampled IVGTT (FSIVGTT). Also using the FSIVGTT, a significant positive relationship was reported between VAT and AIR only in glucose-tolerant women [10]; similarly a positive relationship was found in Hispanic children [11]. In contrast, in African–American and Hispanic adults a negative correlation was observed between VAT and AIR after accounting for subcutaneous adipose tissue (SAT) and S I [12]. Finally, a negative association was found between intra-abdominal fat and the disposition index (i.e. the product of S I by AIR on the FSIVGTT), but not AIR alone, in a large group of non-diabetic men and women [13].
The present study was therefore undertaken to investigate—in non-diabetic women and men with different degrees of obesity—the role of VAT in beta cell function. We used magnetic resonance imaging (MRI) to measure abdominal fat volumes, C-peptide deconvolution to measure insulin secretion rates [14] and physiological modelling to derive parameters of beta cell function in response to oral glucose [15].
Subjects, materials and methods
Subjects
From subjects calling at our outpatient clinic, we recruited 62 individuals of both sexes according to the following criteria: (1) absence of diabetes on an OGTT [16]; (2) BMI less than 40 kg/m2; (3) absence of metabolic or non-metabolic diseases (except untreated essential hypertension, see below); and (4) no treatment with drugs known to affect glucose tolerance. Using the sex-specific median BMI value of the whole cohort (26.9 in women and 27.3 in men), 30 subjects were classified as non-obese and 32 as obese. The study protocol was approved by the Institutional Review Board of the University of Pisa and all subjects gave informed consent to the study.
Study design
All subjects received a 3-h OGTT (75 g) with frequent blood sampling (at 0, 15, 30, 45, 60, 90, 120, 150 and 180 min), and had abdominal subcutaneous and visceral fat content quantified by MRI.
Anthropometric measurements
The WHR was determined by measuring the waist circumference at the umbilicus and the hip circumference in a horizontal plane at the level of the maximal extension of the buttocks. Fat-free mass was measured by electrical bioimpedance (Tanita, Tokyo, Japan); fat mass was calculated as the difference between body weight and fat-free mass. After an overnight (10–14 h) fast and a 30-min acclimatisation period, arterial BP was measured three times to the nearest 2 mmHg in the sitting position using appropriately sized cuffs, and the mean of the two closest values was recorded. Heart rate was also recorded on this occasion.
Abdominal fat distribution
Abdominal visceral and subcutaneous fat depots were measured by MRI, using imaging procedures that have been described previously [17]. Briefly, images were acquired on a GE Sigma Horizon LX System 1.5 T scanner using a body coil. A sagittal localising image was used to centre transverse sections on the line through the space between L4 and L5. Thirty-two transverse, T1-weighted, 256×256 images (TR=135, TE=4.2, flip angle=90°, FOV=50 cm, pixel size 1.875×1.875 mm) were acquired in breath-hold with a slice thickness of 5 mm and no overlap. Images were transferred to a dedicated workstation and analysed by a manual procedure coupled with an automatic analysis using an ad-hoc developed software [18]. The SAT area was analysed by selecting the outer and inner margins of SAT as the region of interest from the cross-sectional images and by counting the number of pixels between the outer and inner margins of SAT. The VAT area was determined using histograms specific to the visceral regions [18]. The histograms were summed over the range of pixel values designated as fat by fitting two normal analysis distribution curves to them. SAT and VAT volumes were calculated by summing the 32 slice areas multiplied by the slice thickness (0.5 cm). Volumes were converted to mass units (kg) by multiplying the volumes by the assumed constant density of 0.92 [19].
Metabolic measurements
All metabolic tests were performed in the morning (0800 hours) after a 10 to 12-h overnight fast. For the OGTT, timed blood samples were collected for the measurement of plasma glucose, NEFA, C-peptide and insulin concentrations. Plasma glucose was measured by the glucose oxidase reaction (Beckman Glucose Analyzer, Fullerton, CA, USA). Plasma insulin, C-peptide, leptin and adiponectin concentrations were measured by RIA using specific kits (Linco Research, St Louis, MO, USA). Serum NEFA was measured spectrophotometrically (Wako, Neuss, Germany). Serum transaminases (alanine aminotransferase [ALT] and aspartate aminotransferase [AST]) and the serum lipid profile were determined by standard laboratory methods.
S I was assessed by the OGIS method [20], which estimates S I during a euglycaemic insulin clamp from the plasma glucose and insulin profiles measured during the OGTT. This estimate has been validated against the euglycaemic insulin clamp technique in normal, obese and diabetic subjects.
Beta cell function
Insulin secretion rates were calculated from plasma C-peptide concentrations by deconvolution [14], as previously described [5]. Parameters of beta cell function were derived from mathematical analysis of plasma glucose and C-peptide concentrations during the OGTT, according to a previously developed model [15]. According to this approach, glucose-stimulated insulin secretion is the sum of two components. The first is proportional to the rate of change of plasma glucose concentration during the OGTT and this component is denoted as beta cell rate sensitivity. The second component represents the dependence of insulin secretion on the absolute glucose concentration at any time point, and is characterised by a dose–response function relating time and glucose concentration; the mean slope of this dose–response relationship is denoted as beta cell glucose sensitivity. The dose–response relationship is modulated by a third factor, termed the potentiation factor, which incorporates glucose-mediated and non-glucose-mediated potentiation, i.e. by non-glucose substrates and gastrointestinal hormones. The potentiation parameter used for the present analysis is the ratio of the potentiation factor at the end of the OGTT (160–180 min) to the one at the beginning of the OGTT (0–20 min). The insulinogenic index (ΔI:ΔG30) was calculated as the ratio of the plasma insulin increment to the plasma glucose increment above baseline at 30 min into the OGTT. AUCs for glucose (AUCG), NEFA (AUCNEFA) and insulin (AUCI) concentration curves were calculated by the trapezoidal rule.
Statistical analysis
Data are given as the means±SEM; insulin parameters are expressed as median and interquartile range (in square brackets) due to their skewed distribution. Group differences according to obesity and abdominal fat distribution were analysed by two-way ANOVA using log-transformed values of non-normally distributed variables. These analyses included the statistical significance of the two independent factors (obesity and abdominal fat distribution) and their interaction. The contribution of multiple factors to fat distribution was assessed by multivariate analysis; for this analysis, variables with skewed distribution were log-transformed. A p value of ≤0.05 was considered significant.
Results
Abdominal fat distribution
In the whole group, total fat mass in the scanned abdominal volume averaged 4.9±0.2 kg, or 21±4% of total fat mass. Within the abdominal volume, VAT averaged 1.2±0.1 kg and SAT 3.7±0.2 kg. VAT, but not SAT, was strongly related to age, independently of sex (_r_=0.52, p<0.0001). Both VAT and SAT were strongly related to BMI in men and women alike; at each BMI value, VAT was higher in men than in women (p<0.01 adjusted by BMI), while the converse was true for SAT (p<0.0001) (Fig. 1). When using the ratio of VAT to SAT as an index of fat partition in the abdominal region, in either sex the relationship between VAT/SAT and BMI was rather flat, albeit still significantly different from zero (p<0.03 adjusted by sex) (Fig. 1). The study group was therefore stratified by obesity (as defined in Subjects, methods and materials) as well as by relative abdominal fat distribution by using the sex-specific median VAT:SAT ratio (0.18 in women and 0.41 in men).
Fig. 1
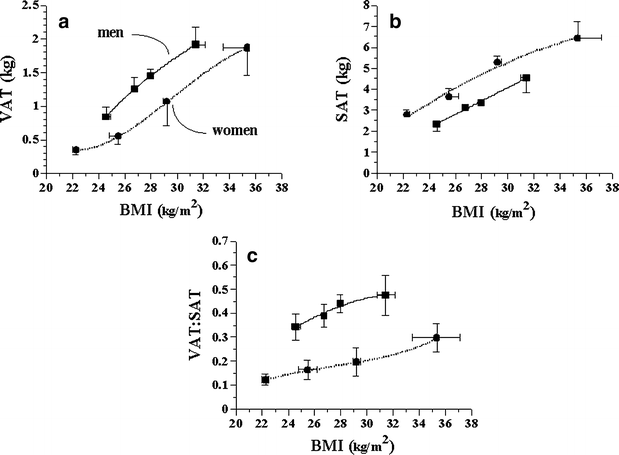
Relationship between BMI (quartiles) and (a) VAT, (b) SAT and (c) their ratio (VAT:SAT) in men and women. Points are means±SEM
Clinical and metabolic phenotype
Independently of obesity, preferential visceral fat distribution was associated with older age (Table 1), increased prevalence of impaired glucose tolerance and a trend towards an increased prevalence of hypertension, dyslipidaemia (a trend towards higher serum triglycerides and higher LDL-cholesterol concentrations), higher BP levels and raised serum AST concentrations (Table 2). The metabolic picture of visceral obesity (Table 3) comprised higher fasting plasma glucose levels and greater glucose response to oral glucose. S I was impaired in subjects with higher VAT:SAT ratio after allowing for obesity.
Table 1 Anthropometric characteristics
Table 2 Clinical phenotype
Table 3 Metabolic characteristics
Beta cell function
Basal and total insulin secretion were higher in obese than non-obese subjects (each by ∼40%), as expected; total insulin output tended to be further elevated in subjects with a higher VAT:SAT ratio. In contrast, the dynamic parameters of beta cell function, i.e. glucose sensitivity and rate sensitivity, were similar in obese and non-obese subjects. Furthermore, neither glucose sensitivity nor rate sensitivity was significantly associated with visceral fat accumulation. The potentiation factor was modestly increased in viscerally obese subjects. The insulinogenic index was not significantly associated with either obesity or abdominal fat distribution.
The incremental plasma insulin response at 30 min (Fig. 2) and the total insulin output during the OGTT (Fig. 3) were both inversely related to S I in a curvilinear fashion, with non-obese and obese subjects, with a higher or lower VAT:SAT ratio, falling on a single regression line. In contrast, neither glucose sensitivity nor rate sensitivity was related to S I, regardless of obesity or visceral fat accumulation.
Fig. 2
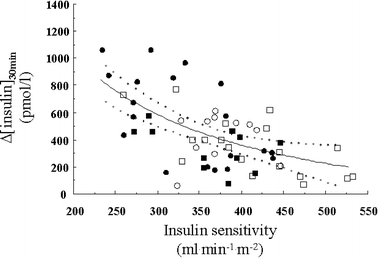
Reciprocal association between insulin sensitivity and the incremental insulin response at 30 min into the OGTT. The dotted lines enclose the 95% CI of the fit. Non-obese (squares) and obese (circles) individuals with low (empty symbols) or high (filled symbols) VAT:SAT ratios (as per Table 1) are plotted. _r_=−0.50; p<0.0001
Fig. 3
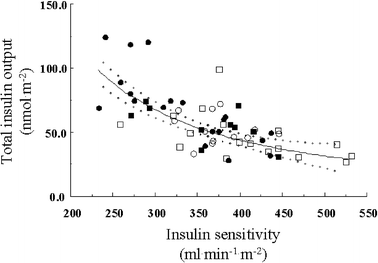
Reciprocal association between insulin sensitivity and the total insulin output during the OGTT. The dotted lines enclose the 95% CI of the fit. Non-obese (squares) and obese (circles) individuals with low (empty symbols) or high (filled symbols) VAT:SAT ratios (as per Table 1) are plotted. _r_=−0.68; p<0.0001
Correlations
In univariate analysis, serum adiponectin levels were inversely related to S I (_r_=−0.30, _p_=0.02) and to VAT (_r_=−0.32, _p_=0.01) but not to SAT. Because of the close interrelationships of VAT and SAT with sex, age and obesity (Fig. 1), we tested the independent association of SAT and VAT with the clinical characteristics and the metabolic parameters by multivariate analysis (adjusting by sex, age and BMI). The results (Table 4) show that a higher VAT mass was associated with hyperinsulinaemia (as fasting insulin, AUCI and ΔI:ΔG30), insulin hypersecretion (as the total insulin secretory response to glucose), hyperleptinaemia, insulin resistance and a higher heart rate. The pattern of associations of SAT was similar (except for heart rate). Further adjustment of VAT for SAT generally weakened these associations without changing their pattern. Relative fat distribution within the abdominal area—as the VAT:SAT ratio—remained significantly associated with insulin resistance, hyperleptinaemia and features of the clinical phenotype (higher fasting glucose, transaminases and heart rate).
Table 4 Associations of abdominal fat depots with clinical and metabolic variables
Discussion
Within the scanned abdominal volume, which possibly encompasses roughly one-half of the entire abdominal region between the upper edge of the liver and the pelvis [21], VAT represented about one-quarter of total fat. As expected, VAT increased with age and BMI; at any given BMI, VAT (which ranged from 0.1 to 3.1 kg) was greater in men than women while the reverse was true for SAT.
Upon stratifying our cohort of non-diabetic subjects by overall obesity and abdominal visceral fat accumulation, we found that the clinical phenotype specifically associated with visceral obesity comprised higher prevalence of IGT, higher BP and heart rate, and higher plasma concentrations of LDL-cholesterol, triglycerides and transaminases, i.e. a metabolic syndrome phenotype [22].
The major finding concerned beta cell function. Fasting plasma insulin concentrations and insulin secretion rates were elevated in association with obesity as were post-challenge insulin levels and total insulin output (Table 3). However, none of the dynamic indices of beta cell function, neither the empirical ones, like the incremental insulin response at 30 min into the OGTT or the insulinogenic index (ΔI:ΔG30), nor the ones derived from physiological modelling, i.e. glucose sensitivity, rate sensitivity and potentiation, was altered in obese or abdominal obese subjects. Thus, beta cell activity was enhanced in terms of amounts of hormone released under basal conditions or in response to glucose stimulation, but the dynamics of insulin response to rapid (within 3 h) changes in glucose concentration were preserved even in the face of insulin resistance. This conclusion was confirmed by multivariate analysis of the whole dataset (Table 4): after controlling for sex, age and BMI (model 1), or further adjusting also for SAT (model 2), the mass of visceral fat was independently associated with insulin resistance and compensatory hyperinsulinaemia, but had no effect on the other parameters of beta cell function. In the context of the controversial results in the literature [9–13], this conclusion needs specification and explanation.
Firstly, it is important to emphasise that our study subjects were adult Caucasian women and men without diabetes; clearly, results might differ in subjects with markedly impaired beta cell function, or with a different ethnic background (e.g. [12]). Also, none of our subjects was morbidly obese and only 16 of them had a VAT area at L4/L5 greater than 100 cm2, a value that has been often related to pathological conditions [22]. Thus, we cannot exclude that different results may be obtained in subjects with higher VAT areas.
Secondly, we have argued [23] that beta cell function can be described under two broad categories: tonic insulin secretion (i.e. basal insulin release) and phasic insulin secretion (the timed release of insulin in response to stimulation). The latter has characteristics that were first discovered in the isolated perfused pancreas and later confirmed in vivo in humans: anticipated rise in insulin secretion in response to glucose rate-of-change, direct dependence of insulin secretion on glucose concentration (or glucose dose–response), and time dependence (higher secretion at the end than at the beginning of the OGTT for similar glucose levels). The mathematical model we employed resolves these phenomena in terms of rate sensitivity, glucose sensitivity and potentiation from a physiological challenge such as the OGTT. As previously shown, the dynamic properties of the beta cell are key determinants of oral glucose tolerance [5, 6], while insulin resistance, primary or secondary to obesity, feeds back to the beta cell by enhancing its tone or set point. In line with this general view of beta cell function, when we plotted S I against absolute measures of insulin secretion (such as the 30-min increment in plasma insulin levels or the total post-OGTT insulin output), we found the expected reciprocal curvilinear association (described as a hyperbola [24]), with obese and non-obese subjects falling essentially along the same regression line (Figs. 2 and 3). Equivalently, if we calculated a disposition index by multiplying S I by some measure of absolute insulin response, we did not find significant differences between obese and non-obese subjects (data not shown). Thus, in our study subjects beta cell compensation for insulin resistance was present in the form of ‘matched’ hypersecretion (tonic activity), with no impairment in the ability of the beta cell to cope with changing glucose levels (phasic activity).
Our results are in part at variance with those previously reported [13] in subjects who, like ours, were non-diabetic Caucasian women and men with a broad range of BMI. In that group, the authors found positive independent associations between intra-abdominal fat (as measured by single-slice computed tomography) and S I or AIR, but a negative, if weak (_r_=0.20), association with the disposition index. This discrepancy might be explained by the fact that a quarter of the subjects in that study were over 60 years of age (vs only four subjects in the present study). Perhaps more importantly, that study used i.v. glucose whereas we adopted the OGTT: the beta cell may respond in a qualitatively different manner to i.v. and oral glucose as the correlation between the response to the two stimuli is modest [23].
A recent formulation of the lipotoxicity theory [25] postulates that excessive fatty substrate delivery, when coupled with hyperglycaemia, can impair beta cell function. Consequences of excess VAT—which is relatively resistant to the antilipolytic effect of insulin [26]—are an enhanced release of NEFA into the portal circulation and upregulation of genes antagonising hepatic insulin effects [27]. Could VAT accumulation be a determinant of beta cell dysfunction via excess NEFA supply? In the current data, the NEFA response to oral glucose was reciprocally related to S I (_r_=0.30, _p_=0.02), but was not independently related to VAT or VAT:SAT ratio. Moreover, a recent study using isotope dilution/hepatic vein catheterisation techniques [28] has shown that the contribution of even an expanded VAT depot to systemic NEFA levels (those that bathe islets) is quite small. Thus, unless VAT is hugely expanded or is constantly releasing some cytokine(s) specifically toxic to beta cells over the long term, our results do not support the hypothesis that visceral adiposity itself is a cause of beta cell dysfunction.
Abbreviations
AIR:
acute insulin response
ALT:
alanine aminotransferase
AST:
aspartate aminotransferase
AUCG :
AUC for glucose concentration curve
AUCI :
AUC for insulin concentration curve
AUCNEFA :
AUC for NEFA concentration curve
FSIVGTT:
frequently sampled IVGTT
MRI:
magnetic resonance imaging
SAT:
subcutaneous adipose tissue
S I :
insulin sensitivity
VAT:
visceral adipose tissue
References
- Despres JP (1998) The insulin resistance-dyslipidemic syndrome of visceral obesity: effect on patients’ risk. Obes Res 16(Suppl 1):8S–17S
Google Scholar - Goodpaster BH, Krishnaswami S, Resnick H et al (2003) Association between regional adipose tissue distribution and both type 2 diabetes and impaired glucose tolerance in elderly men and women. Diabetes Care 26:372–379
PubMed Google Scholar - Kahn SE (2003) The relative contributions of insulin resistance and beta-cell dysfunction to the pathophysiology of type 2 diabetes. Diabetologia 46:3–19
PubMed Google Scholar - Ferrannini E, Camastra S, Gastaldelli A et al (2004) Beta-cell function in obesity: effects of weight loss. Diabetes 53(Suppl 3):S26–S33
Google Scholar - Ferrannini E, Gastaldelli A, Miyazaki Y, Matsuda M, Mari A, De Fronzo RA (2005) Beta-cell function in subjects spanning the range from normal glucose tolerance to overt diabetes: a new analysis. J Clin Endocrinol Metab 90:493–500
PubMed Google Scholar - Ferrannini E, Gastaldelli A, Miyazaki Y et al (2003) Predominant role of reduced beta-cell sensitivity to glucose over insulin resistance in impaired glucose tolerance. Diabetologia 46:1211–1219
PubMed Google Scholar - Kohrt WM, Kirwan JP, Staten MA, Bourey RE, King DS, Holloszy JO (1993) Insulin resistance in aging is related to abdominal obesity. Diabetes 42:273–281
PubMed Google Scholar - Iozzo P, Beck-Nielsen H, Laakso M, Smith U, Yki-Jarvinen H, Ferrannini E (1999) Independent influence of age on basal insulin secretion in nondiabetic humans. European group for the study of insulin resistance. J Clin Endocrinol Metab 84:863–868
PubMed Google Scholar - Goran MI, Bergman RN, Gower BA (2001) Influence of total vs. visceral fat on insulin action and secretion in African American and white children. Obes Res 9:423–431
PubMed Google Scholar - Sumner AE, Farmer NM, Cochran CS et al (2001) Obese premenopausal African–American women with normal and impaired glucose tolerance have a similar degree of insulin resistance but differ in beta-cell function. Diabetes Care 24:1978–1983
PubMed Google Scholar - Cruz ML, Bergman RN, Goran MI (2002) Unique effect of visceral fat on insulin sensitivity in obese Hispanic children with a family history of type 2 diabetes. Diabetes Care 25:1631–1636
PubMed Google Scholar - Wagenknecht LE, Langefeld CD, Scherzinger AL et al (2003) Insulin sensitivity, insulin secretion, and abdominal fat. The Insulin Resistance Atherosclerosis Study (IRAS) family study. Diabetes 52:2490–2496
PubMed Google Scholar - Utzschneider KM, Carr DB, Hull RL et al (2004) Impact of intra-abdominal fat and age on insulin sensitivity and beta-cell function. Diabetes 53:2867–2872
PubMed Google Scholar - Van Cauter E, Mestrez F, Sturis J, Polonsky KS (1992) Estimation of insulin secretion rates from C-peptide levels. Comparison of individual and standard kinetic parameters for C-peptide clearance. Diabetes 41:368–377
PubMed Google Scholar - Mari A, Schmitz O, Gastaldelli A, Oestergaard T, Nyholm B, Ferrannini E (2002) Meal and oral glucose tests for assessment of beta-cell function: modeling analysis in normal subjects. Am J Physiol Endocrinol Metab 283:E1159–E1166
PubMed Google Scholar - Gabir MM, Hanson RL, Dabelea D et al (2000) The 1997 American Diabetes Association and 1999 World Health Organization criteria for hyperglycemia in the diagnosis and prediction of diabetes. Diabetes Care 23:1108–1112
PubMed Google Scholar - Ross R, Leger L, Morris D, de Guise J, Guardo R (1992) Quantification of adipose tissue by MRI: relationship with anthropometric variables. J Appl Physiol 72:787–795
PubMed Google Scholar - Positano V, Gastaldelli A, Sironi AM, Santarelli MF, Lombardi M, Landini L (2004) An accurate and robust method for unsupervised assessment of abdominal fat by MRI. J Magn Reson Imaging 20:684–689
PubMed Google Scholar - Snyder W, Cooke M, Mnassett E, Larhansen L, Howells G, Tipton I (1975) Report of the task group on reference man. Pergamon Press, Oxford
Google Scholar - Mari A, Pacini G, Murphy E, Ludvik B, Nolan JJ (2001) A model-based method for assessing insulin sensitivity from the oral glucose tolerance test. Diabetes Care 24:539–548
PubMed Google Scholar - Kobayashi J, Tadokoro N, Watanabe M, Shinomiya M (2002) A novel method of measuring intra-abdominal fat volume using helical computed tomography. Int J Obes Relat Metab Disord 26:398–402
PubMed Google Scholar - Wajchenberg BL (2000) Subcutaneous and visceral adipose tissue: their relation to the metabolic syndrome. Endocr Rev 21:697–738
PubMed Google Scholar - Ferrannini E, Mari A (2004) Beta cell function and its relation to insulin action in humans: a critical appraisal. Diabetologia 47:943–956
PubMed Google Scholar - Kahn SE (2003) The relative contributions of insulin resistance and beta-cell dysfunction to the pathophysiology of type 2 diabetes. Diabetologia 46:3–19
PubMed Google Scholar - Robertson RP, Harmon J, Tran PO, Poitout V (2004) Beta-cell glucose toxicity, lipotoxicity, and chronic oxidative stress in type 2 diabetes. Diabetes 53(Suppl 1):S119–S124
PubMed Google Scholar - Wajchenberg BL, Giannella-Neto D, Da Silva ME, Santos RF (2002) Depot-specific hormonal characteristics of subcutaneous and visceral adipose tissue and their relation to the metabolic syndrome. Horm Metab Res 34:616–621
PubMed Google Scholar - Kabir M, Catalano KJ, Ananthnarayan S et al (2005) Molecular evidence supporting the portal theory: a causative link between visceral adiposity and hepatic insulin resistance. Am J Physiol Endocrinol Metab 288:E454–E461
Article Google Scholar - Nielsen S, Guo Z, Johnson CM, Hensrud DD, Jensen MD (2004) Splanchnic lipolysis in human obesity. J Clin Invest 113:1582–1588
PubMed Google Scholar
Acknowledgements
This work was supported by funding from an EFSD-Novo Nordisk Type 2 Programme Focused Research Grant, and funds from the Italian Ministry of University and Scientific Research (MURST prot. 2001065883_001).
Author information
Authors and Affiliations
- CNR Institute of Clinical Physiology, University of Pisa School of Medicine, Pisa, Italy
A. Gastaldelli, A. M. Sironi, D. Ciociaro, V. Positano, E. Buzzigoli, D. Giannessi, M. Lombardi & E. Ferrannini - CNR Institute of Biomedical Engineering, Padua, Italy
A. Mari - Department of Internal Medicine, University of Pisa School of Medicine, Pisa, Italy
E. Ferrannini
Authors
- A. Gastaldelli
- A. M. Sironi
- D. Ciociaro
- V. Positano
- E. Buzzigoli
- D. Giannessi
- M. Lombardi
- A. Mari
- E. Ferrannini
Corresponding author
Correspondence toA. Gastaldelli.
Rights and permissions
About this article
Cite this article
Gastaldelli, A., Sironi, A.M., Ciociaro, D. et al. Visceral fat and beta cell function in non-diabetic humans.Diabetologia 48, 2090–2096 (2005). https://doi.org/10.1007/s00125-005-1891-3
- Received: 19 January 2005
- Accepted: 01 May 2005
- Published: 06 August 2005
- Issue date: October 2005
- DOI: https://doi.org/10.1007/s00125-005-1891-3