Distinct patterns of tissue-specific lipid accumulation during the induction of insulin resistance in mice by high-fat feeding (original) (raw)
Introduction
Insulin resistance is a key metabolic defect associated with obesity and type 2 diabetes. Despite intense research in this area, the exact molecular pathways underlying the pathogenesis of insulin resistance are not fully resolved. Many studies have reported overactivation of stress-related and inflammatory pathways in the adipose tissue, liver and skeletal muscle of insulin-resistant humans and rodents [1, 2], but whether these factors are mediators or consequences of insulin resistance remains unclear. Extensive evidence also links defects in fatty acid (FA) metabolism and insulin resistance, with a strong association between excess lipid accumulation in non-adipose tissues and impaired insulin action [3, 4].
Lipids are present in many different forms within cells and though elevated intracellular triacylglycerol (TG) levels are a marker of disordered FA metabolism, it is generally accepted that bioactive lipid intermediates induce insulin resistance. Diacylglycerols (DGs) have been proposed to impair insulin action by activating protein kinase C isoforms and antagonising insulin signalling [5]. Elevated DGs in muscle and liver are associated with insulin resistance in humans [5, 6] and animals [7, 8]. Genetic manipulations in rodents that alter DG levels also support a role for this lipid intermediate as an important mediator of insulin action [9–11].
Ceramides are another lipid metabolite capable of causing insulin resistance by reducing the activation of Akt by insulin [12] and/or activating c-jun amino terminal kinase (JNK) [13]. Ceramide is increased in tissues of insulin-resistant humans and rodents [8, 13, 14] and reduction of ceramide levels is associated with improved insulin sensitivity [13, 15, 16]. Importantly, though many studies have demonstrated a link between insulin resistance and levels of DG and ceramides, there are also several instances where alterations in insulin action and bioactive lipid content in tissues do not correlate and thus there is still substantial controversy in this area [8, 17, 18].
Our understanding of the role that lipids and other factors play in the development of insulin resistance have been greatly enhanced by studies in rodents fed a high-fat diet (HFD). Rodent models provide the capacity to tightly manipulate dietary constituents and also allow access to tissues that cannot be readily studied in humans. However, there is great heterogeneity in the experimental design of HFD studies, with differing amounts of fat used (e.g. 40–60% of total energy intake) and also large variation in the type of dietary FAs used (e.g. lard vs safflower oil). Another critical issue is the timing of the HFD. Many groups feed animals for 12–16 weeks to elicit marked differences in body and fat mass, but as it has been reported that insulin resistance is induced rapidly (1–3 weeks) in different tissues on exposure to excess dietary fat [7, 19–21], the mechanisms/factors that have been proposed to underlie insulin resistance and glucose intolerance in long-term studies may be different from those occurring in short-term studies and a consequence of chronic obesity and/or hyperinsulinaemia.
In this study we have performed a detailed examination of the temporal development of insulin resistance in individual tissues in high-fat-fed mice. Our goal was to examine some of the factors that have been proposed to mediate insulin resistance in a number of tissues, with a particular focus on profiling changes in lipid species that occur in different tissues when they first display insulin resistance. We hypothesised that the development of insulin resistance in liver, muscle and adipose tissue would be associated with bioactive lipid accumulation and would precede any inflammatory response.
Methods
Animals
Male C57Bl/6 mice, 8–12 weeks old, were obtained from the Animal Resources Centre (Perth, WA, Australia) or were bred in-house (AMREP Animal Services, Melbourne, VIC, Australia). Mice were maintained at 22 ± 1°C on a 12/12 h light/dark cycle, with free access to food and water. Mice at the Garvan Institute were fed ad libitum with either a rodent chow diet (8% energy from fat; Gordon’s Specialty Stock Feeds, Yanderra, NSW, Australia), or HFD (45% energy from fat) made in-house as described elsewhere [22] for 3 days–12 weeks. Mice at the Baker IDI Heart and Diabetes Institute were fed chow (5% energy from fat, Specialty Feeds, Glen Forrest, WA, Australia) or an HFD (42% energy from fat, Specialty Feeds) for 1, 3, 6 or 16 weeks. All procedures were approved by the Garvan Institute/St Vincent’s Hospital Animal Experimentation Ethics Committee or the AMREP Animal Ethics Committee and were performed in accordance with the National Health and Medical Research Council of Australia Guidelines on Animal Experimentation.
Body composition analysis
Fat mass was determined using the EchoMRI 4-in-1 (Echo Medical Systems, Houston, TX, USA).
Glucose tolerance
Glucose tolerance tests (2 g/kg glucose i.p.) were performed in mice fasted for 6 h. Blood was obtained from the tail tip at the indicated times and glucose measured using a glucometer (Accu-Check, Roche, NSW, Australia).
Hyperinsulinaemic–euglycaemic clamp
Hyperinsulinaemic–euglycaemic clamp studies were performed in mice 4 days after catheterisation. Details of the surgical procedures, insulin clamp and the determination of plasma and tissue radioactivity are described elsewhere [13].
Plasma analysis
Plasma insulin was measured by ELISA (Millipore, St Louis, MO, USA). NEFA were measured spectrophotometrically by an enzymatic colorimetric assay (NEFA C Kit; Wako Chemicals, Richmond, VA, USA).
Lipid analysis
Tissue lipids were extracted and TG, DG, ceramide and sphingomyelin content was determined by colorimetric assays and electrospray ionisation–tandem mass spectrometry, as described elsewhere [13].
Quantitative real-time RT-PCR
RNA was isolated from liver, skeletal muscle and epididymal adipose tissue using Trizol (Invitrogen, Carlsbad, CA, USA). Samples were reverse transcribed using TaqMan reverse transcription reagents (Applied Biosystems, Foster City, CA, USA). Gene expression analysis was performed by RT-PCR using TaqMan gene expression assays (Applied Biosystems), including an 18S probe and primers for housekeeping measurements.
Immunohistochemistry
Epididymal adipose tissue was fixed overnight in 4% wt/vol. paraformaldehyde and embedded in paraffin. Sections (4 μm) were cut, deparaffinised and rehydrated in histoline and ethanol. Sections were boiled in sodium citrate buffer, blocked in 3% vol./vol. H2O2, incubated in F4/80 antibody (1:100 dilution; AbD Serotec, Kidlington, UK) overnight at 4°C using an M.O.M. Immunodetection Kit (Vector Laboratories, Burlingame, CA, USA), incubated with biotinylated anti-rat IgG and then with avidin–biotin peroxidase complex and 3,3′-diaminobenzidine (DAB) peroxidase substrate (Vector Laboratories). Sections were stained with Mayer’s haematoxylin and dehydrated. The number of crown-like structures per field was counted.
Western blotting
Tissues were lysed and protein concentration determined. Lysates (40 μg protein) were resolved by SDS-PAGE, transferred to membranes and immunoblotting was performed as described elsewhere [13].
Statistics
All data are presented as mean±SEM. Data were analysed by Student’s t test, one-way ANOVA or factorial ANOVA where appropriate. For the ANOVA procedures, Newman–Keuls post-hoc tests were used to establish differences between groups. Statistical significance was set at p < 0.05.
Results
Rapid development of glucose intolerance with high-fat feeding
In initial studies, mice were fed an HFD for 3 days–12 weeks to determine when glucose intolerance developed. Body mass was similar between chow-fed and HFD mice until 5 weeks, with significant divergence between the groups observed thereafter (Fig. 1a). Epididymal fat pad mass was increased by 3 days of the HFD and was not further increased until 12 weeks of HFD (Fig. 1b). Glucose intolerance was evident after only 3 days of HFD, and interestingly did not become significantly worse with the HFD in the period to 12 weeks (Fig. 1c). Independent studies performed in a different biological animal research facility, using a commercially available HFD, verified these findings. These additional studies also demonstrated that glucose intolerance developed after 1 week of HFD and did not deteriorate further in the period to 12 weeks of HFD (electronic supplementary material [ESM] Fig. 1).
Fig. 1
The temporal development of obesity and glucose intolerance in fat-fed mice. (a) Body mass; (b) epididymal fat mass; and (c) glucose tolerance AUC in chow- and fat-fed mice. Data are mean±SEM. White bars, chow-fed mice; black bars, fat-fed mice. * p < 0.05 vs chow at same time point; † p < 0.01 vs chow at same time point. n = 5–16. BM, body mass
Basal metabolic characteristics
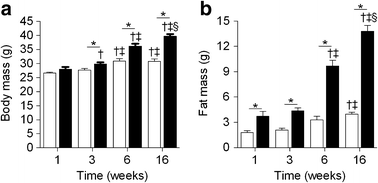
To gain insight into the development of insulin resistance in specific insulin-responsive tissues, hyperinsulinaemic–euglycaemic clamp studies were performed at the Baker IDI Heart and Diabetes Institute on a separate cohort of mice fed chow or an HFD for 1, 3, 6 and 16 weeks. The basal metabolic characteristics are presented in Fig. 2 and Table 1. Body mass was not different between chow-fed and HFD mice after 1 week (Fig. 2a); however, there was a significant increase in fat mass in HFD mice (Fig. 2b). The increase in body mass induced by the HFD was evident after 3 weeks, and thereafter, both body mass and fat mass continued to increase in fat-fed mice (Fig. 2a,b). Chow-fed mice also gained fat mass over time (Fig. 2b); however, glucose metabolism under basal and hyperinsulinaemic–euglycaemic clamp conditions was similar for all chow groups (ESM Table 1). For this reason, all time points for chow-fed animals were combined into one group for the metabolic and insulin sensitivity data presented in Table 1 and Fig. 3. Blood glucose levels in animals fasted for 5 h were elevated only after 6 weeks of HFD (Table 1). Basal plasma insulin levels tended to be higher after 1 week of HFD and were further increased from 3 weeks onwards (Table 1). Plasma NEFA (Table 1) and basal rates of endogenous glucose production (Endo_R_ a) were not altered at any time point in HFD mice (Fig. 3).
Fig. 2
The development of obesity in an independent group of chow- and fat-fed mice. (a) Body mass; and (b) body fat. Data are mean±SEM. White bars, chow-fed mice; black bars, fat-fed mice.* p < 0.05 vs chow at same time point; † p < 0.05 vs 1 week within same dietary condition; ‡ p < 0.05 vs 3 weeks within same dietary condition; § p < 0.05 vs 6 weeks with same dietary conditions. n = 9–30
Table 1 Plasma insulin and NEFA before and during the hyperinsulinaemic–euglycaemic clamp
Fig. 3
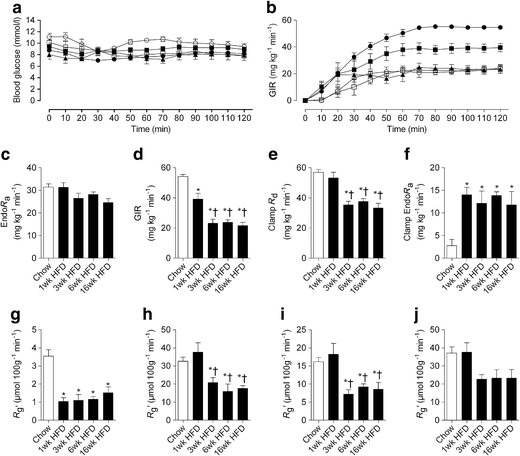
The temporal development of whole-body and tissue-specific insulin resistance in fat-fed mice. (a) Blood glucose levels during the hyperinsulinaemic–euglycaemic clamp; (b) GIR over the duration of the clamp; (c) basal Endo_R_ a; (d) GIR averaged over the final 30 min steady-state period of the clamp; (e) R d during the clamp; (f) endogenous glucose production during the clamp. (g–j) Glucose uptake during the clamp by: (g) epididymal fat; (h) quadriceps; (i) tibialis anterior and (j) soleus. Data are mean±SEM. For a and b, black circles, chow diet; black squares, 1 week HFD; black triangles, 3 weeks HFD; white circles, 6 weeks HFD; white squares, 16 weeks HFD. * p < 0.05 vs chow; † p < 0.05 vs 1 week HFD. n = 5–29
Whole-body insulin sensitivity
Blood glucose concentrations were matched in all groups during the hyperinsulinaemic–euglycaemic clamp studies (Table 1 and Fig. 3a). The glucose infusion rate (GIR) required to maintain euglycaemia was reduced by ∼25% in mice fed the HFD for 1 week compared with chow-fed mice (Fig. 3b,d). This early defect in GIR was not associated with a defect in the rate of glucose disappearance (R d; Fig. 3e) but rather an inability to effectively suppress Endo_R_ a (92.0 ± 4.4% vs 56.0 ± 3.3% suppression of Endo_R_ a for chow and 1 week HFD mice, respectively, p < 0.05; Fig. 3f). This inability to suppress Endo_R_ a was not further exacerbated beyond the initial defect detected following 1 week of HFD (Fig. 3f). In contrast, the GIR was further reduced to ∼50% of chow levels after 3 weeks of fat feeding, which coincided with a ∼30% reduction in clamp R d (Fig. 3e). Interestingly, both GIR and clamp R d did not deteriorate further with prolonged fat feeding up to 16 weeks (Fig. 3b,d,e). The clamp insulin levels were similar between chow-fed and 1 week HFD animals (Table 1). However, clamp plasma insulin levels were higher in the 3, 6 and 16 week HFD groups (Table 1), which may be related to their higher basal levels or impaired insulin clearance. Plasma NEFA was reduced to similar levels during the clamp (Table 1). However, when expressed as a per cent of the basal value, only 16 week fat-fed animals exhibited a defect in the suppression of NEFA during the clamp (55.8 ± 4.5% vs 28.8 ± 1.7% suppression of NEFA for chow-fed and 16 week HFD mice, respectively, p < 0.05).
_Tissue_-specific insulin sensitivity
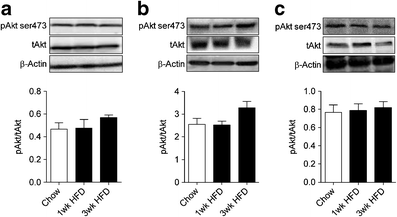
Figure 3g–j shows the glucose metabolic index (R g′) in individual tissues during the hyperinsulinaemic–euglycaemic clamp. R g′ was markedly reduced in the epididymal fat of mice fed an HFD for 1 week and was not further altered by fat feeding for 3, 6 or 16 weeks. Given that clamp R d was not impaired after 1 week, the adipose tissue insulin resistance at this time had no major consequence on whole-body insulin action. Consistent with the defect in clamp R d, a reduction in R g′ in tibialis anterior and quadriceps muscle was detected after 3 weeks of HFD, with no further reduction beyond this initial defect. The R g′ in the soleus showed a similar trend; however, this reduction did not reach statistical significance. While rapid and sustained defects in tissue insulin sensitivity were noted, the ability of insulin to phosphorylate Akt remained intact in all tissues after 1–3 weeks of the HFD (Fig. 4a–c).
Fig. 4
The phosphorylation status of Akt in tissues obtained at the completion of the euglycaemic–hyperinsulinaemic clamp. Liver (a), epididymal adipose tissue (b) and skeletal muscle (c) Akt ser473 phosphorylation. Data are mean±SEM. n = 5–7. pAkt, phosphorylated Akt; tAkt, total Akt
Tissue lipid content
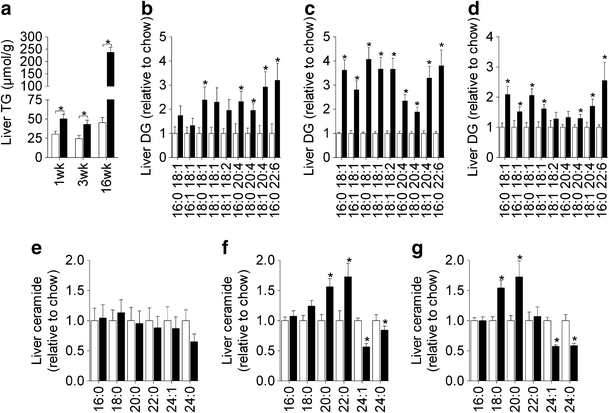
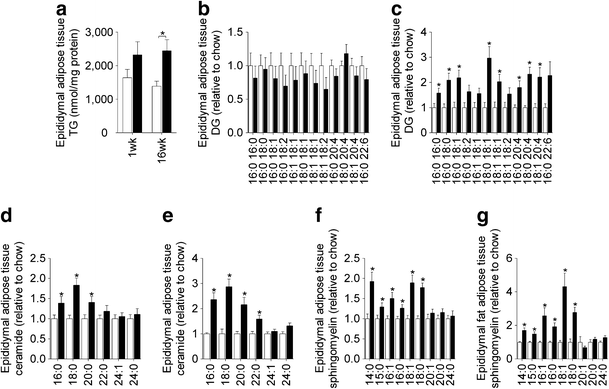
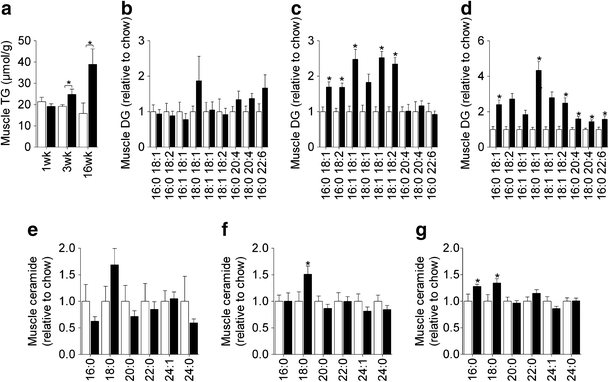
The induction of hepatic insulin resistance after 1 week of HFD was associated with an increase in liver TG (Fig. 5a; ESM Table 2) as well as a number of DG species (Fig. 5b); however, liver ceramides were not altered (Fig. 5e). Prolonged HFD caused further increases in hepatic TG (Fig. 5a), while the increase in DG content was maintained throughout the time course (Fig. 5c,d). Changes in liver ceramide were noted at 3 and 16 weeks (Fig. 5f,g), with some species (18:0, 20:0 and 22:0) increasing in response to the HFD, while others (24:0 and 24:1) were reduced. Adipose tissue exhibited defects in glucose metabolism after 1 week of HFD, but this was not associated with any significant change in TG or DG content (Fig. 6a,b; ESM Table 3). In contrast, a number of ceramide and sphingomyelin species were elevated (Fig. 6d,f). After 16 weeks of HFD, adipose tissue TG and DG levels were elevated (Fig. 6a,c), while ceramide and sphingomyelin were further increased (Fig. 6e,g). Skeletal muscle lipid content was not altered after 1 week of HFD (Fig. 7a,b,e; ESM Table 4) but at 3 weeks, when muscle was first observed to be insulin resistant, TG and DG levels (Fig. 7a,c) were elevated. The induction of insulin resistance in muscle was also associated with an increase in 18:0 ceramide (Fig. 7f). Extended fat feeding resulted in further increases in muscle TG and DG (Fig. 7a,d) and an increase in 16:0 ceramide, while the changes in 18:0 ceramide were maintained (Fig. 7g).
Fig. 5
Hepatic lipid levels. Liver TG (a), DG (b–d) and ceramide (e–g) content following 1 (b,e), 3 (c,f) and 16 weeks (d,g) of chow or HFD. Data are mean±SEM. White bars, chow-fed mice; black bars, fat-fed mice. * p < 0.05 vs chow. n = 5–10
Fig. 6
Epididymal adipose tissue lipids. Epididymal adipose tissue TG (a), DG (b,c), ceramide (d,e) and sphingomyelin (f,g) content following 1 (b,d,f) and 16 weeks (c,e,g) of chow or HFD. Data are mean±SEM. White bars, chow-fed mice; black bars, fat-fed mice. Data are mean±SEM. * p < 0.05 vs chow. n = 9–11
Fig. 7
Skeletal muscle lipids. Quadriceps TG (a), DG (b–d) and ceramide (e–g) content following 1 (b,e), 3 (c,f) and 16 weeks (d,g) of chow or HFD. Data are mean±SEM. White bars, chow-fed mice; black bars, fat-fed mice. * p < 0.05 vs chow. n = 5–10
Markers of inflammation
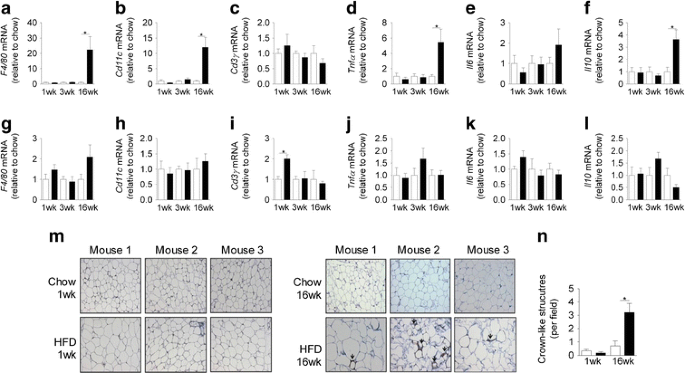
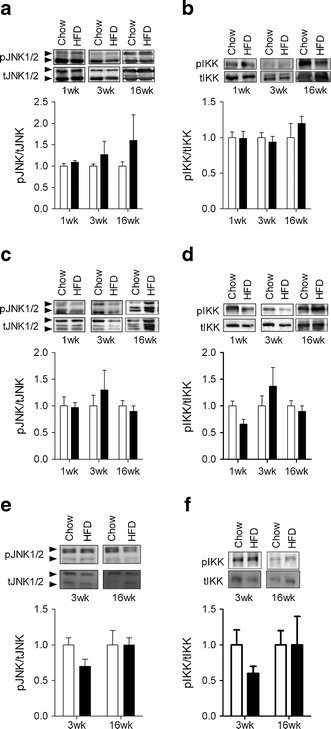
The expression of a number of inflammatory markers was not altered in epididymal adipose tissue following 1 and 3 weeks of HFD (Fig. 8a–f). However, after 16 weeks of the HFD marked increases in the expression of the macrophage markers F4/80 (also known as Emr1) and Cd11c (also known as Itgax) as well as Tnfα (also known as Tnf) and Il10 were found (Fig. 8a–f). Consistent with the mRNA expression data, significant F4/80 staining, demonstrating the presence of crown-like structures, was only found in the adipose tissue of mice fed the HFD for 16 weeks (Fig. 8 m,n). When similar analysis was performed on liver, we only found that Cd3γ (also known as Cd3g) expression was modestly increased after 1 week of HFD (Fig. 8g–l). Interestingly, in the livers of 16 week HFD mice, there were no changes in the expression of any of the inflammatory markers measured. In addition, the HFD did not alter the expression of Tnfα (3 weeks 1.0 ± 0.2 vs 1.1 ± 0.3 and 16 weeks 1 ± 0.2 vs 1.4 ± 0.3 for chow and HFD, respectively) or Il6 (3 weeks 1.0 ± 0.2 vs 1.2 ± 0.4 and 16 weeks 1 ± 0.2 vs 0.8 ± 0.1 for chow and HFD, respectively) in skeletal muscle. We also examined the activation of JNK and IκB kinase (IKK) in adipose tissue, liver and skeletal muscle. The phosphorylation status of JNK and IKK was not increased in any of the tissues at any time point examined (Fig. 9a–f).
Fig. 8
The effect of fat feeding on the expression of inflammatory markers in epididymal adipose tissue (a–f) and liver (g–l). The mRNA expression of F4/80 (a,g), Cd11c (b,h), Cd3γ (c,i), Tnfα (d,j), Il6 (e,k) and Il10 (f,l) in adipose tissue and liver. F4/80 staining in sections of epididymal adipose tissue (m) and the number of crown-like structures per field (n). Sections were stained for the mature macrophage specific marker F4/80, revealing crown-like structures (indicated by the brown staining, shown by the arrows) and were counter-stained with haematoxylin. Representative images from three animals per group are shown in (m). All images are taken at ×20 magnification. White bars, chow-fed mice; black bars, fat-fed mice. Data are mean±SEM. * p < 0.05. n = 6–14 for parts a–l and n = 4–5 for data in part n
Fig. 9
The effect of fat feeding on the phosphorylation status of JNK and IKK. Phosphorylation of JNK and IKK was determined in liver (a,b), epididymal adipose tissue (c,d) and skeletal muscle (e,f) at the indicated time points. Data are mean±SEM. n = 6–7. Phosphorylated and total forms denoted by ‘p’ and ‘t’, respectively
Discussion
An extensive analysis of the temporal development of glucose intolerance and insulin resistance was conducted in mice exposed to an HFD. We demonstrated that glucose intolerance develops within 3 days on an HFD, but does not worsen significantly, even after 12 weeks on an HFD. This finding stimulated us to measure tissue-specific insulin action and we showed that liver and adipose tissue exhibit peak insulin resistance for glucose metabolism within 1 week on an HFD, while additional time is required for insulin action to deteriorate in muscle. Other rodent studies using HFDs with differing lipid content and composition have reported a similar temporal pattern of the development of tissue-specific insulin resistance [7, 19, 20], indicating that insulin-regulated glucose metabolism in liver and adipose tissue are particularly sensitive to the effects of dietary lipid overload. However, unlike these studies we provide novel evidence demonstrating that once tissue insulin resistance develops it reaches a plateau and is not exacerbated by extended periods of fat feeding. Furthermore, consistent with our hypothesis, we show that an increase in lipid metabolites are associated with defects in tissue insulin action, suggesting that lipotoxicity is a generalised mechanism associated with the induction of insulin resistance in individual tissues of mice.
Studies in rodents [7, 19–21, 23], dogs [24] and humans [25–27], have shown that short-term exposure to HFD/overfeeding (3–28 days) results in the rapid development of insulin resistance and glucose intolerance. Often these changes occur with only modest increases in fat mass, highlighting that metabolic defects occur prior to the onset of obesity and do not require extensive periods of fat feeding. Here, we show that whole-body insulin sensitivity does not deteriorate further beyond 3 weeks of HFD in mice, indicating that insulin resistance develops rapidly but reaches a plateau that is maintained over the course of further fat feeding. When comparing short- (3 week) [28] and long-term (10 months) [29] HFD protocols in rats, whole-body insulin sensitivity is reduced by ∼60% when compared with lean chow-fed controls, irrespective of how long the rats are maintained on the HFD. This supports the notion that insulin resistance has a limit that, once reached, is not exacerbated by further HFD and subsequent gains in adiposity.
In support of findings in animals [7, 19, 21, 23, 24] and humans [25, 30, 31], our data show that an HFD rapidly impairs the ability of insulin to suppress hepatic glucose output, with peripheral insulin resistance developing subsequently. Furthermore, our data suggest that the liver quantitatively has the most significant impact on postprandial glycaemia, as both peak glucose intolerance and hepatic insulin resistance occurred within 3–7 days of HFD, despite the absence of muscle insulin resistance at this time. Based on the temporal pattern of insulin resistance described here, it is likely that the development of muscle insulin resistance is a major driver of compensatory hyperinsulinaemia, as significant elevations in fasting insulin were not seen until 3 weeks of HFD, which coincides with the development of peripheral insulin resistance. The hyperinsulinaemia may explain why glucose tolerance remained similarly impaired in fat-fed animals across the entire time course, as the increased insulin levels from 3 weeks onwards may have been sufficient to compensate for the reductions in whole-body insulin sensitivity.
In addition to liver, adipose tissue also developed a defect in insulin-stimulated glucose uptake after only 1 week of HFD. Despite the presence of severe adipose tissue insulin resistance at this early time point, peripheral insulin sensitivity remained intact, consistent with a quantitatively small contribution of adipose to whole-body glucose disposal [19, 32]. It has been proposed that adipose tissue insulin resistance leads to excessive lipolysis which increases NEFA supply to liver and muscle, causing lipotoxicity and insulin resistance in these tissues [33]. Interestingly, while we observed a major reduction in glucose uptake by adipose tissue, the ability of insulin to activate Akt and suppress NEFA remained largely intact throughout the entire time course. In addition, fasting plasma NEFA was similar between the chow-fed and HFD groups. This suggests that adipose tissue insulin resistance was specific with respect to glucose metabolism, but not to the control of lipolysis. Similar findings have been described in other studies [25, 29, 34]. This notion of selective insulin resistance has recently been described in liver [17, 35]. It has been shown that while liver becomes resistant to the actions of insulin in regulating glucose production and glycogen synthesis, insulin-stimulated lipid synthesis remains intact [17, 35]. Overall, these findings suggest there is selectivity in the nodes of insulin-regulated nutrient metabolism that are impaired in response to lipid and/or energy intake overload.
Many factors have been proposed to underpin the development of insulin resistance. Overactivation of stress pathways such as oxidative and endoplasmic reticulum stress have been linked with insulin resistance [36–38], though there is also evidence that reactive oxygen species production and the unfolded protein response can positively influence insulin action [39, 40]. Obese, insulin-resistant individuals also exhibit a state of chronic low-grade inflammation, and as such activation of inflammatory pathways have also been proposed as a major driver of insulin resistance [1, 2]. However, in the current study, despite a clear induction of insulin resistance within 1–3 weeks on the HFD, we did not observe any major evidence for inflammation in liver, adipose tissue or skeletal muscle. In adipose tissue there was a marked increase in inflammatory markers after 16 weeks of HFD, but this was not associated with activation of the inflammatory kinases JNK and IKK. Consistent with our data, other studies have shown that macrophage infiltration and inflammation are only present in adipose tissue following prolonged (≥8 week) fat feeding [41–43]. A recent study by Lee et al [7] did report the early presence of some inflammatory markers in adipose tissue of fat-fed mice; however, their studies showed that inflammation is not an early driver of insulin resistance, but may play a role in the maintenance of longer-term obesity-induced insulin resistance. Collectively, the data from the current study and the literature [41–44] demonstrate there is a dissociation between the initiation of insulin resistance and the development of macrophage-associated inflammation. However, because of the wide variety of cells and markers associated with systemic inflammation it is possible that other immune cells show activation at this early stage [45].
Ectopic lipid accumulation in non-adipose tissue is strongly correlated with the development of insulin resistance [3, 4]. While TGs are now considered to be a metabolically inert storage pool [11, 17], it remains unclear which bioactive lipid species may be most important in the induction of insulin resistance. Many studies have reported increased levels of DGs or ceramides in insulin-resistant states and have demonstrated that reductions in these lipid species can improve insulin action [5, 9–12, 14–16]. One mechanism through which these lipid species have been proposed to drive insulin resistance is through antagonism of the insulin-signalling cascade [4, 12]. However, in the initial 1–3 weeks of HFD in which we first detected insulin resistance, we did not observe any defect in insulin-stimulated Akt activation, suggesting that other mechanisms (e.g. metabolic feedback) may play a more important role at these early time points.
The controversy regarding which lipids are the major mediators of lipid-induced insulin resistance stems from the fact that there are not always coordinated changes in DG and ceramide levels in relation to insulin resistance, and that alterations in insulin action can occur without the expected changes in the content of one or both of these lipid classes [46]. These discrepancies may relate to the specific tissue under investigation and the time at which measurements are made after the commencement of the HFD. We show that there were distinct changes in lipid classes in each tissue at the time that insulin resistance was first detected. In liver after 1 week of HFD, there was elevated TG content and increases in a number of DG species, while changes in ceramide occurred after the development of hepatic insulin resistance. This is consistent with reports proposing a critical role for DGs in the induction of hepatic insulin resistance [6, 21]. The initiation of muscle insulin resistance was associated with elevated TG and DG content, as well as an increase in 18:0 ceramide, the major ceramide species in muscle. In contrast, when adipose tissue first displayed insulin resistance, TG and DG were not changed, but ceramide and sphingomyelin species were increased. This is similar to findings in a recent study in humans showing that adipose tissue from obese individuals had elevated sphingolipid levels [47]. The intriguing pattern of tissue-selective lipid accumulation in response to an HFD highlights the diversity in lipid metabolic pathways in different tissues and indicates that it is unlikely that there is one lipid species that is responsible for the induction of insulin resistance across all insulin-responsive tissues. Furthermore, our data suggest that only modest changes in tissue lipids are required to cause insulin resistance and that exacerbating lipid accumulation with longer periods of fat feeding does not cause a further deterioration in insulin sensitivity.
In summary, we demonstrate that whole-body insulin resistance develops rapidly in mice in response to fat feeding. Severe hepatic and adipose tissue insulin resistance was evident after only 1 week of HFD, while defects in muscle insulin action were apparent after 3 weeks. Interestingly, despite continued exposure to a HFD and marked gains in fat mass, insulin action failed to further deteriorate, indicating that once insulin resistance develops, it plateaus and is maintained over the course of the HFD intervention. We also demonstrate that HFD-induced insulin resistance precedes the development of metabolic inflammation. In contrast, the development of insulin resistance in metabolic tissues is closely associated with the accumulation of distinct bioactive lipid species. Thus, our findings provide further evidence that defects in lipid metabolism are intimately linked to the pathogenesis of insulin resistance.
References
- Donath MY, Shoelson SE (2011) Type 2 diabetes as an inflammatory disease. Nat Rev Immunol 11:98–107
Article PubMed CAS Google Scholar - Gregor MF, Hotamisligil GS (2011) Inflammatory mechanisms in obesity. Annu Rev Immunol 29:415–445
Article PubMed CAS Google Scholar - Kraegen EW, Cooney GJ (2008) Free fatty acids and skeletal muscle insulin resistance. Curr Opin Lipidol 19:235–241
Article PubMed CAS Google Scholar - Samuel VT, Shulman GI (2012) Mechanisms for insulin resistance: common threads and missing links. Cell 148:852–871
Article PubMed CAS Google Scholar - Itani SI, Ruderman NB, Schmieder F, Boden G (2002) Lipid-induced insulin resistance in human muscle is associated with changes in diacylglycerol, protein kinase C, and IkappaB-alpha. Diabetes 51:2005–2011
Article PubMed CAS Google Scholar - Magkos F, Su X, Bradley D et al (2012) Intrahepatic diacylglycerol content is associated with hepatic insulin resistance in obese subjects. Gastroenterology 142(1444–1446):e1442
Google Scholar - Lee YS, Li P, Huh JY et al (2011) Inflammation is necessary for long-term but not short-term high-fat diet-induced insulin resistance. Diabetes 60:2474–2483
Article PubMed CAS Google Scholar - Wright LE, Brandon AE, Hoy AJ et al (2011) Amelioration of lipid-induced insulin resistance in rat skeletal muscle by overexpression of Pgc-1beta involves reductions in long-chain acyl-CoA levels and oxidative stress. Diabetologia 54:1417–1426
Article PubMed CAS Google Scholar - Chibalin AV, Leng Y, Vieira E et al (2008) Downregulation of diacylglycerol kinase delta contributes to hyperglycemia-induced insulin resistance. Cell 132:375–386
Article PubMed CAS Google Scholar - Choi CS, Savage DB, Kulkarni A et al (2007) Suppression of diacylglycerol acyltransferase-2 (DGAT2), but not DGAT1, with antisense oligonucleotides reverses diet-induced hepatic steatosis and insulin resistance. J Biol Chem 282:22678–22688
Article PubMed CAS Google Scholar - Liu L, Zhang Y, Chen N, Shi X, Tsang B, Yu YH (2007) Upregulation of myocellular DGAT1 augments triglyceride synthesis in skeletal muscle and protects against fat-induced insulin resistance. J Clin Invest 117:1679–1689
Article PubMed CAS Google Scholar - Schmitz-Peiffer C, Craig DL, Biden TJ (1999) Ceramide generation is sufficient to account for the inhibition of the insulin-stimulated PKB pathway in C2C12 skeletal muscle cells pretreated with palmitate. J Biol Chem 274:24202–24210
Article PubMed CAS Google Scholar - Bruce CR, Risis S, Babb JR et al (2012) Overexpression of sphingosine kinase 1 prevents ceramide accumulation and ameliorates muscle insulin resistance in high fat-fed mice. Diabetes 61:3148–3155
Article PubMed CAS Google Scholar - Adams JM 2nd, Pratipanawatr T, Berria R et al (2004) Ceramide content is increased in skeletal muscle from obese insulin-resistant humans. Diabetes 53:25–31
Article PubMed CAS Google Scholar - Ussher JR, Koves TR, Cadete VJ et al (2010) Inhibition of de novo ceramide synthesis reverses diet-induced insulin resistance and enhances whole-body oxygen consumption. Diabetes 59:2453–2464
Article PubMed CAS Google Scholar - Holland WL, Brozinick JT, Wang LP et al (2007) Inhibition of ceramide synthesis ameliorates glucocorticoid-, saturated-fat-, and obesity-induced insulin resistance. Cell Metab 5:167–179
Article PubMed CAS Google Scholar - Farese RV Jr, Zechner R, Newgard CB, Walther TC (2012) The problem of establishing relationships between hepatic steatosis and hepatic insulin resistance. Cell Metab 15:570–573
Article PubMed CAS Google Scholar - Sun C, Tian L, Nie J, Zhang H, Han X, Shi Y (2012) Inactivation of MARK4, an AMP-activated protein kinase (AMPK)-related kinase, leads to insulin hypersensitivity and resistance to diet-induced obesity. J Biol Chem 287:38305–38315
Article PubMed CAS Google Scholar - Kraegen EW, Clark PW, Jenkins AB, Daley EA, Chisholm DJ, Storlien LH (1991) Development of muscle insulin resistance after liver insulin resistance in high-fat-fed rats. Diabetes 40:1397–1403
Article PubMed CAS Google Scholar - Park SY, Cho YR, Kim HJ et al (2005) Unraveling the temporal pattern of diet-induced insulin resistance in individual organs and cardiac dysfunction in C57BL/6 mice. Diabetes 54:3530–3540
Article PubMed CAS Google Scholar - Samuel VT, Liu ZX, Qu X et al (2004) Mechanism of hepatic insulin resistance in non-alcoholic fatty liver disease. J Biol Chem 279:32345–32353
Article PubMed CAS Google Scholar - Turner N, Hariharan K, TidAng J et al (2009) Enhancement of muscle mitochondrial oxidative capacity and alterations in insulin action are lipid species dependent: potent tissue-specific effects of medium-chain fatty acids. Diabetes 58:2547–2554
Article PubMed CAS Google Scholar - Birkenfeld AL, Lee HY, Majumdar S et al (2011) Influence of the hepatic eukaryotic initiation factor 2alpha (eIF2alpha) endoplasmic reticulum (ER) stress response pathway on insulin-mediated ER stress and hepatic and peripheral glucose metabolism. J Biol Chem 286:36163–36170
Article PubMed CAS Google Scholar - Coate KC, Scott M, Farmer B et al (2010) Chronic consumption of a high-fat/high-fructose diet renders the liver incapable of net hepatic glucose uptake. Am J Physiol Endocrinol Metab 299:E887–E898
Article PubMed CAS Google Scholar - Brons C, Jensen CB, Storgaard H et al (2009) Impact of short-term high-fat feeding on glucose and insulin metabolism in young healthy men. J Physiol 587:2387–2397
Article PubMed Google Scholar - Lagerpusch M, Bosy-Westphal A, Kehden B, Peters A, Muller MJ (2012) Effects of brief perturbations in energy balance on indices of glucose homeostasis in healthy lean men. Int J Obes (Lond) 36:1094–1101
Article CAS Google Scholar - Tam CS, Viardot A, Clement K et al (2010) Short-term overfeeding may induce peripheral insulin resistance without altering subcutaneous adipose tissue macrophages in humans. Diabetes 59:2164–2170
Article PubMed CAS Google Scholar - Oakes ND, Cooney GJ, Camilleri S, Chisholm DJ, Kraegen EW (1997) Mechanisms of liver and muscle insulin resistance induced by chronic high-fat feeding. Diabetes 46:1768–1774
Article PubMed CAS Google Scholar - Chalkley SM, Hettiarachchi M, Chisholm DJ, Kraegen EW (2002) Long-term high-fat feeding leads to severe insulin resistance but not diabetes in Wistar rats. Am J Physiol Endocrinol Metab 282:E1231–E1238
PubMed CAS Google Scholar - Clore JN, Helm ST, Blackard WG (1995) Loss of hepatic autoregulation after carbohydrate overfeeding in normal man. J Clin Invest 96:1967–1972
Article PubMed CAS Google Scholar - Cornier MA, Bergman BC, Bessesen DH (2006) The effects of short-term overfeeding on insulin action in lean and reduced-obese individuals. Metab Clin Exp 55:1207–1214
Article PubMed CAS Google Scholar - Frayn KN, Coppack SW, Humphreys SM, Whyte PL (1989) Metabolic characteristics of human adipose tissue in vivo. Clin Sci (Lond) 76:509–516
CAS Google Scholar - Boden G (1997) Role of fatty acids in the pathogenesis of insulin resistance and NIDDM. Diabetes 46:3–10
Article PubMed CAS Google Scholar - Bickerton AS, Roberts R, Fielding BA et al (2008) Adipose tissue fatty acid metabolism in insulin-resistant men. Diabetologia 51:1466–1474
Article PubMed CAS Google Scholar - Brown MS, Goldstein JL (2008) Selective versus total insulin resistance: a pathogenic paradox. Cell Metab 7:95–96
Article PubMed CAS Google Scholar - Ozcan U, Cao Q, Yilmaz E et al (2004) Endoplasmic reticulum stress links obesity, insulin action, and type 2 diabetes. Science 306:457–461
Article PubMed Google Scholar - Anderson EJ, Lustig ME, Boyle KE et al (2009) Mitochondrial H2O2 emission and cellular redox state link excess fat intake to insulin resistance in both rodents and humans. J Clin Invest 119:573–581
Article PubMed CAS Google Scholar - Hoehn KL, Salmon AB, Hohnen-Behrens C et al (2009) Insulin resistance is a cellular antioxidant defense mechanism. Proc Natl Acad Sci USA 106:17787–17792
Article PubMed CAS Google Scholar - Achard CS, Laybutt DR (2012) Lipid-induced endoplasmic reticulum stress in liver cells results in two distinct outcomes: adaptation with enhanced insulin signaling or insulin resistance. Endocrinology 153:2164–2177
Article PubMed CAS Google Scholar - Tiganis T (2011) Reactive oxygen species and insulin resistance: the good, the bad and the ugly. Trends Pharmacol Sci 32:82–89
Article PubMed CAS Google Scholar - Strissel KJ, DeFuria J, Shaul ME, Bennett G, Greenberg AS, Obin MS (2010) T cell recruitment and Th1 polarization in adipose tissue during diet-induced obesity in C57BL/6 mice. Obesity (Silver Spring) 18:1918–1925
Article CAS Google Scholar - Weisberg SP, McCann D, Desai M, Rosenbaum M, Leibel RL, Ferrante AW Jr (2003) Obesity is associated with macrophage accumulation in adipose tissue. J Clin Invest 112:1796–1808
PubMed CAS Google Scholar - Xu H, Barnes GT, Yang Q et al (2003) Chronic inflammation in fat plays a crucial role in the development of obesity-related insulin resistance. J Clin Invest 112:1821–1830
PubMed CAS Google Scholar - Aparicio-Vergara M, Hommelberg PP, Schreurs M et al (2013) Tumor necrosis factor receptor 1 gain-of-function mutation aggravates non-alcoholic fatty liver disease but does not cause insulin resistance in a murine model. Hepatology 57:566–576
Article PubMed CAS Google Scholar - Elgazar-Carmon V, Rudich A, Hadad N, Levy R (2008) Neutrophils transiently infiltrate intra-abdominal fat early in the course of high-fat feeding. J Lipid Res 49:1894–1903
Article PubMed CAS Google Scholar - Bosma M, Kersten S, Hesselink MK, Schrauwen P (2012) Re-evaluating lipotoxic triggers in skeletal muscle: relating intramyocellular lipid metabolism to insulin sensitivity. Prog Lipid Res 51:36–49
Article PubMed CAS Google Scholar - Blachnio-Zabielska AU, Pulka M, Baranowski M et al (2012) Ceramide metabolism is affected by obesity and diabetes in human adipose tissue. J Cell Physiol 227:550–557
Article PubMed CAS Google Scholar

