The Arctic Water Resource Vulnerability Index: An Integrated Assessment Tool for Community Resilience and Vulnerability with Respect to Freshwater (original) (raw)
Abstract
People in the Arctic face uncertainty in their daily lives as they contend with environmental changes at a range of scales from local to global. Freshwater is a critical resource to people, and although water resource indicators have been developed that operate from regional to global scales and for midlatitude to equatorial environments, no appropriate index exists for assessing the vulnerability of Arctic communities to changing water resources at the local scale. The Arctic Water Resource Vulnerability Index (AWRVI) is proposed as a tool that Arctic communities can use to assess their relative vulnerability–resilience to changes in their water resources from a variety of biophysical and socioeconomic processes. The AWRVI is based on a social–ecological systems perspective that includes physical and social indicators of change and is demonstrated in three case study communities/watersheds in Alaska. These results highlight the value of communities engaging in the process of using the AWRVI and the diagnostic capability of examining the suite of constituent physical and social scores rather than the total AWRVI score alone.
Access this article
Subscribe and save
- Starting from 10 chapters or articles per month
- Access and download chapters and articles from more than 300k books and 2,500 journals
- Cancel anytime View plans
Buy Now
Price excludes VAT (USA)
Tax calculation will be finalised during checkout.
Instant access to the full article PDF.
Fig. 1
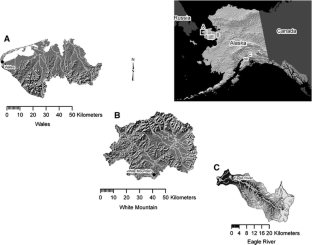
The alternative text for this image may have been generated using AI.
References
- ACIA (2005) Arctic climate impact assessment scientific report. Cambridge University Press, Cambridge
Google Scholar - Alessa L, Kliskey A, Williams P (2007) The distancing effect of modernization on the perception of water resources in Arctic communities. Polar Geography 30:175–191
Article Google Scholar - Alessa L, Kliskey A, Williams P (in press) Forgetting freshwater: technology, values, and distancing in remote Arctic communities. Society and Natural Resources
- Alessa L, Kliskey A, Williams P, Barton M (2008a) Perception of change in freshwater in remote resource-dependent Arctic communities. Global Environmental Change 18:153–164
Article Google Scholar - Alessa L, Kliskey A, Williams P, White D, Busey R, Hinzman L (2008b) Freshwater vulnerabilities and resilience on the Seward Peninsula as a consequence of land use and climate change. Global Environmental Change 18:256–270
Article Google Scholar - Amaral ALN, Ottini JM (2004) Complex networks. European Physical Journal of Biology 38:147–162
Article CAS Google Scholar - Bengtsson J, Angelstam P, Elmqvist T et al (2003) Reserves, resilience and dynamic landscapes. Ambio 32:389–396
Article Google Scholar - Bourdieu P (1996) The state nobility: elite schools in the field of power. Stanford University Press, San Francisco, pp 504
Google Scholar - Brenkert AL, Malone EL (2005) Modeling vulnerability and resilience to climate change: a case study of India and Indian states. Climatic Change 72:57–102
Article CAS Google Scholar - Brown BB (1968) Delphi process: a methodology used for the elicitation of opinions of experts. RAND Corportation, Santa Monica, CA
Google Scholar - Camill P (2005) Permafrost thaw accelerates in boreal peatlands during late-20th century climate warming. Climatic Change 68:135–152
Article CAS Google Scholar - Chambers M, White D, Busey R, Hinzman L, Alessa L, Kliskey A (2007) Potential impacts of a changing Arctic on community water sources on the Seward Peninsula, Alaska. Journal of Geophysical Research 112:G04S52
Article Google Scholar - Chance NA, Andreeva EN (1995) Sustainability, equity, and natural resource development in Northwest Siberia and Arctic Alaska. Human Ecology 23:217–240
Article Google Scholar - Domenico PA, Schwartz W (1998) Physical and chemical hydrogeology. John Wiley & Sons, New York
Google Scholar - EPA (1997) Volunteer stream monitoring: a methods manual. Office of Water. United States Government. Available from www.epa.gov/volunteer/stream/index.html
- EPA (2002) Index of watershed indicators: an overview. US Environmental Protection Agency Office of Wetlands Oceans and Watersheds. Available from www.epa.gov/iwi/iwi-overview.pdf
- Falkenmark M (1989) The massive water scarcity now threatening Africa: why isn’t it being addressed? Ambio 18:112–118
Google Scholar - Frauenfeld OW, Zhang T, Berry RG, Gilinchinsky D (2004) Interdecadal changes in seasonal freeze and thaw depths in Russia. Journal of Geophysical Research 109:D05101
Article Google Scholar - Gowrie MN (2003) Environmental vulnerability index for the island of Tobago. Conservation Ecology 7(2):11
Google Scholar - Gleick PH (1996) Basic water requirements for human activities: meeting basic needs. Water International 21:83–92
Google Scholar - Hilborn R, Quinn TP, Schindler DE, Rogers DE (2007) Biocomplexity and fisheries sustainability. PNAS 100:6564–6568
Article CAS Google Scholar - Hinzman L, Bettez ND, Bolten WR et al (2005) Evidence and implications of recent climate change in northern Alaska and other regions. Climatic Change 72:251–298
Article Google Scholar - Holling CS, Gunderson LH (2002) Resilience and adaptive cycles. In: Gunderson LH, Holling CS (eds) Panarchy. Island Press, Washington, DC, pp 25–62
Google Scholar - Hurd B, Leary N, Jones R, Smith J (1999) Relative regional vulnerability of water resources to climate change. Journal of the American Water Resources Association 35:1399–1409
Article Google Scholar - Lammers RB, Shiklomanov AI, Vorosmarty CJ, Fekete BM, Peterson BJ (2001) Assessment of contemporary Arctic river runoff based on observational records. Journal of Geophysical Research: atmospheres 106:3321–3334
Article Google Scholar - Lawrence P, Meigh J, Sullivan C (2002) The water poverty index: an international comparison. Keele Economics Research Papers. Keele University, Staffordshire, UK, pp 1352–8955
Google Scholar - Lawson PW, Logerwell EA, Mantua NJ, Francis RC, Agostini VN (2004) Environmental factors influencing freshwater survival and smolt production in Pacific Northwest coho salmon (Oncorhynchus kisutch). Canadian Journal of Fisheries and Aquatic Sciences 61:360–373
Article Google Scholar - Linstone HA, Turoff M (2002) The Delphi method: techniques and applications. New Jersey Institute of Technology, Newark
Google Scholar - Magdanz JS, Utermohle CJ, Wolfe RJ (2002) The production and distribution of wild food in Wales and Deering, Alaska. Technical Paper 259. Division of Subsistence, Alaska Department of Fish and Game, Juneau
Google Scholar - Magdanz JS, Walker RJ, Paciorek RR (2004) The subsistence harvests of wild foods by residents of Shungnak, Alaska, (2002) Technical Paper 279. Division of Subsistence, Alaska Department of Fish and Game, Juneau
Google Scholar - Magnuson JJ, Robertson DM, Benson BJ et al (2000) Historical trends in lake and river ice cover in the northern hemisphere. Science 289:1743–1746
Article CAS Google Scholar - Meigh JR, McKenzie AA, Sene KJ. (2004) A grid based approach to water scarcity estimates for eastern and southern Africa. Water Resources Management 13:85–115
Article Google Scholar - Messerli B, Grosjean M, Hofer T, Nunez L, Pfister C (2000) From nature-dominated to human-dominated environmental changes. Quaternary Science Review 19:459–479
Article Google Scholar - North D (1991) Institutions, institutional change and economic performance. Cambridge University Press, Cambridge
Google Scholar - Olsson P, Folke C, Berkes F (2004) Adaptive comanagement for building resilience in social–ecological systems. Environmental Management 34:75–90
Article Google Scholar - Osterkamp ET, Romanovsky VE (1999) Evidence for warming and thawing of discontinuous permafrost in Alaska. Permafrost and Periglacial Processes 10:17–37
Article Google Scholar - Overpeck J, Hughen K, Hardy D et al (1997) Arctic environmental change of the last four centuries. Science 278:1251–1256
Article CAS Google Scholar - Pavlov AV (2006) Current changes of climate and permafrost in the artic and sub-arctic of Russia. Permafrost and Periglacial Processes 5:101–110
Article Google Scholar - PRI (2007) Canadian Water Sustainability Index (CWSI) Policy Research Initiative. Government of Canada. Available from. http://www.policyresearch.gc.ca/doclib/SD/SD_PR_CWSI_web_e.pdf
- Raskin P, Gleick P, Kirshen P et al (1997) Water futures: assessment of long-range patterns and problems. Background document to the comprehensive assessment of the freshwater resources of the world. Stockholm Environmental Institute, Stockhom, Sweden. Available from http://www.environ.chemeng.ntua.gr/WSM/Uploads/Deliverables/ThirdYear/Deliverable_21_3.pdf
- Reynoldson TB (1993) The development of ecosystem objectives for the Laurentian Great lakes. Journal of Aquatice Ecosystem Health 2:81–85
Article Google Scholar - Riordan B, Verbyla D, McGuire AD (2006) Shrinking ponds in subarctic Alaska based on 1950–2002 remotely sensed images. Journal of Geophysical Research 111:G04002
Article Google Scholar - Robards MD, Alessa L (2004) Timescapes of community resilience and vulnerability in the circumpolar north. Arctic 57:415–427
Google Scholar - Rose A, Liao S (2005) Modeling regional economic resilience to disasters: a computable general equilibrium analysis of water service disruptions. Journal of Regional Science 45:75–112
Article Google Scholar - Rowe G, Wright G (1999) The Delphi technique, a forecasting tool: issues and analysis. International Journal of Forecasting 15:353–375
Article Google Scholar - Sackman H (1974) Delphi assessment: expert opinion, forecasting and group process. RAND Corporation, Santa Monica, CA
Google Scholar - Schulze RE (2000) Modelling hydrological responses to land use and climate change: a southern African perspective. Ambio 29:12–22
Article Google Scholar - Seckler D, Upali A, Molden D, de R Silva, Barker R (1998) World water demand and supply, 1990 to 2025: scenarios and issues. International Water Management Institute, Colombo, Sri Lanka
Google Scholar - Serreze MC, Walsh JE, Chapin FS et al (2000) Observational evidence of recent change in the northern high-latitude environment. Climatic Change 46:159–207
Article Google Scholar - Smith LC, Sheng Y, MacDonald GM, Hinzman LD (2005) Disappearing Arctic lakes. Science 308:5727
Google Scholar - Sreedevi PD, Subbrahanyam K, Ahmed S (2005) The significance of morphometric analysis for obtaining groundwater potential zones in a structurally controlled terrain. Environmental Geology 47:412–421
Article Google Scholar - Sullivan CA (2001) The potential for calculating a meaningful water poverty index. Water International 26:471–480
Article Google Scholar - Sullivan CA, Meight JR, Giacomello AM (2003) The water poverty index: development and application at the community scale. Natural Resources Forum 27:189–199
Article Google Scholar - United Nations (2000) UN millennium development goals. Available from http://www.un.org/millenniumgoals
- Van Beynen P, Townsend K (2005) A disturbance index for Karst environments. Environmental Management 36:101–116
Article Google Scholar - Vörösmarty C, Green P, Lammers R (2000) Global water resources: vulnerability from climate change and population growth. Science 289:284–288
Article Google Scholar - White D, Hinzman L, Alessa J et al (2007) The Arctic freshwater system: changes and impacts. Journal of Geophysical Research 112:G04S54
Article Google Scholar
Acknowledgments
We are grateful to the National Science Foundation (OPP Arctic System Science #0327296 and #0328686) for funding this research; the views expressed here do not necessarily reflect those of the National Science Foundation. We thank Paula Williams of the Resilience and Adaptive Management Group, University of Alaska Anchorage for assistance with field work, data entry, and literature work. We thank Sean Mack of the Resilience and Adaptive Management Group and the Geographic Information Network of Alaska for assistance with spatial dataset compilation and GIS-based computations. We are grateful for the insightful comments on an earlier version by two anonymous reviewers. We also thank our community collaborators in the communities of Eagle River, Wales and White Mountain, Quyana.
Author information
Authors and Affiliations
- Resilience and Adaptive Management Group, University of Alaska Anchorage, 3211 Providence Drive, Anchorage, AK, 99508, USA
Lilian Alessa & Andrew Kliskey - Institute of Northern Engineering, University of Alaska Fairbanks, Fairbanks, AK, USA
Lilian Alessa & Dan White - Water Systems Analysis Group, University of New Hampshire, Durham, NH, USA
Richard Lammers - United States Geological Survey, Alaska Science Center, Anchorage, AK, USA
Chris Arp - International Arctic Research Center, University of Alaska Fairbanks, Fairbanks, AK, USA
Larry Hinzman & Robert Busey
Authors
- Lilian Alessa
- Andrew Kliskey
- Richard Lammers
- Chris Arp
- Dan White
- Larry Hinzman
- Robert Busey
Corresponding author
Correspondence toAndrew Kliskey.
Additional information
Lilian Alessa and Andrew Kliskey have contributed equally.
Appendix
Appendix
This Appendix provides the initial indicators for an AWRVI modified from existing broad-scale indices: Water Poverty Index (Sullivan 2002), Water Availability Index (Meigh et al. 1999), and the Index of Watershed Indicators (EPA [2002](/article/10.1007/s00267-008-9152-0#ref-CR16 "EPA (2002) Index of watershed indicators: an overview. US Environmental Protection Agency Office of Wetlands Oceans and Watersheds. Available from www.epa.gov/iwi/iwi-overview.pdf
")) prior to assessment and revision from an expert panel via Delphi method. Experts were asked to rate the applicability of each indicator and the range of values used and to propose additional indicators considered necessary. This process proceeded through five iterations. | | | Indicator | Unit | Resilience Index 0 (low: vulnerable)−1 (high: resilient) range | Secondary indicators/detailed indicators/comments | | | -------------------------------------------------------------------------------------------------------------------------------------- | --------------------------------------------------------------------------- | ----------------------------------------------------------------------------------------------------------------------------------------------------- | ----------------------------------------------------------------------------------------------------------------------------------------------------------------------------------------------------------------------------------------------------------------------------- | -------------------------------------------------------------------------------------------------------------------------------------------------- | ----------------------------------------------------------------------------------------------------------------------------------------------------------------------------------------------------------------------------------------------------------------------------------------------------------------------------------------------------------------------------------------------------------------------------------------------------------------------------------------------------------------------------------------------------------------------------------------------------------------------------------------------- | | Water use capacity5 | Natural supply (%) | Landscape type; change in area wetlands/lakes | % of catchments: (topography and change over time, rate in loss/gain m2/year) | (+ % high) (+ change loss, low; +change gain, high) | Lake depth or volume est., seasonal availability. Precipitation: changes in regime, timing, and magnitude; WBM/WTM; time step depends on data availability (Note: WBM/WTM by Vörösmarty et al. (2000) if local-scale appropriate); precipitation weighted w.r.t. land-use changes: higher ppt might result in flooding if higher disturbance. Sources: remote sensing, satellite, maps, gauges, oral histories, met stations, trade records, etc. | | Stream network diversity (1−3 orders); change in river discharge | Ratio rate in m3/year | (+ high) (+ change, low) | | | | | Precipitation; variance | mm/year Rate in mm/year | (+ high; linked to upstream drainage modified) (+low; “unreliable”) | | | | | Municipal supply (%) | Reservoirs (storage capacity) | (m3/year) and/or flow rates Ratio | (+ high) | Sources: facility and engineering specifications, local knowledge | | | Wells (groundwater) | (+ high) | | | | | | Index of treatment technology, # of water sources | (+ low) | | | | | | Ratio % infrastructure on dPF | | | | | | | Water transport | Distance from source to user | m/km | (+ low) | Sources: facility and engineering specifications, local knowledge | | | Energy required to move water or melt snow | KW or L of petrol or kg of coal | (+ low) | Sources: facility and engineering specifications, local knowledge | | | | Watershed features | Water quality | Upstream drainage modified or withdrawn by industry, number and types of MWS wastewater discharge, number of landfills and honeybucket disposal sites | % of catchment | (+ low) | Biological quality: EC, TC, Cryptosporidia, Giardia | | Chemical quality: conductivity, pH, other standard chemical analyses | | | | | | | Sources: sample analyses | | | | | | | Water origin | [Continuous PF/PF free]/[Transitional Permafrost (PF)/Discontinuous PF] | (+ low) | More reliable (cPF or PF-free) versus transitional (dPF) land; groundwater contribution by comparison of conductivity; water infrastructure constructed on PF, heavier weighting for dPF. Sources: remote sensing, satellite, maps, gauges, oral histories, industry records. | | | | (+ high) | | | | | | | Subsistence habitat | % (#) fish-recruiting streams | % | (+ high) | Sources: records of catch (ADF&G), local knowledge | | | Regulation and management capacity | Informational capacity | Regulatory control | | - | Types of data missing, access to local and traditional knowledge that is documented. Education includes Western degrees and experience/knowledge through land-schooling and other traditional methods (e.g., total number of elders who actively transfer relevant knowledge) | | Environmental strategies and action plans. Availability of sustainable development information at national, regional, and local levels | | (+ high) | | | | | % of ESI variables missing from public datasets: % of baseline data at watershed scale, local knowledge available regarding water | % | (+ low) | | | | | Education | | (+ high) | | | | | Network diversity | # of internal & external links | | | | | | Sensitivity to change | Perception of change | Pi that perceives change | (+ high) | Greater perception of change→more likely to respond; more values of water as a resource→less likely to choose options that degrade or threaten it. | | | Values of water | Pi with subsistence/cultural values | (+ high proportion) | Sources: local knowledge | | |
Rights and permissions
About this article
Cite this article
Alessa, L., Kliskey, A., Lammers, R. et al. The Arctic Water Resource Vulnerability Index: An Integrated Assessment Tool for Community Resilience and Vulnerability with Respect to Freshwater.Environmental Management 42, 523–541 (2008). https://doi.org/10.1007/s00267-008-9152-0
- Received: 25 April 2007
- Revised: 28 April 2008
- Accepted: 12 May 2008
- Published: 17 June 2008
- Issue date: September 2008
- DOI: https://doi.org/10.1007/s00267-008-9152-0