Genome-wide microRNA profiling in human fetal nervous tissues by oligonucleotide microarray (original) (raw)
Introduction
To date, 326 microRNAs (miRNAs), a ubiquitous family of about 22-nt noncoding regulatory RNAs, have been identified in the human genome and published in a database (http://www.sanger.ac.uk/Software/Rfam/mirna/index.shtml) [1]. Although more than 200 distinct miRNAs are predicted in the human genome, little is known about their biological functions, especially during embryonic development. MiRNAs regulate target genes at the post-transcriptional level and play important roles in development and cell lineage decisions. However, in vertebrates, neither the targets of miRNAs nor their expression profiles during development are well understood. Some miRNAs are specifically expressed in individual tissues and at particular developmental stages. The developmental or tissue-specific patterns of miRNA expression observed may suggest analogous roles in regulating human development or cellular differentiation [2–4].
A major obstacle in the study of miRNA function is the lack of methods for quantitative expression profiling. The miRNA microarray method, a powerful tool for global analysis of miRNA expression first reported by Krichevsky et al. [5], is based on a membrane array spotted with specific antisense mature miRNA oligonucleotides. Since then, other types of oligonucleotide array methods have been published, including arrays on glass slides and on beads [6–9].
In this study, a robust microarray-based technique was established and used to identify the expression of 158 miRNAs in human fetal organs. The oligonucleotide microarray (OMA) was designed according to the method of Liu [7], with modifications. We used miRNA microarrays to study the profiles of miRNA expression in nervous tissue samples and other organic samples from two fetuses. Some clusters of miRNA families were co-expressed, providing clues about the maturation processes of miRNAs. At the same time, we found a high concordance between our array results and those from Northern blots. The microarray described here offers more comprehensive coverage and higher throughput than other methods, represents a powerful tool to better understand miRNA expression profiles in human tissues, and provides clues to the mechanisms for regulating protein translation.
Materials and methods
Samples and RNA extraction
Two fetal abortuses [12 weeks (G12w) and 24 weeks (G24w) gestational age] tissues were obtained from the National Infrastructure Program of the Chinese Genetic Resources after obtaining informed consent. The G12w tissues were liver, kidney, cerebrum, lung, and heart, and the G24w tissues were the same, plus ovary, spleen, hypothalamus, pancreas, and cervical, thoracic, lumbar, and sacral spinal cord. Total RNA was isolated using TRIZOL reagent (Invitrogen) according to the manufacturer’s standard protocol, and mRNA was purified by oligotex (Qiagen).
Microarray design
The miRNA oligonucleotide microarray design was based on that of spotted OMAs by Liu et al. [7], with significant modifications. The mature miRNA sequences, which ranged from 19 to 24 nt, were too short, so two probes were designed for several miRNAs, one containing active sites that detected both the mature and the precursor forms (probe a), while the other did not contain the active sites located in the precursor (probe b). An oligo probe was designed that was not homologous to any human sequence and was used as normalization control (control oligo); the sequence was 5′ ATGTCATCTTGCGCGGCAGCTCGTCGACCGTGGCGAGAGT GTCTCGTCGATCATC 3′. All oligos were 40 nt long. In theory, the mature miRNA expression level can be determined by subtracting the (a) signal from the (b) signal. Nine probes for nine tRNA genes were used as positive controls and six probes for six types of miRNA genes from Arabidopsis thaliana were used as negative controls.
Microarray fabrication
All probes were dissolved in 150 mM phosphate acid buffer (pH 7.5–8.0) to a final concentration of 25 pmol/μl. Then the control oligo was added to each miRNA probe at 2 pmol/μl. The OMAs were spotted by a GeneMachine OmniGrid 100 Microarrayer in a 1×4 pin and 9×8 spot configuration for each subarray with triplicates. The spotting conditions were 75% humidity and 20°C. After spotting, slides were hydrated overnight in saturated salt solution and then crosslinked with UV light at 600 mJ/cm2 (UVP CL1000).
Sample labeling
The cDNA was labeled during first strand synthesis by using a fluorescence-tagged (Cy5) random octameric primer. Briefly, 10 μg total RNA and 1 μg random primer were mixed and incubated at 70°C for 10 min, then 5 × first-strand buffer, 0.1 M DTT, 5 mM unlabeled dNTP mix, Cy5-dCTP, RNA inhibitor, and Superscript II (200 U/μl) were added and incubated at 42°C for 2 h, then denatured at 70°C for 10 min. NaOH was added to hydrolyze RNA to stop the reaction of reverse transcription, and then HEPES was added to neutralize it. The labeled cDNA was purified by using the QIAquick Nucleotide Removal Kit (Qiagene).
Microarray hybridization
The labeled cDNAs and Cy3-tagged oligonucleotides complementary to the control probes were dissolved in 6 × SSPE/5 × Denhardt hybridization buffer and were hybridized with the miRNA oligonucleotide microarray for 16 h at 42°C. Then the slides were washed with buffer I (2 × SSC/0.5% SDS) for 15 min at 42°C, buffer II (1 × SSC/0.1% SDS) for 10 min at 42°C, buffer III (0.1 × SSC) for 5 min at room temperature, dipped in double-distilled water for 1 min at room temperature, and then dried. The slides were scanned by an Agilent scanner (G2565AA) at 535 and 635 nm.
Statistical analysis
The images were split into two, Cy3 and Cy5 channels, and each channel was imported into the Imagene Software 7.0 to read the signal value. The Cy3 signal was used as reference for the spot size of each miRNA oligo on the slides. The expression level of each miRNA in the sample labeled by Cy5 was normalized by a median method according to the Cy3 signal between two microarrays. So, the Cy5 signal, after normalization, gave the expression level of each miRNA. Clustering was carried out by Genespring Software 8.0 according to Cy5 intensity.
Northern blot analysis
Forty micrograms of total RNA from each sample was separated on 15% acrylamide denaturing gels (8 M urea) and then transferred to Hybond N+ membranes (Amersham) by electrophoresis for Northern blots. The filters were crosslinked with 150 mJ of UV (Bio-Rad) and baked at 80°C for 1 h. The specific oligo probes complementary to the corresponding miRNAs were labeled at the 5′ end by using T4 polynucleotide kinase with 32P-γ-ATP (Amersham). The sequence list of probes for Northern blots were: miR-92-2: 5′- CAGGCCGGGACAAGTGCAATA-3′; miR-9: 5′- TCATACAGCTAGATAACCAAAGA-3′; miR-9*: 5′-ACTTTCGGTTATCTAGCTTTA-3′; miR-15a: 5′- CACAAACCATTATGTGCTGCTA-3′; miR-17: 5′- ACAAGTGCCTTCACTGCAGT-3′; miR-20: 5′-CTACCTGCACTATAAGCACTTTA-3′; miR-106a: 5′- GCTACCTGCACTGTAAGCACTTTT-3′, and U6: 5′-CGTTCCAATTTTAGTATATGTGCTGCCGAAGCGA-3′ [10]. U6 on the membrane served as loading control. Prehybridization and hybridization were carried out using ExpressHyb Hybridization Solution (Clontech) according to the manufacturer’s instructions. Membranes were washed at room temperature, twice with 2 × SSC, 0.1% SDS and twice with 0.5 × SSC, 0.1% SDS. The blots were exposed on Molecular Dynamics Phosphorimager screens and signals were quantified using ImageQuant (Molecular Dynamics). For reuse, blots were stripped by boiling in 0.5% SDS for 20 min and scanned on Phosphorimager screens. Blots without radioactive signals were re-hybridized and re-used up to six times without influencing the quality of radioactive signals.
Results
MiRNA oligo nucleotide microarray construction
We designed 243 oligonucleotide probes and covered 158 human miRNAs from http://microrna.sanger.ac.uk/cgi-bin/sequences/browse.pl and from publications. Nine tRNAs served as positive controls. The oligonucleotide probes were 40 nt in length. For 67 miRNAs, two different probes were designed, one containing the active site and the other specific for the precursor. Using this strategy, we were able to analyze the miRNA and pre-miRNA in the same experiment. A control oligo probe, which was not homologous to any human gene sequence, was designed for spotting and quality control. All miRNA probes were dissolved in phosphate buffer at 25 μmol/ml and the control probe was mixed with each miRNA probe at 2 μmol/ml. The microarray slides were printed on an Ominigride 100 machine (Gene Machine). Each oligo probe was spotted in triplicate.
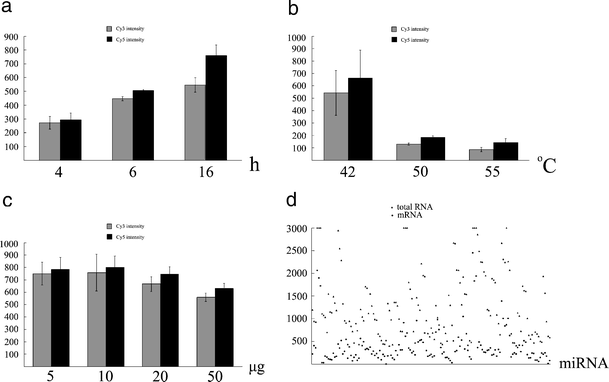
To develop the optimal conditions for the OMA, we compared mRNA and total RNA as the starting sample. Two micrograms of mRNA and 10 μg of total RNA were separately labeled during the reverse transcription reaction and hybridized to the OMA. The results indicated that mRNA had a relatively low signal compared to the total RNA, suggesting that mRNA had little influence on the results (Fig. 1d), so total RNA could be used for the microarray experiment. The microarray hybridization time was tested at 4, 6, and 16 h. The hybridization signals at 6 h were considerably higher than those at 4 h, while the signals at 16 h were only slightly higher than those at 6 h (Fig. 1a). To test the OMA sensitivity, quantities of total RNA ranging from 5 to 20 μg were labeled and then hybridized to the OMA (Fig. 1c). The strongest signal was obtained at 10 μg total RNA. To find the optimal temperature, we tested hybridization at 42, 50, and 55°C. The signal was very low at 50 and 55°C (Fig. 1b). From the above results, we chose 10 μg total RNA and 42°C hybridization for 16 h in all OMA experiments.
Fig. 1
miRNA oligonucleotiede microarrary construction. a The signal at hybridization times of 6 and 16 h was much higher than that at 4 h. b A hybridization temperature of 42°C was optimal for the microarray. c On testing quantities of total RNA from 5 to 20 μg, the signal was highest at 10 μg. d Comparison of total RNA and mRNA as the starting sample. The 100 highest signal pairs were chosen, and signal values greater than 3,000 were shown as 3,000. The results indicated that mRNA had little influence on the signal, so total RNA could be used as the starting material
Distinct miRNA profiling in different organs during human development
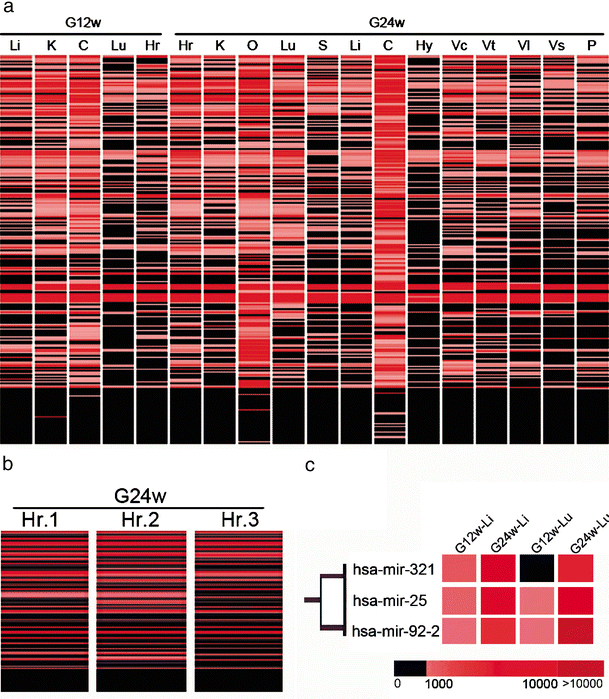
Total RNAs of samples from human fetal organs at G12w and G24w were labeled during reverse transcription. The labeled cDNAs hybridized to the OMA. After data processing, we found that 72–83% of the miRNAs were expressed in human fetal organs, in which the most miRNAs were expressed in G24w cerebrum. Distinct miRNA expression patterns were found in different organs at each developmental stage (Fig. 2a). Some miRNAs were seen in all samples from both embryonic stages (e.g., let-7d, miR-193, miR-7-3, miR-185, and miR-328, among others); they represent a type of restricted spatial and temporal expression pattern. These miRNAs were uniformly expressed over time, which suggests more general roles in gene regulation.
Fig. 2
Profiles of miRNome expression in human G12w and G24w fetal organs. a Distinct patterns of miRNA expression in different human fetal organs (abbreviation listed below). All of the data represent the average of at least three replicates from the same organ. b The same G24w heart sample triplicate chip results showed good reliability. Each result was from three replicates of the array. c Three stage-specific miRNAs, miR-92-2, miR-25, and miR-321, were expressed in G24w and G12w liver and lung. The bar represents the microarray signal intensity from 1,000 to 10,000. The blue line on the left indicates that the four miRNAs were clustered by cluster software analysis. C cerebrum, Hr heart, K kidney, Li liver, Lu lung, O ovary, P pancreas, S spleen, Vc cervical spinal cord, Vl lumbar spinal cord, Vs sacral spinal cord, Vt thoracic spinal cord
To test the replicability of the microarray, the G24w heart sample was labeled and hybridized in triplicate. The results from different detection batches were highly reproducible (Fig. 2b). Similar miRNA expression patterns were seen in samples from developmentally proximal organs, indicating that a miRNA expression profile can be a marker of developmental stage in organs originating from the same endodermal layer. Three different miRNAs, miR-92-2, miR-25, and mirR-321, were predominantly expressed in liver and lung at G24w compared with the same organs at G12w (Fig. 2c). As an indicator of miRNA expression level, the color of samples from G24w organs was brighter than those from G12w organs. So, the miRNA expression profile can be used as a biomarker of developmental stage.
CNS specifically and higher expressed microRNAs
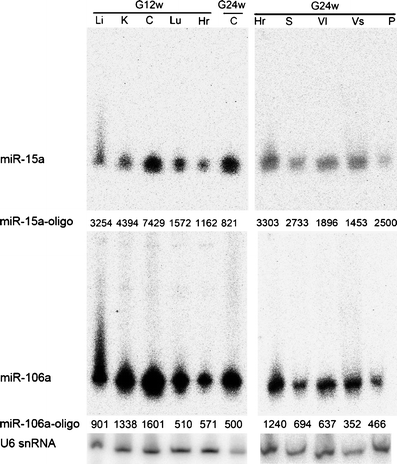
In our study, we found four CNS specifically expressed microRNAs, miR-9, miR-9*, miR-124a, and miR-125b, in which miR-124a and miR-125b are expressed higher in G24w cerebrum than in G12w. At the same time, miR-15a, miR-106a, and miR-17–92 cluster members were found expressed relatively higher in CNS tissues than other tissues. To validate the reliability of the microarray data, we selected seven CNS specifically and higher expressed miRNAs and designed specific probes for Northern blot analysis. The miRNAs were: miR-9, miR-9*, miR-15a, miR-106a, and miR-17–92 cluster members including miR-17, miR-20 and miR-92-1, which are located in the genomic site of both terminals and in the middle of the cluster. We found good consistency between the Northern blot and microarray data, as shown by the results from the selected miR-15a and miR-106a (Fig. 3).
Fig. 3
Expression of miR-15a and miR-106a, detected by Northern blot. were in accord with the signals detected by microarray. The abbreviations are as in the legend of Fig. 2. The miR-15a and miR-106a are shown on the left, indicating the corresponding expression detected by Northern blot. The microarray results are presented numerically, indicated by Oligo. U6 snRNA detected by Northern blot was used as detection control
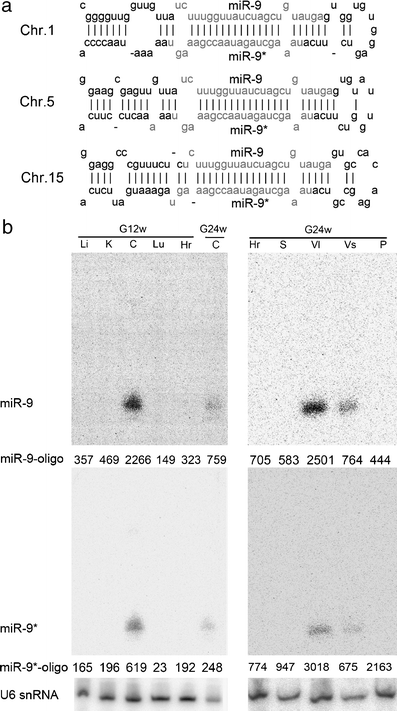
MiR-9, miR-9*, miR-124a, and miR-125b known to be specifically expressed in rat nervous system, are also only expressed in the human fetal nervous system found by microarray and Northern blot at the same time (Fig. 4). Analysis of the array results indicated that miR-9 and miR-9* probably originated from the expressed pre-mi-RNA of chromosome 5 and may play key roles in human nervous system development. So it can be concluded that miRNA microarrays can identify different pre-miRNA origins by using different oligo probes.
Fig. 4
miR-9 and miR-9* were expressed specifically in the human nervous system. a miR-9 and miR-9* can be expressed from human chromosomes 1, 5, and 15 and form three types of pre-miRNA. The secondary structures of pre-miRNAs from the Sanger miRNA register website were predicted with mfold software. The pre-miRNAs can be excised by Dicer into the same mature miRNAs—miR-9 and miR-9*. b Northern blot results probed with miR-9 and miR-9*. The abbreviations are as in the legend of Fig. 2. The microarray results are presented numerically, indicated by Oligo. U6 snRNA detected by Northern blot was used as detection control
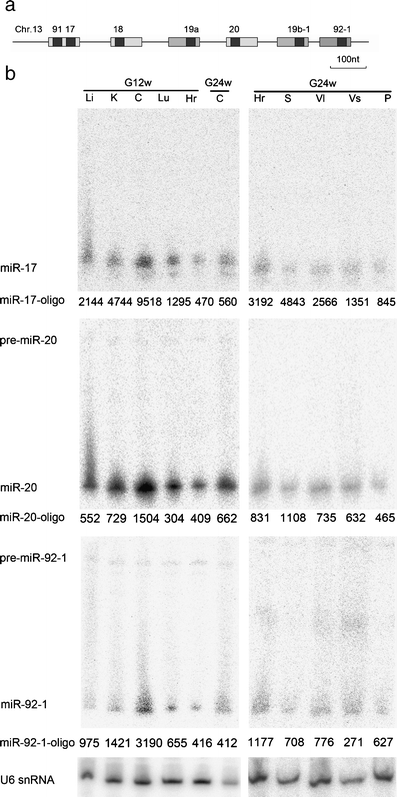
Members of the miR-17–92 cluster, which contains six pre-miRNAs within about 1 kb on human chromosome 13, share the same expression profile [11]. The microarray and Northern blot results showed that these six miRNAs had the same expression pattern (Fig. 5), suggesting that clustered miRNAs have the same transcript and share the same promoter element.
Fig. 5
Co-expressed miR-17-92 cluster miRNAs. a The three known human miRNA clusters. The miR-17–92 cluster contains six pre-miRNAs within about 1 kb on chromosome 13. b The miR-17, miR-20, and miR-92-1 expression profiles detected by Northern blot (the name of the miRNA and pre-miRNA are given on the left and the abbreviations are as in the legend of Fig. 2.) and microarray (results given numerically and marked as miR-17-oligo, miR-20-oligo, and miR-92-1-oligo). U6 snRNA detected by Northern blot was used as detection control
Discussion
The small size of miRNAs requires more sensitive tools for quantitative analysis. Although the optimized method of RT-Q-PCR can indirectly detect mature miRNAs [12], the efficiency of detection is relatively low. Currently, the most reliable method for the study of miRNA expression is Northern blot analysis with polyacrylamide gels. This method can distinguish pre-miRNA and miRNA at the same time, although the technique is relatively insensitive owing to the large total RNA volume needed, and it is labor-intensive.
The miRNA oligonucleotide microarray provides a novel method to carry out genome-wide microRNA profiling in human samples. We used total RNA as the sample for the microarray test, not just labeling filtered low molecular weight RNA, which could change the ratio of pre-miRNA to miRNA. So the profile we generated was that of pre-miRNAs and miRNAs. Owing to its high throughput and small sample requirement, the miRNA OMA can be used as screening method in miRNA research.
Some microRNAs are within the introns of host genes. Intronic miRNAs are usually expressed in coordination with their host gene mRNA, suggesting that they are generally derived from a common transcript [13]. Some human microRNAs are even processed from capped, polyadenylated transcripts and can function as mRNAs [14]. Therefore, recognition of these miRNA gene families should help in the identification of putative mRNA targets and in understanding the pathways of miRNA biogenesis. Through GeneCluster software analysis, we found that miR-17, miR-18, miR-19a, miR-19b, miR-20, and miR-92-1 form a cluster.
Based on the bioinformatics study and previous work, we attempted to verify the hypothesis that the miR-17–92 cluster may share the same expression unit. We searched for the genome location and possible co-expressed mRNA and found the six pre-miRNAs within about 1 kb on human chromosome 13; the possible co-expressed mRNA is human chromosome 13 open reading frame 25 (C13 orf25), transcript variant 2 mRNA, indicating that the miR-17–92 cluster members are intronic miRNAs. Analysis of clustered miRNA expression profiles suggested that the six clustered miRNAs may have the same promoter element.
In our study, we found that four miRNAs were only expressed in the human fetal nervous system, indicating that they may play important roles in human nervous system development. Before our study, Krichevsky et al. found miR-9 and miR-9* specifically expressed in mouse brain, and they were de-regulated in presenilin-1 null mice, which exhibited severe developmental defects of the brain [5]. MiR-9 and miR-9* may modulate critical development processes in human brain development and changes in stage and level of expression may induce major developmental errors. Giraldez et al. showed that miR-430 regulates brain morphogenesis in zebrafish and MZdicer mutants undergo axis formation and differentiate multiple cell types but display abnormal morphogenesis during gastrulation, brain formation, somitogenesis, and heart development. Injection of miR-430 rescues the brain defects in MZdicer mutants, revealing essential roles for miRNAs during morphogenesis [15].
No human miR-430 is registered online at present, but miR-17, miR-20, and miR-106a have the same sequence at nucleotides 2–8. Giraldez thought this is most important for recognition. In our study, members of the miR-17–92 cluster were highly expressed in the nervous system, but no human miRNA expression homologous to miR-430 was detected by Northern blot with a pre-miR-430 probe (data not shown). In humans, it is not miR-430 that plays a critical role in nervous system morphogenesis. So these results indicated that there are differences in the mechanisms of brain morphogenesis between human and zebra fish.
This raises the question of whether the specifically expressed miR-9, miR-9*, and higher expressed miR-17–92 cluster are functionally linked, or perhaps this just reflects higher nonspecific Dicer activity. He et al. compared B-cell lymphoma samples and cell lines to normal tissues and found that the levels of the primary or mature miRNAs derived from the miR-17–92 locus are often substantially increased in these cancers, implicating the miR-17–92 cluster as a potential human oncogene [16]. O’Donnell et al. found that _c_-Myc-regulated miR-17 and miR-20 modulate E2F1 expression [17]. These findings indicate that the miR-17–92 cluster may be a common channel to regulate cell differentiation.
References
- Griffiths-Jones S (2004) The microRNA registry. Nucleic Acids Res 32:D109–D111
Article PubMed CAS Google Scholar - Chen CZ, Li L, Lodish HF, Bartel DP (2004) MicroRNAs modulate hematopoietic lineage differentiation. Science 303:83–86
Article PubMed CAS Google Scholar - Houbaviy HB, Murray MF, Sharp PA (2003) Embryonic stem cell-specific MicroRNAs. Dev Cell 5:351–358
Article PubMed CAS Google Scholar - Lagos-Quintana M, Rauhut R, Meyer J, Borkhardt A, Tuschl T (2003) New microRNAs from mouse and human. RNA 9:175–179
Article PubMed CAS Google Scholar - Krichevsky AM, King KS, Donahue CP, Khrapko K, Kosik KS (2003) A microRNA array reveals extensive regulation of microRNAs during brain development. RNA 9:1274–1281
Article PubMed CAS Google Scholar - Liang RQ, Li W, Li Y, Tan CY, Li JX, Jin YX, Ruan KC (2005) An oligonucleotide microarray for microRNA expression analysis based on labeling RNA with quantum dot and nanogold probe. Nucleic Acids Res 33:e17
Article PubMed Google Scholar - Liu CG, Calin GA, Meloon B, Gamliel N, Sevignani C, Ferracin M, Dumitru CD, Shimizu M, Zupo S, Dono M, Alder H, Bullrich F, Negrini M, Croce CM (2004) An oligonucleotide microchip for genome-wide microRNA profiling in human and mouse tissues. Proc Natl Acad Sci USA 101:9740–9744
Article PubMed CAS Google Scholar - Lu J, Getz G, Miska EA, Alvarez-Saavedra E, Lamb J, Peck D, Sweet-Cordero A, Ebert BL, Mak RH, Ferrando AA, Downing JR, Jacks T, Horvitz HR, Golub TR (2005) MicroRNA expression profiles classify human cancers. Nature 435:834–838
Article PubMed CAS Google Scholar - Barad O, Meiri E, Avniel A, Aharonov R, Barzilai A, Bentwich I, Einav U, Gilad S, Hurban P, Karov Y, Lobenhofer EK, Sharon E, Shiboleth YM, Shtutman M, Bentwich Z, Einat P (2004) MicroRNA expression detected by oligonucleotide microarrays: system establishment and expression profiling in human tissues. Genome Res 14:2486–2494
Article PubMed CAS Google Scholar - Cai X, Lu S, Zhang Z, Gonzalez CM, Damania B, Cullen BR (2005) Kaposi’s sarcoma-associated herpesvirus expresses an array of viral microRNAs in latently infected cells. Proc Natl Acad Sci USA 102:5570–5575
Article PubMed CAS Google Scholar - Tanzer A, Stadler PF (2004) Molecular evolution of a microRNA cluster. J Mol Biol 339:327–335
Article PubMed CAS Google Scholar - Schmittgen TD, Jiang J, Liu Q, Yang L (2004) A high-throughput method to monitor the expression of microRNA precursors. Nucleic Acids Res 32:e43
Article PubMed Google Scholar - Baskerville S, Bartel DP (2005) Microarray profiling of microRNAs reveals frequent coexpression with neighboring miRNAs and host genes. RNA 11:241–247
Article PubMed CAS Google Scholar - Lu S, Cullen BR (2004) Adenovirus VA1 noncoding RNA can inhibit small interfering RNA and MicroRNA biogenesis. J Virol 78:12868–12876
Article PubMed CAS Google Scholar - Giraldez AJ, Cinalli RM, Glasner ME, Enright AJ, Thomson JM, Baskerville S, Hammond SM, Bartel DP, Schier AF (2005) MicroRNAs regulate brain morphogenesis in zebrafish. Science 308:833–838
Article PubMed CAS Google Scholar - He L, Thomson JM, Hemann MT, Hernando-Monge E, Mu D, Goodson S, Powers S, Cordon-Cardo C, Lowe SW, Hannon GJ, Hammond SM (2005) A microRNA polycistron as a potential human oncogene. Nature 435:828–833
Article PubMed CAS Google Scholar - O’Donnell KA, Wentzel EA, Zeller KI, Dang CV, Mendell JT (2005) _c_-Myc-regulated microRNAs modulate E2F1 expression. Nature 435:839–843
Article PubMed CAS Google Scholar
