“Missing the Community for the Dots”: Newspaper Crime Maps, Territorial Stigma and Visual Criminology (original) (raw)
Introduction
The proliferation of new Geographic Information Systems (GIS) and other technological advancements has offered new ways for displaying violence and crime spatially through mapping techniques and practices (Wallace 2009) in crime maps maintained by police forces or via social media and phone apps (Revier 2020). The study of crime maps is also a growing area of research within criminology, for example in the context of juvenile courts, police forces, crime in city spaces, and racialized carceral power (Brown 2017; Ratcliffe 2002; Kindynis 2014; Jefferson 2017; Vigneswaran 2014; Moncada 2010).
This article interrogates the power of crime maps produced by newspapers as journalistic tools in reporting on crime and violence. Online newspaper crime maps, in contrast to, for example, crime maps maintained by police forces (Wallace 2009; Jefferson 2017; Chainey and Tompson 2012; Ratcliffe 2002, 2004; Vigneswaran 2014), are generated as a medium of journalism with the intention to inform and produce knowledge. Therefore, they hold a specific position among other crime maps in terms of their ability to shape how urban spaces are perceived (Lefebvre 1991) in public imageries. Across the United States, newspapers from different cities include crime maps in their repertoire of journalistic tools, including the Los Angeles TimesFootnote 1 or The Baltimore Sun,Footnote 2 among others.
Using the case study of the Chicago Sun-Times, this article scrutinizes the role crime maps play in guiding people’s perception of crime as well as their perceptions of those communities and spaces represented in these maps. The focus of this article is not to merely criticize the role of map makers in the production of spatial knowledge—although this, too, is important to this article—but equally to educate map readers and students about how to interpret crime maps as tools of knowledge production. This is, I believe, important in developing a critical literacy of crime maps’ (in)ability to produce spatial representations of crime. Therefore, this article is intended as a critical commentary for students (and others) to scrutinize the power of crime maps and the ways in which they shape our perceptions and conceptions of crime and space through visual representations.
This article focuses on the Chicago Sun-Times because it is one of the largest, most read newspapers in Chicago with a large local and national readership. On its homepage, the paper maintains a section called ‘Graphics_’._Footnote 3 However, the only cartographic representation found here is a daily-updated crime map that depicts and spatially locates all homicides reported across Chicago based on its own reporting and a compilation of reporting and information from law enforcement agencies and the Cook County medical examiner’s office. The map is updated every day.Footnote 4 Other crimes, such as robberies, theft, etc., are not visualized in similar maps, nor are any other topics mapped out with a similar systematic approach. Based on this case study, I suggest several key propositions in developing a critical literacy of crime maps which can assist in making sense of and interpreting crime maps’ spatial representations.
The first question that should come to a reader’s mind when viewing any crime map is: what is the socio-spatial context of this map? In the case of my analysis, Chicago is one of the most racially segregated cities in the United States. The city’s South and West Sides have historically, and in characteristically racist language, been associated with ‘African-American ghettos’ as “unapologetically mobile, city-destroying spaces which […] threaten the safety and civility in other neighborhoods” (Wilson 2018: 14). The news media has upheld and reproduced the image of these communities as spaces in which violence and crime are considered quotidian aspects of urban spatiality. For example, media representations, including those by the Chicago Sun-Times, of the South Side tend to reproduce sensational and hyperbolic images of the area as ‘no-go spaces’, ‘warzones’, and ‘gang-infested’ (Schwarze 2022a; Luger and Schwarze 2021). Such hyperbolic representations are racist, for they suggest that it is race, rather than socio-economic and structural determinants, that drives urban violence (Wilson 2005). They represent African-American communities as particularly prone to violent and criminal behavior which, in turn, attaches a specific criminogenic character to their residents which is racist. Therefore, I argue, a critical literacy of crime maps needs to embed cartographic visualizations and representations into the socio-spatial context within which these maps operate. In doing so, it becomes possible to identify that newspaper crime maps intensify a public culture of criminalization, stigmatization and defamation of urban communities as spaces of crime, violence and insecurity. These maps add a visual layer of stigma and criminality onto urban spaces which exacerbates their negative image in public imageries.
Second, readers of crime maps need to understand that crimes, such as homicides, occur in specific spatial and temporal contexts, and that crime maps are not produced to visualize the circumstances or contexts of crime (e.g., did the crime occur in a public space or inside a building? Did the perpetrator and victim know each other? etc.). Crime maps’ intentions are not to report on such circumstantial information and context, but rather to spatio-temporally fix crimes onto the surface of a map. In other words, crime maps are simply created using past data on homicides with cartographic tools available in the present to inform how certain spaces should be perceived of in the future. Foregrounding these “echoes between past and present” (Lefebvre 1975: 31) in cartographic production emphasizes how past homicides are spatially and temporally fixed in the present through a bird-eyes representation of urban spaces which, in turn, (re-)produces stigmatizing representations of urban space for the future. In contrast to, for example, news stories on crime which might eventually disappear from people’s collective memory, crime maps fix crime events spatially and temporally for a much longer period, often for an entire year as with my case study of the Chicago Sun-Times, thereby adding a permanence of danger and criminality to urban space.
Third, and following from my previous points, readers and students of crime maps need to understand the broader institutional context within which crime maps operate as producers of spatial knowledge. By spatio-temporally fixing crime onto space, crime maps become tools for visualizing ‘hotspots’ of violence and crime which, in turn, can serve broader policing agendas and reaffirms the primacy of police and state power over space and the human body (Linnemann 2017; Neocleous 2003). For example, crime maps that spatially represent alleged ‘hotspots’ of crime contribute to providing an ideological backdrop of ‘tough on crime’ political rhetoric and policing tactics, despite the well-known limitations of such policing approaches (Rosenbaum 2006). Authorities can point to and use such crime maps in justifying punitive policing strategies toward alleged ‘hotspot’ areas because these maps offer an easily perceivable and understandable representation of high-crime spaces. Readers of crime maps, therefore, should ask themselves what the overall purpose of these crime maps is when producing specific spatial knowledges and, crucially, what social and political consequences such representations might have for residents of depicted communities? For example, various studies have shown how territorial stigmatization and the defamation of spaces through media representations are often perceived as emotionally hurtful to residents of defamed spaces where the internalization of stigma becomes part of their everyday lives (Schwarze forthcoming; Warr 2005; Wacquant 2008). Crime maps contribute to such internalization of stigma and defamation, besides reinforcing punitive agendas of social control and policing.
In developing this critical literacy of crime maps, I will draw on existing academic debates and scholarship within critical cartography and geographical research on territorial stigmatization. Territorial stigmatization denotes the process in which people and the places they live in are discredited, devalued, and, at times, criminalized through, for example, media discourses, bureaucratic practices, or public policies (Slater 2021). Critical cartography is concerned with deciphering the power and political nature of cartographic representations (Crampton and Krygier 2006) and provides a methodological framework in deciphering how territorial stigma is reproduced through maps. Both concepts will be discussed in more detail below.
Besides developing a critical literacy of crime maps for students and readers more generally, this article also introduces new perspectives and research outside of criminology to contribute to ongoing developments within visual criminology (Brown and Carrabine 2017b; 2019; Wheeldon 2022; Carrabine 2012) and critical criminological research concerned with the social production of space (Peršak and Di Ronco 2021; Herrity et al. 2021; Hayward 2004a, b, 2012). The ‘visual turn’ in criminological research has opened new perspectives to studying the role of power in representations of crime and control through images (Brown and Carrabine 2019: 193). As argued by Brown and Carrabine (2017a: 1), “[v]isual criminology gives attention to the relation of representations and images of crime and control to power. It takes as its focal points the structure and operations of visual regimes, their coercive and normalizing effects as well as their contestations.” This article adds new perspectives to visual criminology by discussing crime maps as specific images and visual regimes of crime representation.
The ‘spatial turn’ (Hayward 2012) in criminological research, too, has offered new perspectives to critically engage with the role of space in the reproduction of power inequalities, multiple marginalities, and deprivations (Schwarze 2022b; Herbert and Brown 2006). Viewing space not as a static, container-like entity but “as a product of power relations, cultural and social dynamics, or everyday values and meanings” (Hayward 2012: 441) redirects scholarly attention toward the ways in which, for example, punishment, multiple marginalization and stigmatization are experienced and reproduced in and through social spaces (Peršak and Di Ronco 2021; Herrity et al. 2021).
In developing my critical literacy of crime maps, the first two sections outline the concepts of territorial stigmatization and critical cartography. The following section, by drawing on scholarship on persuasive map design, examines the visual characteristics of the online crime map by the Chicago Sun-Times. This is followed by an examination of the communicative and discursive function of these maps. Here I focus on how crime maps produce specific representations of space (Lefebvre 1991) which homogenize urban communities as spaces of insecurity and crime. At the same time, crime maps simultaneously fragment community spaces into simple binaries of safe/unsafe, walkable/unwalkable, etc., which shape the ways in which people walk and act within depicted communities. The final section critically engages the role of racism in crime maps’ visual rendering of community spaces. Here I argue that a critical literacy of crime maps requires contextualizing crime maps within the racisms in the U.S. city (and elsewhere) to make sense of how crime maps reproduce racist representations of communities of color.
Territorial Stigmatization
Coined by Wacquant (2008) in his sociological studies on the ‘Black ghetto’ on Chicago’s South Side and the Banlieues in Paris, the concept of territorial stigmatization has evolved into a powerful tool in deciphering spatial tainting and its socio-economic, cultural, and political consequences for defamed urban spaces. Building on Bourdieu’s and Goffman’s work to develop a theory of how symbolic defamation and stigma operate spatially, Wacquant (2007) argues that territorial stigmatization operates through the evocation of overwhelmingly negative emotions, revulsion and condemnation toward urban spaces associated with high levels of violence, poverty and the presence of street-oriented youths who “do drugs”. This symbolic devaluation and denigration of urban communities is “[t]he output of specialists in symbolic production, including journalists, scholars, policy analysts and politicians” (Wacquant et al. 2014: 1275, original emphasis).
One area of research has particularly focused on how territorial stigmatization is produced through various practices, processes, and designs (Schultz Larsen and Delica 2019). Here, studies have deciphered how traditional media representations (e.g., newspapers or TV) reproduce negative and stigmatizing images of urban neighborhoods (Schwarze 2022a), while others have more recently started to focus on social media and newer technologies in the reproduction of territorial stigma (Butler et al. 2018). Yet, so far, little research has focused on visual designs, particularly cartographic representations, in the (re-)production of stigma (Raisborough et al. 2022; Harrison et al. 2021).
A second strand of research focuses on the underlying spatiality of territorial stigmatization (Sisson 2021), foregrounding how territorial stigmatization contributes to the production of (urban) spaces by shaping the ways in which these spaces are represented in public imaginaries and approached by people, the state, or private businesses. For example, the stigmatization of urban spaces “can become so powerful that it can shape the orientation of national housing and urban policies” (Slater 2021: 160).
A third and final theme discussed in scholarship on territorial stigmatization is the role of race and racism (Tyler 2020; Loyd and Bonds 2018). Processes of territorial stigmatization can_not_ be detached from questions of race and racism, particularly in contexts like Chicago and other U.S. cities (Shabazz 2015; Wilson 2018). Research has shown that territorial stigmatization in these urban contexts is always also enmeshed with racism where “territorial stigmatization reinforces racial boundaries through discursively framing black communities as violent ‘no-go’ zones” (Schwarze 2022a: 1423). Such framing, in turn, serves an ever-increasing state apparatus of social control, the politics of security, and police power which control, surveil and ultimately punish black communities in particular (Revier 2020).
Critical Cartography
Critical cartography provides a useful methodological framework for deciphering crime maps’ role in the reproduction of territorial stigmatization, for it emphasizes how power courses through cartographic representations and how political messages about space can be conveyed through maps (Crampton and Krygier 2006; Wood 1993). Maps are “rhetorical images” (Harley 2009) which do not simply replicate the world (Krygier and Wood 2009), but show a version of the world that is heavily influenced by the worldviews, beliefs and interests of their creators as well as the institutional constraints and restrictions under which mapmakers operate. For example, newspapers publish crime maps that merely depict homicides and shootings says something about the ways in which these papers as institutions also adhere to and reproduce certain values and norms in how urban spaces can be reduced to the representation of violence and crime, thereby reproducing territorial taint and stigma. Therefore, critical cartography argues that specific spatial knowledges and meanings are created through identifying, naming, categorizing, excluding and ordering (Crampton 2010: 45) in cartographic representations.
But crucially, the ability of maps to enact power is also determined by how these maps are interpreted, used, and mobilized by their readers. Kitchin and Dodge (2007) have argued that the important question about maps is not what maps are (e.g., spatial representations) or what maps do (e.g., the communication of spatial information), but rather how they develop and emerge through various practices by people studying maps. In this understanding, “maps are constantly in a stage of becoming; they are ontogenetic (emergent) in nature” (Kitchin and Dodge 2007: 340). Maps are consumed by people which influence their ways of seeing space as well as their practices, routines and behaviors within space depicted in maps. Thus, viewing maps purely as representations of space in specific moments of time would ignore maps’ characteristic as “mobile subjects” which also infuse “meaning through contested, complex, intertextual, and interrelated sets of socio-spatial practices” (Del Casino and Hanna 2006: 36).
Therefore, critical cartography foregrounds the agency of readers of maps and how their interpretation of cartographic representations needs to be scrutinized as much as the map-making process itself. This also has important implications for how crime maps reproduce territorial stigmatization as well as for developing a critical literacy of crime maps. The production of territorial stigma also depends on how people buy into and accept representations of space which only foreground crime and violence as the determining characteristics of urban spatiality. While it is certainly important to critique the discursive practices through which stigma is produced in, for example, media framings (Schwarze 2022a), it is equally critical to point out that readers of such media discourse play an active part in deciding whether they take such depictions at face value, or whether they develop a critical reading and understanding of the ways in which newspaper crime maps (and other media) reproduce stigmatizing representations of space. The following sections suggest ways in developing such critical literacy.
Persuasive Map Design of Crime Maps
A first step in developing a critical literacy of crime maps is to engage with the actual design of the maps. Cartographic scholarship on persuasive map design (Muehlenhaus 2012, 2014; Tyner 1982) suggests that the design of maps, whether intentionally or unintentionally, changes and influences the user’s opinions about the phenomenon depicted in the map: “[p]ersuasive maps are arguments that say ‘this is true,’ ‘vote for me,’ ‘buy me,’ ‘don’t go here’ and ‘this is bad’” (Tyner 2018: 439). Muehlenhaus (2012, 2014) argues that persuasive maps use different rhetorical styles in convincing their audiences that what they portray is true. One of these rhetorical styles is called underrated rhetorical style. Maps in this style “are datalight but look professional. They tend to represent only one or two levels of spatial information”. Moreover, “[i]f an element does not enhance the argument in any way, it is excluded” (Muehlenhaus 2014: 20).
In a similar way, the Chicago Sun-Times set of crime maps employs map design reflective of underrated rhetorical style (see Fig. 1).
Fig. 1
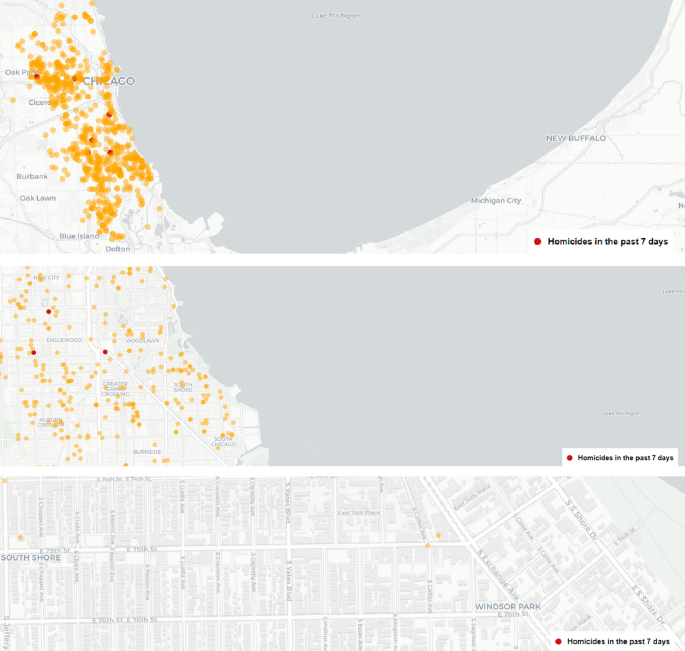
Screenshots of the interactive crime map from the Chicago Sun-Times homepage with different levels of Zoom depicting all homicides in 2022
This design limits its levels of spatial representation to minimal characteristics of the city, both visually and informationally. Visually, the entire city of Chicago is covered in dots indicating that a homicide happened there. In the map selection that is zoomed in all the way to the level of street blocks, the area is portrayed as a grey space with building shapes vaguely outlined, obfuscating any details of the urban morphology. As a result, the urban built environment is one homogeneous whitened mass, minimalist in design (Muehlenhaus 2012: 363).
Such simplicity in portraying space serves the purpose of abolishing everything that might distract from the most central feature of these maps: The colorful dots that depict homicides that have taken place in Chicago from a bird’s eye view. This bird’s eye view represents communities in such a way that people’s everyday lives and lived experiences are obscured and community spaces reduced to manageable entities. Scott (1998: 58) writes in this respect that “by virtue of its great distance, an aerial view resolved what might have seemed ground-level confusion into an apparently vaster order and symmetry.” In the context of mapping homicides, the causes and circumstances of the crime, the people affected, and how the crime impacted community residents are obscured and replaced by a colored dot on a map. In doing so, following Scott (1998: 58), “the grand plan of the ensemble” associated with visually representing homicides “has no necessary relationship to the order of life as it is experienced by its residents.” The use of the grid with its simple shapes from lines, right angles, to dots in crime maps portrays urban spaces as governable entities where the territoriality of a crime is the only information conveyed, reducing urban space to a “homogeneous, geometrical, uniform property” (Scott 1998: 58). Even zooming into the map does not take one further inside the community, nor does it visually emphasize spaces of non-violence; instead, zooming in serves a reductive purpose: getting a better idea and obtaining more information about where exactly a given homicide took place.
Against the whitened background of the map, these colorful dots immediately leap to the eye of the reader. In comparison with the size of the entire map, they are large and pronounced. They cover an extensive area of the physical space of the city, spanning entire street corners and intersections. Only by zooming in is it possible to identify more specifically which building, street corner or intersection exactly has been affected by violent crime. By clicking on one of the dots in the map by the Chicago Sun-Times, the reader is provided with some superficial background information about the homicide. If an article has been written about an individual homicide, the reader can read it. However, most of these articles are written in a transitive style which fail to provide the most basic information necessary to understand what happened. They do not inform about the circumstances, contexts, and, oftentimes, even people involved, merely describing where exactly in the city a homicide happened, thereby prioritizing the spatiality of violence over contextual information (Schwarze 2022a).
Here the colored dot stands in and replaces the complexity, diversity, and context of the community where the homicide happened as well as of the actual circumstances of the violent incident. The question that a reader of this crime map needs to ask here is: can a crime map adequately represent the underlying reasons for crime as well as the socio-cultural, political and economic complexity of surrounding communities? The answer must be ‘No’ because a bird’s eye map can_not_, as discussed above, provide such detailed information and contextualization. This was also not the intention of the map when it was designed in the first place. Keeping in mind this limitation of crime maps is, however, important, for it means that readers need to approach crime maps not as complex and detailed depictions of crime, violence and their underlying circumstances and contexts, but merely as visual representations of crime that have no purpose other than mapping homicides or other forms of crime on a flat surface.
The Power of Crime Maps
The clustering of overemphasized colored dots throughout the community creates an image in which it becomes—to paraphrase a popular saying about forests and trees—difficult to miss the community for the dots. It leaves the impression that violence does not just potentially lurk behind almost every street corner in the community; violence subsumes the street corner. The colored dot, superimposed on the street corner, takes it over temporally and spatially.
With this argument I do not wish to make “a case of trying to expose how maps are somehow ‘wrong’ or ‘untrue’” (Pinder 2003: 175). The homicides certainly did happen, and their locations in the community are presumably correct. Yet, the fundamental question is what useful information are provided by such maps? What should the reader of this map do with the information that on a specific street corner a person was killed? And, crucially, who is the audience imagined to consume the images and information that are mapped? (Kitchin and Dodge 2007; Del Casino and Hanna 2006). These are important questions in developing a critical literacy of crime maps.
One scenario is that a person unfamiliar with the community space where a homicide happened and who does not have any circumstantial information about this violent incident would probably hesitate to go to those places where someone was killed and only moves around in those places that have so far been spared from violence. Considering the excessive visualization and emphasizing of the dots in the crime maps, this would become more of running the gauntlet by the person who tries to avoid all those areas that have been affected by a homicide, like a maze with no true outlets.
Only if the person zoomed into the maps, as done in Fig. 1, they would realize that violence only takes place in very small, concentrated places—perhaps even within buildings rather than on the street—and not, despite the representation from city-wide and community-level maps, in large territories. But even then would the avoidance of those areas affected by shootings be a possible spatial practice (Lefebvre 1991). By foregrounding cartographic representations’ impact on spatial practices, the focus shifts from the mere production of geographical knowledge about space toward the implications of such knowledge for the interpretation and appropriation of urban spaces as a consequence of specific cartographic renderings (Kitchin and Dodge 2007: 338).
In this understanding, crime maps comprise “spectacles of fear” (Vujakovic 2018) that use emotionality in order to structure and predetermine the person’s spatial behavior. Crime maps follow similar tendencies in other mainstream media representations of crime and violence through, for example, CCTV or police body cam footages to sensationalize. Yet, instead of showing actual people affected by violence, crime maps add an almost scientific distance and authority to the representation of crime and violence, while visually reproducing an already established hegemonic discourse in media and public imaginaries about specific communities as already associated with violence and crime (Schwarze 2022a). Crime maps give further authority to these media discourses because they make crime and violence more accessible and concrete: the maps’ dots enact a simultaneous metonymy and synecdoche. Shootings are synonymous with these communities, and they come to mean a space comprised not just of but by violence. In this way, mapmakers are conjuring something already believed (by them and by their clients and consumers); i.e., that:
Crime maps are ultimately guided in their design and their use by what we already believe to be true about crime and urban space, and their visual language paints us into a corner of complicity; we can only respond in kind: the binary good/evil, safety/danger, black/white of law and order ideology that supports the infrastructure of map-making in the first place (Wallace 2009: 22).
In this way, crime maps project an authoritative reality onto community spaces that reduces space to the experience of violence and crime and projects an imaginary original of socio-spatiality onto urban spaces.
At the same time, the selectivity of maps in what they depict is, following Black (1997: 11), inevitable: “Maps are selective representations of reality; they have to be. Even if maps were to be life-size photographs they would be distortions: A three-dimensional, spherical object, such as the globe, cannot be presented in two dimensions without its essence being altered.” Yet, to highlight how power and discourse course through crime map-making and consumption of crime maps is not intended to suggest that power is pre-determined, linear, insuperable. On the contrary, the difficulties that inhere emphasize the importance of readers’ awareness and understanding of the limitations of cartographic visualizations and the power that courses through such simplistic representations of space. If readers do not question the knowledge production and representational practices of crime maps, they risk being complicit in the reproduction of territorial stigmatization toward communities depicted in these maps by taking crime maps at face value as representations of space and crime.
Moreover, readers and students of crime maps need to keep in mind the temporality of crime maps' representations. The homicides depicted happened in specific moments, within specific temporal frames with contexts and circumstances unique to each individual shooting. However, crime maps, by merely aggregating and spatially locating homicides which happened over the course of one year, temporally fix each homicide not only in its specific moment, but for a much longer time. After a homicide happened, its danger has no lingering effects because it remains visible on the map for as long as cartographers wish. Therefore, readers need to be aware that crime maps add a permanent endurance of danger to space because they constantly accumulate and visualize new homicides. The later in a year someone reads the map, the more fear is generated, the more stigma about specific communities is reproduced in public imaginaries, and the more people’s spatial practices of avoidance are enacted.
Racism and Cartographic Representations
My discussion has so far emphasized that crime maps, like images (Hall 1973), are never free of ideology. Crime maps, in this understanding, become visual regimes with coercive, normalizing and stigmatizing effects (Brown and Carrabine 2019) and possess denotative and connotative meanings (Hall 1973: 226): On the one hand, their “codes of denotation are precise, literal, unambiguous:” they visualize and locate violence across urban spaces. On the other hand, their connotative meaning allows for more open-ended interpretations of what crime maps signify to their readers. In this reading, crime maps demarcate and differentiate spaces of security and insecurity, providing cognitive frameworks in thinking about those spaces.
In the case of the _Chicago Sun-Times_’s crime map, cognitive frameworks not only refer to spaces of (in)security but also comprise other socio-spatial determinants. The paper offers its readers several interactive tools to change the design of its crime map and to foreground specific information (see Fig. 2).
Fig. 2
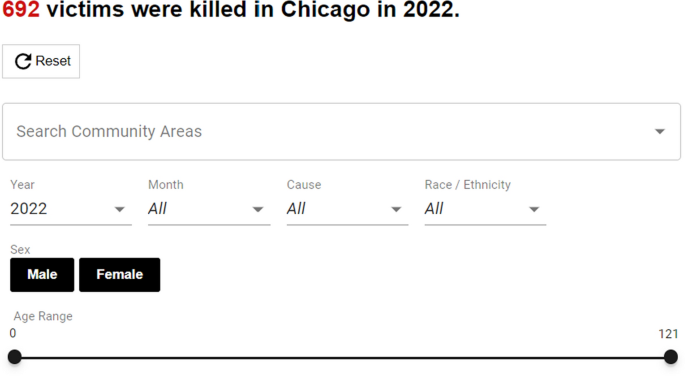
Screenshot of search bar of the crime map in the Chicago Sun-Times
It is possible to filter the map for community areas where homicides happened, what methods of homicide (e.g., shooting or stabbing) dominate in the city, the racial, ethnical, gender and age differences between homicide victims, and on which date and time the crime occurred.
The filter function ‘races/ethnicities’ deepens the stigmatization of African-American communities because it racializes the visual representations of crime and violence. Such filter suggests that races/ethnicities are somehow a determining factor in the experience of violence and crime, rather than socio-economic or structural factors such as poverty, marginalization or multiple deprivation (Wilson 2005; Voisin 2019). Figure 3 shows the spatial distribution of homicide victims across a selection of different ‘races/ethnicities’ in the map by the Chicago Sun-Times. Besides the four ‘races/ethnicities’ depicted in Fig. 3, ‘Other’, ‘Middle Eastern’, and ‘American Indian’ can also be selected. According to this map, black residents are disproportionately more likely to be killed through homicide.
Fig. 3
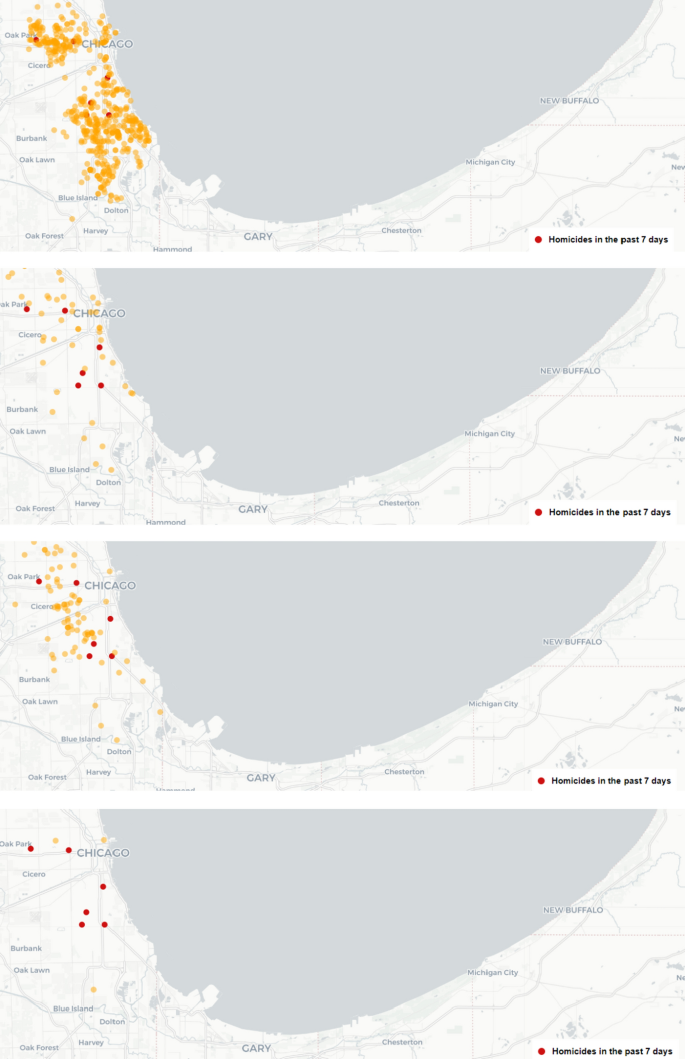
Screenshots of Chicago Sun-Times map for 2022 filtered for ‘race/ethnicity’. From top to bottom: ‘Black’, ‘White’, ‘Hispanic’, and ‘Asian’
The option to filter crime maps by ‘races/ethnicities’ serves a reductive purpose. Subsuming the terms ‘race’ and ‘ethnicity’ under the labels ‘Black’ or ‘Hispanic’ homogenizes cultural, class, and other differences and eliminates the plurality of identities. As Stuart Hall has powerfully remarked, “questions of identity are always questions about representation” (Hall 2001: 26) and “race is the modality in which class is lived” (Hall et al. 1978: 394). Therefore, this filter option essentializes crime as a property of blackness that is approached in advance as culturally pathological. As stated by Fatsis (2021: 144), such essentializing “twins race and crime by seeing crime as an attribute of race and making race a signifier of crime”.
These crime maps classify residents in such a way that certain ethnic characteristics can inform about the likelihood of victimization. Does ‘Hispanic’ denote Mexican, Puerto Rican, Salvadorian, etc.? What is the role of class differences in the experience and level of victimization more generally and within black communities more specifically? What is the relationship between race, class and the experience of violence and crime? The map does not say, and therefore the purpose of such filter functions remains elusive and unclear.
Following Hall (1985), these crime maps stigmatize by reproducing the manufacturing of consent (Gramsci 1971) that black communities are homogenous spaces of insecurity and crime, thereby also obfuscating and silencing the role of poverty politics, structural violence, multiple deprivations, and class differentiations for the occurrence and experience of violence and crime (Voisin 2019). The consequence of this common sense appeal (Sisson 2021 ) of crime maps is to normalize public perceptions of the necessity of law-and-order responses to high levels of crime and violence in these communities, intensifying the penal wing of the state and its policing through carceral governance practices (Alexander 2010; Muhammad 2010). In other words, crime maps, by differentiating between race/ethnicity in the experience of crime and violence, suggest that black communities need more and tougher policing to reduce crime rates, thereby obfuscating that the experience of crime and violence is not determined by the racial composition of communities but by socio-economic and structural circumstances of poverty and deprivation. Newspaper crime maps therefore intensify a public imaginary of danger, vice and dereliction (Wacquant 2008) associated with black communities which, in turn, “works in service of a policing apparatus that is increasingly organized around a positivist logic in which criminalized subjects and spaces are designated as no more than transposable objects of carceral administration” (Jefferson 2017: 785).
This critique of the reproduction of racist representations via crime maps is an important component of a critical literacy of crime maps, for it points toward underlying ideological assumptions and ways in which media discourses implicitly reproduce racist rhetoric and representations. While the crime map by the Chicago Sun-Times does not explicitly use racist language, readers nevertheless need to understand that this map operates within a racist socio-spatial context of segregation, marginalization and deprivation of black communities which becomes reproduced through cartographic images which reduce community spaces to violence and crime. Why, for example, did the Chicago Sun-Times decide to allow filtering the crime map for ‘race/ethnicity’ but not for ‘levels of poverty/deprivation’? It is important to understand that by including some filters and excluding others, this newspaper made a conscious decision about which aspects of violence and crime to foreground in cartographic representations. Scrutinizing such decisions is important when reading such crime maps because it allows students and readers to question how crime and violence are talked about in media discourses and how crime maps shape people’s views and understandings of crime and violence in urban spaces.
Conclusion and Discussion
This article offers a better level of verstehen (Ferrell 1997) of how crime maps are powerful images which convey specific ideological assumptions about the spatiality of crime and violence. This article has developed a critical literacy of crime maps, exploring how to make sense of their communicative function as tools for knowledge production on crime, violence and space. I have suggested several key premises and propositions that students of crime maps should keep in mind when viewing such maps to understand the limitations and problems of cartographically displaying crime.
Moreover, this article has suggested that critically engaging processes of territorial stigmatization adds a spatial dimension to the study of visual criminology and provides new perspectives on how images as “conveyors of complex emotional fields” (Brown 2014: 182) also produce spatial information. As argued by Carrabine (2014: 136), images, like maps, possess social and political functions and are in an “ideological interplay in wider systems of classification, control and order.” Crucially, the analysis of images of crime is not so much about what it means to depict crime through images, but rather how the image of crime works, what affect the image of crime engenders (Young 2014: 170). Visualizations of crime need to be studied against the backdrop of social, political, and cultural processes within society which shape the ways in which people think and speak about crime.
Therefore, the visual discursive practice of crime mapping “says something about a space” (Lefebvre 1991: 132), for it is through such representations that people make sense of space. This article has foregrounded how crime maps produce a perceived space (Lefebvre 1991), a space of the practico-sensual world in which activities of collective actors become inscribed into material objects and realities. Crime maps’ discursive spatial practice is persuasive because they depict crime and violence across urban spaces via simple techniques of visualization. Colored and overemphasized dots scattered across community maps are appealing representations because they do not require a deeper thought process or engagement with the socio-spatial realities of communities represented as ‘hotspot’ neighborhoods. These maps do not need to be studied in detail to understand their communicative and performative practice and function. Glancing over them is sufficient to seemingly understand the socio-spatial dynamics of violence and crime.
It is precisely because of the simplicity of crime maps that readers do not need invest much thought into what these maps tell us about crime and violence in community spaces. At the same time, this simplicity is also the reason why it is important to develop a critical literacy of the power of crime maps. Because crime maps simplify the complexity of urban crime through bird’s eye representations and visualizations, it is easy to accept these maps as impartial and objective visual renderings of crime without a deeper engagement with the underlying power dynamics of such representations. This article has suggested ways in which students can decipher the ideology and power of crime maps by scrutinizing their hegemony in normalizing and naturalizing crime and violence as intrinsic to certain spaces. Engaging with the spatiality of the visual, I have argued in this article, therefore adds important perspectives to the power of the image as a medium to convey common sense thinking about everyday life while simultaneously reproducing and sustaining unequal power relations in society (Barthes 1977). Recognizing the power of the image is important for a critical literacy of crime maps, to equip students with the necessary tools and instruments to decipher and, crucially, scrutinize maps’ visualizations of the spatiality of crime.
References
- Alexander, Michelle. 2010. The New Jim Crow. Mass Incarceration in the Age of Colorblindness. New York: The New Press.
Google Scholar - Barthes, Roland. 1977. Image-Music-Text. London: Fontana.
Google Scholar - Black, Jeremy. 1997. Maps and Politics. Chicago: University of Chicago Press.
Google Scholar - Brown, Michelle. 2014. “Visual Criminology and Carceral Studies: Counter-Images in the Carceral Age.” Theoretical Criminology 18 (2): 176–97.
Article Google Scholar - Brown, Elizabeth. 2017. “‘A Community Gets the Delinquents It Deserves’: Crime Mapping, Race and the Juvenile Court.” British Journal of Criminology 57: 1249–69.
Google Scholar - Brown, Michelle, and Eamonn Carrabine. 2017a. “Introducing Visual Criminology.” In Routledge International Handbook of Visual Criminology, by Michelle Brown and Eamonn Carrabine, 1–9. Milton Park, Abingdon, Oxon and New York, NY: Routledge.
- Brown, Michelle, and Eamonn Carrabine, eds. 2017b. Routledge International Handbook of Visual Criminology. Milton Park, Abingdon, Oxon and New York, NY: Routledge.
Google Scholar - Brown, Michelle, and Eamonn Carrabine. 2019. “The Critical Foundations of Visual Criminology: The State, Crisis, and the Sensory.” Critical Criminology 27: 191–205.
Article Google Scholar - Butler, Alice, Alex Schafran, and Georgina Carpenter. 2018. “What Does It Mean When People Call a Place a Shithole? Understanding a Discourse of Denigration in the United Kingdom and the Republic of Ireland.” Transactions of the Institute of British Geographers 43 (3): 496–510.
Article Google Scholar - Carrabine, Eamonn. 2012. “Just Images. Aesthetics, Ethics and Visual Criminology.” British Journal of Criminology 52: 463–89.
Article Google Scholar - Carrabine, Eamonn. 2014. “Seeing Things: Violence, Voyeurism and the Camera.” Theoretical Criminology 18 (2): 134–58.
Article Google Scholar - Del Casino, Vincent J., and Stephen P. Hanna. 2006. “Beyond The ‘Binaries’: A Methodological Intervention for Interrogating Maps as Representational Practices.” ACME: An International E-Journal for Critical Geographies 4 (1): 34–56.
Google Scholar - Chainey, Spencer, and Lisa Tompson. 2012. “Engagement, Empowerment and Transparency: Publishing Crime Statistics Using Online Crime Mapping.” Policing 6 (3): 228–39.
Article Google Scholar - Crampton, Jeremy W. 2010. Mapping. A Critical Introduction to Cartography and GIS. Chichester: John Wiley & Sons.
Google Scholar - Crampton, Jeremy W., and John Krygier. 2006. “An Introduction to Critical Cartography.” Cartography 4 (1): 11–33.
Google Scholar - Fatsis, Lambros. 2021. “Policing the Union’s Black. The Racial Politics of Law and Order in Contemporary Britain.” In Leading Works in Law and Social Justice, by Faith Gordon and Daniel Newman, 137–50. Milton Park, Abingdon, Oxon and New York, NY: Routledge.
- Ferrell, Jeff. 1997. “Criminological Verstehen: Inside the Immediacy of Crime.” Justice Quarterly 14 (1): 3–23.
Article Google Scholar - Gramsci, Antonio. 1971. Selections from the Prison Notebooks. New York: International Publishers.
Google Scholar - Hall, Stuart. 1985. “Signification, Representation, Ideology: Althusser and the Post‐structuralist Debates.” Critical Studies in Media Communication 2 (2): 91–114.
Google Scholar - Hall, Steve, Charles Critcher, Tony Jefferson, John Clarke, and Brian Roberts. 1978. Policing the Crisis: Mugging, the State and Law and Order. London: Macmillan.
Book Google Scholar - Hall, Stuart. 1973. “The Determination of News Photographs.” In The Manufacture of News: Deviance, Social Problems and the Mass Media, by Stanley Cohen and Jock Young, 226–43. London: Constable.
- Hall, Stuart. 2001. Negotiating Caribbean Identities. New Left Review 24–39.
- Harley, J.B. 2009. “Maps, Knowledge, and Power.” In Geographic Thought. A Praxis Perspective, edited by George Henderson and Marvin Waterston, 129–48. Milton Park, Abingdon, Oxon and New York, NY: Routledge.
- Harrison, Katherine, Jayne Raisborough, and Lisa Taylor. 2021. “From Streetscapes to Sofas: Representations of Place and Space in Britain’s Benefit Blackspots.” Sociological Research Online 26 (2): 377–93.
Article Google Scholar - Hayward, Keith. 2004a. City Limits: Crime, Consumer Culture and the Urban Experience. London: The Glass House Press.
Google Scholar - Hayward, Keith. 2004b. “Space - The Final Frontier.” In Cultural Criminology Unleashed, edited by Jeff Ferrell, Keith Hayward, Wayne Morrision, and Mike Presdee, 155–66. London: The Glass House Press.
Google Scholar - Hayward, Keith. 2012. “Five Spaces of Cultural Criminology.” British Journal of Criminology 52: 441–62.
Article Google Scholar - Herbert, Steve, and Elizabeth Brown. 2006. “Conceptions of Space and Crime in the Punitive Neoliberal City.” Antipode 28 (4): 755–77.
Article Google Scholar - Herrity, Kate, Bethany E. Schmidt, and Jason Warr, eds. 2021. Sensory Penalities: Exploring the Senses in Spaces of Punishment and Social Control. Bingley: Emerald Publishing Limited.
Google Scholar - Jefferson, Brian Jordan. 2017. “Digitize and Punish: Computerized Crime Mapping and Racialized Carceral Power in Chicago.” Environment and Planning D: Society and Space 35 (5): 775–96.
Article Google Scholar - Kindynis, Theo. 2014. “Ripping Up the Map. Criminology and Cartography Reconsidered.” British Journal of Criminology 54: 222–43.
Article Google Scholar - Kitchin, Rob, and Martin Dodge. 2007. “Rethinking Maps.” Progress in Human Geography 31 (3): 331–44.
Article Google Scholar - Krygier, John, and Dennis Wood. 2009. “Ce n’est Pas Le Monde (This Is Not the World).” In Rethinking Maps. New Frontiers in Cartographic Theory, edited by Martin Dodge, Rob Kitchin, and Chris Perkins, 189–219. Milton Park, Abingdon, Oxon and New York, NY: Routledge.
- Lefebvre, Henri. 1991. The Production of Space. Malden: Blackwell Publishing Ltd.
Google Scholar - Lefebvre, Henri. 1975. “What Is the Historical Past?” New Left Review I/90 (Mar/Apr): 27–34.
- Linnemann, Travis. 2017. “Proof of Death: Police Power and the Visual Economies of Seizure, Accumulation and Trophy.” Theoretical Criminology 21 (1): 57–77.
Article Google Scholar - Loyd, Jenna M., and Anne Bonds. 2018. “Where Do Black Lives Matter? Race, Stigma, and Place in Milwaukee, Wisconsin.” The Sociological Review 66 (4): 898–918.
Article Google Scholar - Luger, Jason, and Tilman Schwarze. 2021. “Cafés, Cocktail Coves, and ‘Empathy Walls’: Comparing Urban and Exurban Everyday Life through a Lefebvrian Lens.” Geoforum 127: 151–61.
Article Google Scholar - Moncada, Eduardo. 2010. “Counting Bodies: Crime Mapping, Policing and Race in Colombia.” Ethic and Racial Studies 33: 696–716.
Article Google Scholar - Muehlenhaus, Ian. 2012. “If Looks Could Kill: The Impact of Different Rhetorical Styles on Persuasive Geocommunication.” The Cartographic Journal 49 (4): 362–75.
Article Google Scholar - Muehlenhaus, Ian. 2014. “Going Viral: The Look of Online Persuasive Maps.” Cartographica 49 (1): 18–34.
Article Google Scholar - Muhammad, Khalil Gibran. 2010. The Condemnation of Blackness. Race, Crime, and the Making of Modern Urban America. Cambridge, MA and London, UK: Harvard University Press.
Book Google Scholar - Neocleous, Mark. 2003. “Off the Map. On Violence and Cartography.” European Journal of Social Theory 6 (4): 409–25.
Article Google Scholar - Peršak, Nina, and Anna Di Ronco, eds. 2021. Harm and Disorder in the Urban Space Social Control, Sense and Sensibility. Milton Park, Abingdon, Oxon and New York, NY: Routledge.
Google Scholar - Pinder, David. 2003. “Mapping Worlds. Cartography and the Politics of Representation.” In Cultural Geography in Practice, edited by Alison Blunt, Pyrs Gruffudd, Jon May, Miles Ogborn, and David Pinder, 172–87. London: Edward Arnold (Publishers) Ltd.
- Raisborough, Jayne, Lisa Taylor, and Katherine Harrison. 2022. “The Cutaway to the Toilet: Towards a Visual Grammar of Spatial Stigma in Factual Welfare Television.” Sociological Research Online, 1–19.
- Ratcliffe, Jerry H. 2002. “Damned If You Don’t, Damned If You Do: Crime Mapping and Its Implications in the Real World.” Policing and Society. An International Journal of Research and Policy 12 (3): 211–25.
Google Scholar - Ratcliffe, Jerry H. 2004. “Crime Mapping and the Training Needs of Law Enforcement.” European Journal on Criminal Policy and Research 10: 65–83.
Article Google Scholar - Revier, Kevin. 2020. “‘Now You’re Connected’: Carceral Visuality and Police Power on MobilePatrol.” Theoretical Criminology 24 (2): 314–34.
Article Google Scholar - Rosenbaum, Dennis P. 2006. “The Limits of Hot Spots Policing.” In Police Innovation: Contrasting Perspectives, by David L. Weisburd and Anthony A. Braga, 245–63. Cambridge: Cambridge University Press.
- Schultz Larsen, Troels, and Kristian Nagel Delica. 2019. “The Production of Territorial Stigmatisation. A Conceptual Cartography.” City 23 (4–5): 540–463.
Article Google Scholar - Schwarze, Tilman. 2022a. “Discursive Practices of Territorial Stigmatization: How Newspapers Frame Violence and Crime in a Chicago Community.” Urban Geography 43 (9): 1415–36.
Article Google Scholar - Schwarze, Tilman. 2022b. “Gangs, Space and the State. Bringing Henri Lefebvre’s Spatial Theory to Critical Gang Studies.” In Routledge International Handbook of Critical Gang Studies, by David C. Brotherton and Rafael Jose Gude, 89–107. Milton Park, Abingdon, Oxon and New York, NY: Routledge.
- Schwarze, Tilman. forthcoming. Space, Urban Politics, and Everyday Life. Henri Lefebvre and the U.S. City. Cham: Palgrave MacMillan.
- Scott, James C. 1998. Seeing Like a State: How Certain Schemes to Improve the Human Condition Have Failed. New Haven: Yale University Press.
Google Scholar - Shabazz, Rashad. 2015. Spatializing Blackness. Architectures of Confinement and Black Masculinity in Chicago. Urbana, Chicago and Springfield: University of Illinois Press.
Book Google Scholar - Sisson, Alistair. 2021. “Territory and Territorial Stigmatisation: On the Production, Consequences and Contestation of Spatial Disrepute.” Progress in Human Geography 45 (4): 659–81.
Article Google Scholar - Slater, Tom. 2021. Shaking up the City. Ignorance, Inequality, and the Urban Question. Berkeley, California: University of California Press.
- Tyler, Imogen. 2020. Stigma. The Machinery of Inequality. London: Zed Books.
Book Google Scholar - Tyner, Judith. 1982. “Persuasive Cartography.” Journal of Geography 81 (4): 140–44.
Article Google Scholar - Tyner, Judith. 2018. “Persuasive Map Design.” In The Routledge Handbook of Mapping and Cartography, edited by Alexander Kent and Peter Vujakovic, 439–49. Milton Park, Abingdon, Oxon and New York, NY: Routledge.
Google Scholar - Vigneswaran, Darshan. 2014. “The Contours of Disorder: Crime Maps and Territorial Policing in South Africa.” Environment and Planning D: Society and Space 32 (1): 91–107.
Article Google Scholar - Voisin, Dexter R. 2019. America the Beautiful and Violent. Black Youth & Neighborhood Trauma in Chicago. New York and Chichester, West Sussex: Columbia University Press.
Google Scholar - Vujakovic, Peter. 2018. “The Map as Spectacle.” In The Routledge Handbook of Mapping and Cartography, edited by Alexander Kent and Peter Vujakovic, 101–13. Milton Park, Abingdon, Oxon and New York, NY: Routledge.
Google Scholar - Wacquant, Loïc. 2007. “Territorial Stigmatization in the Age of Advanced Marginality.” Thesis Eleven 91 (1): 66–77.
Article Google Scholar - Wacquant, Loïc. 2008. Urban Outcasts. A Comparative Sociology of Advanced Marginality. Cambridge and Malden: Polity Press.
Google Scholar - Wacquant, Loïc, Tom Slater, and Virgílio Borges Pereira. 2014. “Territorial Stigmatization in Action.” Environment and Planning A 46 (6): 1270–80.
Article Google Scholar - Wallace, Aurora. 2009. “Mapping City Crime and the New Aesthetic of Danger.” Journal of Visual Culture 8 (1): 5–24.
Article Google Scholar - Warr, Deborah J. 2005. “There Goes the Neighbourhood: The Malign Effects of Stigma.” Social City 19: 1–11.
Google Scholar - Wheeldon, Johannes. 2022. Visual Criminology. From History and Methods to Critique and Policy Translation. New York and Milton Park, Abingdon, Oxon: Routledge.
Google Scholar - Wilson, David. 2005. Inventing Black-on-Black Violence. Discourse, Space, and Representation. New York: Syracuse University Press.
Google Scholar - Wilson, David. 2018. Chicago’s Redevelopment Machine and Blues Clubs. Cham, Switzerland: Palgrave MacMillan.
Book Google Scholar - Wood, Dennis. 1993. The Power of Maps. London: Routledge.
Book Google Scholar - Young, Alison. 2014. “From Object to Encounter: Aesthetic Politics and Visual Criminology.” Theoretical Criminology 18 (2): 159–75.
Article Google Scholar