Quantifying Economic Dependency (original) (raw)
Abstract
In this paper we compare several types of economic dependency ratios for a selection of European countries. These dependency ratios take into account not only the demographic structure of the population, but also the differences in age-specific economic behaviour such as labour market activity, income and consumption as well as age-specific public transfers. In selected simulations where we combine patterns of age-specific economic behaviour and transfers with population projections, we show that in all countries population ageing would lead to a pronounced increase in dependency ratios if present age-specific patterns were not to change. Our analysis of cross-country differences in economic dependency demonstrates that these differences are driven by both differences in age-specific economic behaviour and in the age composition of the populations. The choice of which dependency ratio to use in a specific policy context is determined by the nature of the question to be answered. The comparison of our various dependency ratios across countries gives insights into which strategies might be effective in mitigating the expected increase in economic dependency due to demographic change.
Access this article
Subscribe and save
- Starting from 10 chapters or articles per month
- Access and download chapters and articles from more than 300k books and 2,500 journals
- Cancel anytime View plans
Buy Now
Price excludes VAT (USA)
Tax calculation will be finalised during checkout.
Instant access to the full article PDF.
Fig. 1
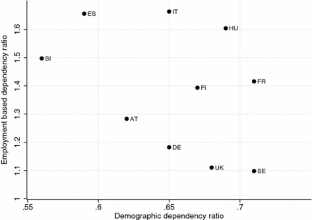
The alternative text for this image may have been generated using AI.
Source EUROSTAT; EU-SILC 2011 and Population 1st of January
Fig. 2
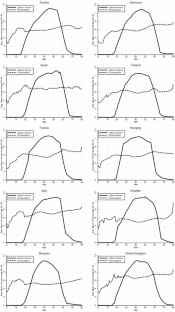
The alternative text for this image may have been generated using AI.
Source www.ntaccounts.org
Fig. 3
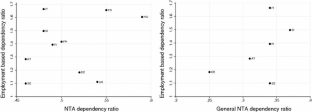
The alternative text for this image may have been generated using AI.
Source EU-SILC 2011 (employment and labour income); www.ntaccounts.org (consumption)
Fig. 4
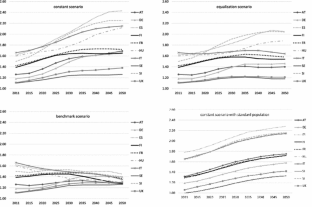
The alternative text for this image may have been generated using AI.
Source EU-SILC, 2011, own employment projections; Eurostat, EUROPOP2013 (2050), main scenario
Fig. 5
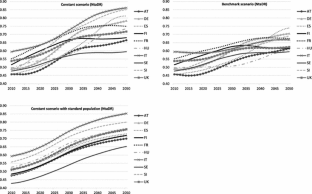
The alternative text for this image may have been generated using AI.
Source EU-SILC, 2011; www.ntaccounts.org, own NTA projections; Eurostat, EUROPOP2013 (2050), main scenario
Fig. 6
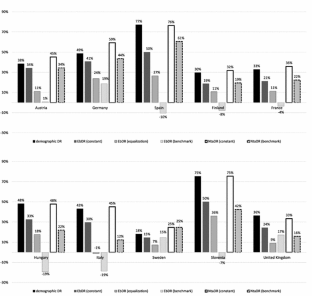
The alternative text for this image may have been generated using AI.
Source EUROSTAT (population data); EU-SILC 2011 (EbDR); EU-SILC 2011, www.ntaccounts.org (NtaDR)
Fig. 7

The alternative text for this image may have been generated using AI.
Source EUROSTAT (population data); EU-SILC 2011 (EbDR); EU-SILC 2011, www.ntaccounts.org (NtaDR, \(NtaDR_{ABR}\), DRpub)
Notes
- Source EUROPOP 2013, main scenario.
- In order to be consistent, we chose EU-SILC as data source for economic activity since this is also our data source for labour income (cf. Table 9).
- For detailed description of the NTA results for Finland, Germany, Hungary, Slovenia, Spain and Sweden see Lee and Mason (2011). For the Italian data see Zannella (2013) and for Austria see Hammer (2014).
- The use of consumption age profiles from different years should not affect our results much. The historical NTA data show that the shape of the age profiles changes only slowly with time, see, e.g. Hammer (2014) for Austria from 1995 to 2010. Furthermore, consumption of adults is rather constant over the whole adult age range.
- Transfer inflows and outflows are recorded from the individuals point of view: inflows constitute the benefits, outflows the contributions to the transfer systems. Public transfer inflows consist, for example, of benefits such as pensions, health services or child benefits while the public transfer outflows consist mainly of taxes and social contributions.
- Labour income from self-employment comprises part of mixed income (income of non-incorporated firms). In NTA 2/3 of mixed income is allocated to labour and 1/3 to capital income.
- NTA capture only current transfers. Capital transfers such as bequests are not directly captured, but through the income which they generate for their owners.
- Age-specific asset-based reallocations are not available for France and Hungary. The definition of NTA flows excludes capital transfers; however, in the case of the UK, bequests have been included as transfers. This difference in the methodology affects the comparability of the savings variable, as its estimation relies on income, consumption and transfer estimates. In the case of Spain, public transfers have been defined in a non-comparable way, which again affects the estimates of age-specific savings. We therefore do not include these four countries in our comparison of the general dependency ratio.
- We calculated the NTA dependency ratio and the NTA general dependency ratio also for the year 2005. The results are very similar, and in particular the relative position of the countries does not change. We conclude that these indicators are robust regarding changes in the macro-economic environment.
- TGI is the abbreviation for Transfers Government Inflows, TGO for Transfers Government Outflows.
References
- Bengtsson, T. (Ed.). (2010). Population ageing—a threat to the welfare state? The case of Sweden. Springer.
- Cutler, D. M., Poterba, J. M., Sheiner, L. M., & Summers, L. H. (1990). An aging society: Opportunity or challenge? Brooking Papers on Economic Activity, 21(1), 1–74.
Article Google Scholar - European Commission. (2012). Demography, active ageing and pensions. Social Europe guide, 3.
- European Commission. (2014). The 2015 ageing report: Underlying assumptions and projection methodologies. European Economy, 8.
- Hammer, B. (2014). The economic life course: An examination using national transfer accounts. Ph.D. thesis, Vienna University of Technology.
- Hammer, B., Prskawetz, A., & Freund, I. (2015). Production activities and economic dependency by age and gender in Europe: A cross-country comparison. The Journal of the Economics of Ageing, 5, 86–97.
Article Google Scholar - Lee, R., Lee, S.-H., & Mason, A. (2006). Charting the economic life cycle. NBER Working Paper No. 12379.
- Lee, R., & Mason, A. (2013). Reformulating the support ratio to reflect asset income and transfers. In Extended abstract for the Annual meeting of the Population Association of America. New Orleans, LA, 11–13 April 2013.
- Lee, R. D., & Mason, A. (Eds). (2011). Population aging and the generational economy: A global perspective. Edward Elgar Pub.
- Mason, A. (2005). Demographic transition and demographic dividends in developed and developing countries. In United Nations Expert Group meeting on social and economic implications of changing population age structures. Mexico City, 31 August–2 September 2005.
- Mason, A. (2013). Reformulating the support ratio to reflect asset income and transfers. In Paper presented at the PAA 2013 Annual Meeting. New Orleans, LA, 11–13 April 2013.
- Mason, A., Lee, R., Tung, A.-C., Lai, M.-S., & Miller, T. (2006). Population aging and intergenerational transfers: Introducing age into national accounts. NBER Working Paper No. 12770.
- Mason, A., & Lee, R. D. (2004). Reform and support systems for the elderly in developing countries: Capturing the second demographic dividend. In Paper prepared for the “International Seminar on the Demographic Window and Health Aging: Socioeconomic Challenges and Opportunities” at the China Centre for Economic Research. Peking University, Beijing, 10–11 May 2004.
- Prskawetz, A., & Sambt, J. (2014). Economic support ratios and the demographic dividend in Europe. Demographic Research, 30(34), 963–1010.
Article Google Scholar - Sanderson, W. C., & Scherbov, S. (2015). Are we overly dependent on conventional dependency ratios? Population and Development Review, 41(4), 687–708.
Article Google Scholar - Spijker, J. (2015). Alternative indicators of population ageing: An inventory. Vienna Institute of Demography Working Papers 4/2015.
- Austria, S. (2014). Vergleich der Bevoelkerungsprognosen von Eurostat und Statistik Austria. Presentation zur 7. Sitzung der Kommission zur langfristigen Pensionssicherung. 22. April 2014. Statistik Austria.
- UN., (2013). National transfer accounts manual: Measuring and analysing the generational economy. Department of Economic and Social Affairs, Population Division: United Nations.
- Vaupel, J. W., & Loichinger, E. (2006). Redistributing work in aging Europe. Science, 312, 1911–1913.
Article Google Scholar - Zannella, M. (2013). Economic life cycle and intergenerational transfers in Italy. The gendered dimension of production and the value of unpaid domestic time. Ph.D. thesis, Sapienza Università di Roma.
Acknowledgements
The research leading to these results has received funding from the European Commission’s Seventh Framework Programme FP7/2007–2013 under grant agreement No. 290647. It has also been supported by funding from the European Union’s Seventh Framework Programme for research, technological development and demonstration under grant agreement No. 613247. This paper uses data from the European Union Statistics on Income and Living Conditions (EU-SILC; cross-sectional EU-SILC UDB—version from August 01, 2013). We herewith acknowledge data provision for EU-SILC by EUROSTAT and the European Commission, respectively. Presented results and drawn conclusions are those of the authors and not those of EUROSTAT, the European Commission or any of the national authorities whose data have been used.
Author information
Authors and Affiliations
- College of Population Studies, Chulalongkorn University, Bangkok, Thailand
Elke Loichinger - Institute of Statistics and Mathematical Methods in Economics, Vienna University of Technology, Vienna, Austria
Alexia Prskawetz & Michael Freiberger - Wittgenstein Centre for Demography and Global Human Capital, (IIASA, VID/OeAW, WU), Vienna, Austria
Elke Loichinger, Bernhard Hammer & Alexia Prskawetz - Faculty of Economics, University of Ljubljana, Ljubljana, Slovenia
Joze Sambt - Vienna Institute of Demography, Vienna, Austria
Bernhard Hammer & Alexia Prskawetz
Authors
- Elke Loichinger
- Bernhard Hammer
- Alexia Prskawetz
- Michael Freiberger
- Joze Sambt
Corresponding author
Correspondence toElke Loichinger.
Appendix: Employment Patterns by Age and Sex
Appendix: Employment Patterns by Age and Sex
Tables 8 and 9 and Figs. 8 and 9.
Fig. 8
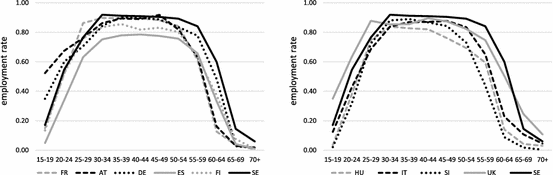
The alternative text for this image may have been generated using AI.
Source EU-SIlC 2011 (based on self-defined activity status)
Age-specific employment rates, men, 2011
Fig. 9
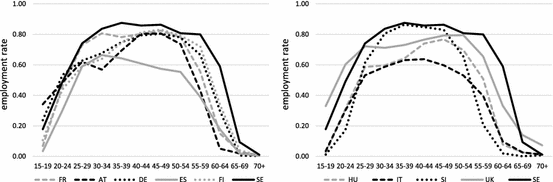
The alternative text for this image may have been generated using AI.
Source EU-SIlC 2011 (based on self-defined activity status)
Age-specific employment rates, women, 2011
Table 8 Employment-based dependency ratios by economic status, 2005
Table 9 Overview: data sources
Rights and permissions
About this article
Cite this article
Loichinger, E., Hammer, B., Prskawetz, A. et al. Quantifying Economic Dependency.Eur J Population 33, 351–380 (2017). https://doi.org/10.1007/s10680-016-9405-1
- Received: 23 March 2015
- Accepted: 03 November 2016
- Published: 27 January 2017
- Issue date: July 2017
- DOI: https://doi.org/10.1007/s10680-016-9405-1