The Juno Waves Investigation (original) (raw)
Abstract
Jupiter is the source of the strongest planetary radio emissions in the solar system. Variations in these emissions are symptomatic of the dynamics of Jupiter’s magnetosphere and some have been directly associated with Jupiter’s auroras. The strongest radio emissions are associated with Io’s interaction with Jupiter’s magnetic field. In addition, plasma waves are thought to play important roles in the acceleration of energetic particles in the magnetosphere, some of which impact Jupiter’s upper atmosphere generating the auroras. Since the exploration of Jupiter’s polar magnetosphere is a major objective of the Juno mission, it is appropriate that a radio and plasma wave investigation is included in Juno’s payload. This paper describes the Waves instrument and the science it is to pursue as part of the Juno mission.
The Juno Mission
Article 02 November 2017
1 Introduction
The existence of a magnetosphere at Jupiter was known from ground-based radio astronomical observations dating back to 1955 with the discovery by Burke and Franklin (1955) that Jupiter was a radio source at 22.2 MHz. More than six decades later a spacecraft-borne radio astronomy instrument called Waves will provide the first in situ measurements of the source of the radio emissions discovered by Burke and Franklin and help Juno to make the first exploration of the polar regions of Jupiter’s magnetosphere. Juno’s high latitude view will also inform our understanding of beaming patterns of radio emissions and the geometry of sources, for example, the lead angles of satellite footprint auroras. Waves will also examine for the first time plasma waves, particularly on auroral field lines, that are thought to accelerate and otherwise interact with energetic particles involved in creating Jupiter’s intense auroras.
1.1 Exploring Jupiter’s Polar Magnetosphere and Aurora
Juno’s unique polar orbit is critical to answering the fundamental questions of how Jupiter’s auroras are generated (Bagenal et al. [2014](/article/10.1007/s11214-017-0396-y#ref-CR3 " F. Bagenal, A. Adriani, F. Allegrini, S.J. Bolton, B. Bonfond, E.J. Bunce, J.E.P. Connerney, S.W.H. Cowley, R.W. Ebert, G.R. Gladstone, C.J. Hansen, W.S. Kurth, S.M. Levin, B.H. Mauk, D.J. McComas, C.P. Paranicas, D. Santos-Costa, R.M. Thorne, P. Valek, J.H. Waite, P. Zarka, Magnetospheric science objectives of the Juno mission. Space Sci. Rev. (2014). doi: 10.1007/s11214-014-0036-8
                                ")). Previous missions were confined to low latitudes although Ulysses did provide brief coverage at moderate latitudes. Following a project decision to not lower the orbital period to 14 days, Juno’s highly eccentric science orbits have a period of about 53 days with apojove near 113 Jovian radii (\\(\\mathrm{R}\_{\\mathrm{J}} = 71{,}492\~\\mbox{km}\\)) and perijove near 1.06 RJ. The initial line of apsides is nearly in the equatorial plane near the dawn meridian. The line of apsides rotates about \\(1^{\\circ}\\) each orbit with the apojove moving south and the perijove moving north. Through the planned 32 science orbits the apojove will move through the anti-sunward direction and into the post-dusk sector. Juno’s orbit crosses postulated auroral field lines at a range of very low altitudes that almost certainly include the expected auroral acceleration region and sources of auroral radio emissions. This trajectory enables Juno to determine the physical processes occurring in the high latitude magnetosphere and allows us to relate them to auroral activity and to our understanding of the equatorial magnetosphere. At Earth, auroras are primarily driven by the energy of the solar wind. At Jupiter, the primary energy source is the rotation of the planet, but a second source is the motion of the Galilean satellites Io, Europa, and Ganymede (and perhaps Callisto) across rotating Jovian magnetic field lines. The solar wind also plays a role in auroral phenomena at Jupiter (cf. Zarka and Genova [1983](/article/10.1007/s11214-017-0396-y#ref-CR90 "
                P. Zarka, F. Genova, Low frequency jovian emission and solar wind magnetic sector structure. Nature 306, 767–768 (1983)
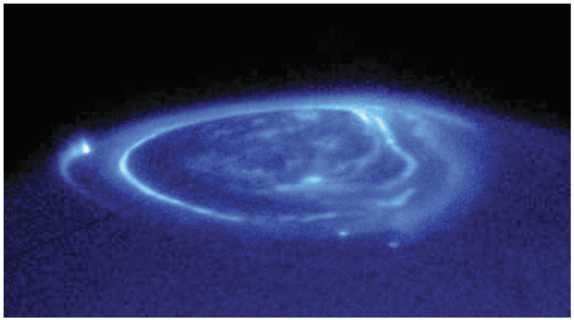
            ")). These three sources are apparently reflected in the three types of auroras observed at Jupiter (Fig. [1](/article/10.1007/s11214-017-0396-y#Fig1)).
Fig. 1
A Hubble Space Telescope image of the UV aurora in Jupiter’s northern hemisphere. The well-defined and mostly continuous ring is referred to as the main oval. The bright spot with a tail equatorward of the main oval on the left is Io’s footprint and wake aurora. Dimmer spots near the bottom are footprint auroras from Europa and Ganymede. The emissions poleward of the main oval are the polar auroras. From Clarke et al. (2002)
Main auroral oval. These emissions encircle the north and south magnetic poles and are thought to be the result of field aligned currents enforcing the planet’s rotation on magnetospheric plasma (Hill 1979).
Satellite footprint (and wake) auroras. These emissions emanate from the base of magnetic flux tubes connected to the Galilean satellites (Sauer et al. 2004).
Polar auroras. These sporadic emissions are poleward of the main oval, possibly on field lines connecting to the solar wind or plasmoids in the deep magnetotail (Pallier and Prangé 2001, 2004).
There are a number of significant differences between the Jovian and terrestrial magnetospheres including, but not limited to (1) the magnitude of the planetary magnetic field, hence, the size of the magnetosphere; (2) the distance from the Sun, another factor increasing the size of Jupiter’s magnetosphere due to the reduced solar wind ram pressure; (3) the source of plasma with Earth’s being a combination of primarily solar wind and ionospheric sources and Jupiter’s dominated by Io’s volcanic emissions; (4) the primary energy driving the magnetosphere being the solar wind at Earth and the rapidly rotating planet at Jupiter; and (5) the presence of substantial moons orbiting the planet at Jupiter, deep within the magnetosphere, whereas Earth’s moon’s only magnetospheric interaction is with the distant magnetotail. Despite these and other differences, it is believed that the Jovian and terrestrial auroras have similar processes at their root: strong electric currents flowing along the magnetic field and electromagnetic fields accelerating the charged particles that bombard the upper atmosphere. These currents transfer momentum between the upper atmosphere and distant magnetosphere and perhaps the solar wind.
1.2 Auroral Radio Emissions
Jupiter is the brightest planetary radio source in the solar system and rivals the Sun in radio intensity. Excluding the synchrotron radio emissions from Jupiter’s inner magnetosphere which will be measured with the Microwave Radiometer (MWR) instrument on Juno (Janssen et al. [2017](/article/10.1007/s11214-017-0396-y#ref-CR44 " M. Janssen et al., MWR: Microwave Radiometer for the Juno Mission to Jupiter. Space Sci. Rev. (2017). doi: 10.1007/s11214-017-0349-5
                                ")), Jupiter’s radio spectrum (see Fig. [2](/article/10.1007/s11214-017-0396-y#Fig2)) extends from a few kHz to approximately 40 MHz (Zarka et al. [2004](/article/10.1007/s11214-017-0396-y#ref-CR91 "
                P. Zarka, B. Cecconi, W.S. Kurth, Jupiter’s low-frequency radio spectrum from Cassini/Radio and Plasma Wave (RPWS) absolute flux density measurements. J. Geophys. Res. 109, A09S15 (2004)
            ")) comprising a small zoo of different phenomena shown in Fig. [3](/article/10.1007/s11214-017-0396-y#Fig3). These radio emissions are strongly modulated by Jupiter’s rotation and some of them are also controlled by the orbital location of Io (Bigg [1964](/article/10.1007/s11214-017-0396-y#ref-CR7 "
                E.K. Bigg, Influence of the satellite Io on Jupiter’s decametric emission. Nature 203, 1008–1010 (1964)
            ")). The decametric, hectometric, and broadband kilometric radio emissions are generated in the polar region as part of the auroral particle acceleration processes, hence, are sometimes referred to as auroral radio emissions (Genova et al. [1987](/article/10.1007/s11214-017-0396-y#ref-CR24 "
                F. Genova, P. Zarka, C.H. Barrow, Voyager and Nancay observations of the jovian radio emission at different frequencies: Solar wind effect and source extent. Astron. Astrophys. 182, 159–162 (1987)
            "), [1989](/article/10.1007/s11214-017-0396-y#ref-CR25 "
                F. Genova, P. Zarka, A. Lecacheux, Jupiter decametric radiation, in Time-Variable Phenomena in the Jovian System, ed. by M.J.S. Belton, R.A. West, J. Rahe (NASA, Washington, D.C., 1989), pp. 156–174, SP-494
            "); Ladreiter et al. [1994](/article/10.1007/s11214-017-0396-y#ref-CR54 "
                H.P. Ladreiter, P. Zarka, A. Lecacheux, Direction-finding study of Jovian hectometric and broadband kilometric radio emissions: Evidence for their auroral origin. Planet. Space Sci. 42, 919–931 (1994)
            "); Zarka et al. [2001](/article/10.1007/s11214-017-0396-y#ref-CR92 "
                P. Zarka, J. Queinnec, F.J. Crary, Low-frequency limit of Jovian radio emissions and implications on source locations and Io plasma wake. Planet. Space Sci. 49, 1137–1149 (2001)
            ")). Interesting emissions, likely part of the broadband kilometric radio spectrum are the ‘bullseyes’ reported by Kaiser and MacDowall ([1998](/article/10.1007/s11214-017-0396-y#ref-CR46 "
                M.L. Kaiser, R.J. MacDowall, Jovian radio “bullseyes” observed by Ulysses. Geophys. Res. Lett. 25, 3113–3116 (1998)
            ")). These appear to be related to solar wind pressure pulses given their tendency to appear in groups every 25 to 27 days. Individual pulses occur at longer periods than Jupiter’s rotation rate, hence, may be related to the Io torus or even Ganymede’s interaction with the Jovian magnetic field. Narrowband kilometric radiation is generated on the edge of the Io plasma torus (Reiner et al. [1993](/article/10.1007/s11214-017-0396-y#ref-CR74 "
                M.J. Reiner, J. Fainberg, R.G. Stone, M.L. Kaiser, M.D. Desch, R. Manning, P. Zarka, B.-M. Pedersen, Source characteristics of Jovian narrow-band kilometric radio emissions. J. Geophys. Res. 98, 13163–13176 (1993)
            ")). A much lower frequency ‘continuum’ radiation is largely trapped in Jupiter’s outer magnetospheric plasma density cavity (Gurnett et al. [1981](/article/10.1007/s11214-017-0396-y#ref-CR33 "
                D.A. Gurnett, F.L. Scarf, W.S. Kurth, R.R. Shaw, R.L. Poynter, Determination of Jupiter’s electron density profile from plasma wave observations. J. Geophys. Res. 86, 8199–8212 (1981)
            ")). Finally, a low-frequency emission with quasi-periods in the range of a few to 40 minutes exists, but its source is still largely unknown with some evidence pointing to the distant high latitude magnetosphere (MacDowall et al. [1993](/article/10.1007/s11214-017-0396-y#ref-CR64 "
                R.J. MacDowall, M.L. Kaiser, M.D. Desch, W.M. Farrell, R.A. Hess, R.G. Stone, Quasi-periodic Jovian radio bursts—observations from the Ulysses radio and plasma wave experiment. Planet. Space Sci. 41, 1059–1072 (1993)
            "); Hospodarsky et al. [2004](/article/10.1007/s11214-017-0396-y#ref-CR43 "
                G.B. Hospodarsky, W.S. Kurth, B. Cecconi, D.A. Gurnett, M.L. Kaiser, M.D. Desch, P. Zarka, Simultaneous observations of Jovian quasi-periodic radio emissions by the Galileo and Cassini spacecraft. J. Geophys. Res. 109, A09S07 (2004)
            ")).
Fig. 2
Cassini-RPWS spectra of Jovian radio emissions computed over 21 selected time intervals during which one or several components was present at flux levels (normalized to a distance of 1 AU) exceeding (a) 50% and (b) 1% of the time. Lightface lines are individual spectra (nKOM dashed), while boldface lines correspond to average and extreme spectra, corresponding to periods of weak/medium/strong activity. Interference-dominated ranges appear in light gray. From Zarka et al. (2004)
Fig. 3
A frequency-time spectrogram of common Jovian radio emissions acquired by Cassini during its flyby of Jupiter in 2000. After Gurnett et al. (2002)
Jovian radio emissions above about 10 MHz have been observed from Earth for more than four decades and current ground-based radio telescopes used for Jovian radio studies have phenomenal spectral and temporal resolution with the ability to generate tremendous amounts of data. An example is shown in Fig. 4 which shows exquisite resolution for an observation of Jovian S bursts by the UTR-2 radio telescope array in Ukraine. Investigation of Jupiter’s radio spectrum down to 10 kHz and even below required space-based observations unlimited by Earth’s ionosphere. The first of these were the twin Voyager spacecraft which first revealed the entire spectrum of Jovian radio emissions (Warwick et al. 1979; Scarf et al. 1979a). Galileo made the first radio astronomical observations of Jupiter from orbit, albeit only up to 5.6 MHz (Kurth et al. 1997). Cassini observed Jupiter up to 16 MHz with full polarization and direction-finding capability (Cecconi et al. 2009), but Cassini’s closest approach was more than 130 RJ from Jupiter, hence, the direction-finding capability was less useful than with a much closer flyby. The solar wind’s influence on Jovian radio emissions was studied early by Zarka and Genova (1983). However, the combination of Cassini and Galileo near Jupiter simultaneously led to advances in understanding the role of the solar wind as an influence on Jovian radio emissions, hence, Jupiter’s magnetospheric dynamics (Gurnett et al. 2002; Hess et al. 2014). There have been many studies of periodicities in Jovian radio emissions (cf. Kaiser 1993; Kaiser et al. 1996). Panchenko et al. (2013) have shown that non-Io decametric emissions exhibit periodic bursts with periods about 1.5% longer than the rotation rate of Jupiter and that are strongly correlated with solar wind pressure increases, typically occurring every ∼ 25 days. Additionally, Louarn et al. (1998, 2000, 2001, 2014) have used Galileo observations of hectometric radiation, narrowband kilometric radiation, and trapped continuum radiation to study the dynamics of the magnetosphere. The hectometric emissions are presumably affected by dynamics that act on the source of auroral radio emissions. Narrowband kilometric radiation is presumed to be generated in the Io torus, and the trapped continuum radiation can be used to determine the thickness of the plasma sheet beyond about 25 RJ. The work by Louarn et al. shows that all of these emissions, hence, large, disparate regions of the magnetosphere, can participate in magnetospheric disturbances nearly simultaneously.
Fig. 4
An example of Jovian S-bursts at the very high temporal and spectral resolution available from Earth-based telescopes like UTR-2 in Ukraine. From Ryabov et al. ([2014](/article/10.1007/s11214-017-0396-y#ref-CR76 " V.B. Ryabov, P. Zarka, S. Hess, A. Konovalenko, G. Litvinenko, V. Zakharenko, V.A. Shevchenko, B. Cecconi, Fast and slow frequency-drifting millisecond bursts in Jovian decametric radio emissions. Astron. Astrophys. 568, A53 (2014). doi: 10.1051/0004-6361/201423927
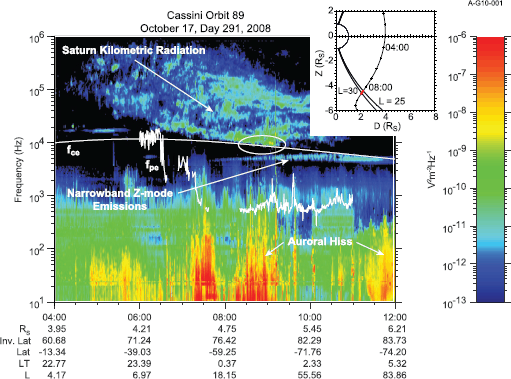
"))Exhaustive reviews of Jovian radio emissions can be found in Zarka (1998, 2004); we don’t propose to repeat those, herein. Rather, we discuss some aspects of Jovian radio studies that are of particular relevance to Juno, its orbit, and the capabilities of the Waves instrument on the spacecraft. Given that a primary objective of Juno is to carry out the first exploration of Jupiter’s polar magnetosphere and that Juno’s orbit will almost certainly carry it through source regions of Jupiter’s auroral radio emissions, it is anticipated that observations similar to those made by Cassini in the Saturn kilometric radiation (SKR) source region (Kurth et al. 2011; Lamy et al. 2010, 2011) shown in Fig. 5 will be obtained. It is generally accepted that auroral radio emissions such as Jupiter’s decametric, hectometric, and broadband kilometric radiation are generated by the cyclotron maser instability (CMI) at frequencies close to the electron cyclotron frequency in the source (Wu 1985; Treumann 2006). In addition to observations of the radio emissions, Juno carries a comprehensive set of plasma (McComas et al. [this issue](/article/10.1007/s11214-017-0396-y#ref-CR67 " D.J. McComas, N. Alexander, F. Allegrini, F. Bagenal, C. Beebe, G. Clark, F. Crary, A. Desai, A. De Los Santos, D. Demkee, J. Dickinson, D. Everett, T. Finley, A. Gribanova, R. Hill, J. Johnson, C. Kofoed, C. Loeffler, P. Louarn, M. Maple, W. Mills, C. Pollock, M. Reno, B. Rodriquez, J. Rouzaud, D. Santos-Costa, P. Valek, P. Wilson, R.J. Wilson, D. White, The Jovian Auroral Distributions Experiment (JADE) on the Juno mission to Jupiter. Space Sci. Rev. (2013). doi: 10.1007/s11214-013-9990-9
                                ")) and energetic particle (Mauk et al. [this issue](/article/10.1007/s11214-017-0396-y#ref-CR66 "
                B.H. Mauk, D.K. Haggerty, S.E. Jaskulek, C.E. Schlemm, L.E. Brown, S.A. Cooper, R.S. Gurnee, C.M. Hammock, J.R. Hayes, G.C. Ho, J.C. Hutcheson, A.D. Jacques, S. Kerem, C.K. Kim, D.G. Mitchell, K.S. Nelson, C.P. Paranicas, N. Paschalidis, E. Rossano, M.R. Stokes, The Jupiter Energetic Particle Detector Instrument (JEDI) investigation for the Juno mission. Space Sci. Rev. (2013). doi:
                10.1007/s11214-013-0025-3


                                ")) instrumentation designed to make full sky, high temporal resolution measurements of the distribution functions underlying the sources. Such distributions observed at Earth in sources of auroral kilometric radiation, another CMI emission, are of the form of horseshoe or loss cone distributions (Roux et al. [1993](/article/10.1007/s11214-017-0396-y#ref-CR75 "
                A. Roux, A. Hilgers, H. Deferaudy, D. Lequeau, P. Louarn, S. Perraut, M. Bahnsen, A. Jespersen, E. Ungstrup, M. André, Auroral kilometric radiation sources—in-situ and remote observations from Viking. J. Geophys. Res. 98, 11657–11670 (1993)
            "); Delory et al. [1998](/article/10.1007/s11214-017-0396-y#ref-CR22 "
                G.T. Delory, R.E. Ergun, C.W. Carlson, L. Muschietti, C.C. Chaston, W. Peria, J.P. McFadden, R. Strangeway, FAST observations of electron distributions within AKR source regions. Geophys. Res. Lett. 25, 2069–2072 (1998)
            ")).
Fig. 5
Observations of Saturn kilometric radiation (SKR) at and near their source gained by the Cassini radio and plasma wave instrument. A key to identifying such source crossings is the proximity of the SKR to the electron cyclotron frequency \(f_{ce}\). From Kurth et al. (2011)
Juno’s polar orbit also provides a new vantage point from which to observe the spectrum of Jupiter’s auroral radio emissions. Ulysses did have a high-latitude view of Jupiter, particularly in the southern hemisphere, but was never very close to the planet while at those latitudes, and had an upper frequency limit of 1 MHz. Hence, simply observing the latitudinal variation of Jupiter’s radio emissions will inform us of the nature of beaming patterns beyond near-equatorial latitudes. Juno’s complement of remote sensing instruments including an ultraviolet imaging spectrograph (UVS) (Gladstone et al. [2014](/article/10.1007/s11214-017-0396-y#ref-CR26 " J.R. Gladstone et al., The Ultraviolet Spectrograph on NASA’s Juno Mission. Space Sci. Rev. (2014). doi: 10.1007/s11214-014-0040-z
                                ")) and the Jupiter Infrared Auroral Mapper (JIRAM) (Adriani et al. [2014](/article/10.1007/s11214-017-0396-y#ref-CR1 "
                A. Adriani, G. Filacchione, T. Di Iorio et al., JIRAM, the jovian infrared auroral mapper. Space Sci. Rev. (2014). doi:
                10.1007/s11214-014-0094-y


                                ")) also provides the exciting possibility of close proximity contextual imaging of the auroral forms that will be overflown by Juno to be compared with the in situ observations of currents, beams, precipitating energetic electrons, and other auroral processes.
1.3 Jovian Plasma Waves
The first observations of plasma waves in Jupiter’s magnetosphere were provided by the plasma wave instruments on the twin Voyager spacecraft (Scarf and Gurnett 1977; Gurnett et al. 1979a; Scarf et al. 1979a). Voyager provided evidence of plasma wave phenomena largely similar to those occurring in Earth’s magnetosphere (Scarf et al. 1979a; Gurnett et al. 1979a; Kurth and Gurnett 1991). Reviews of Jovian plasma waves have been given by Gurnett and Scarf (1983) and Kurth and Gurnett (1991).
Jupiter’s magnetosphere is home to most, if not all, of the plasma waves found in Earth’s magnetosphere. These include lightning whistlers (Gurnett et al. 1979b) whistler-mode chorus and hiss (Scarf et al. 1979b; Coroniti et al. 1980), electron cyclotron harmonic emissions (Kurth et al. 1980; Birmingham et al. 1981), and ion Bernstein waves (Barbosa and Kurth 1990).
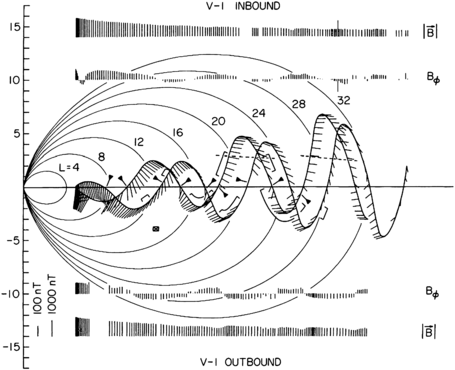
Of particular relevance to Juno’s exploration of Jupiter’s polar magnetosphere is the identification of broadband electrostatic noise (BEN) (Barbosa et al. 1981) using Voyager observations. This phenomenon had been studied extensively at Earth (Gurnett and Frank 1977) and subsequently the broadband spectrum was found to be tied to solitary structures which when Fourier transformed would appear as a broadband burst (Matsumoto et al. 1994). As shown in Fig. 6, Barbosa et al. showed that the BEN was preferentially found on Jupiter’s plasmasheet boundary layer in the range of 15 to 30 RJ and they suggested that, by analogy with Earth, these locations mapped back to Jupiter’s auroral zone. At the time, it was thought the primary losses to the atmosphere were from the Io torus in the inner magnetosphere. However, Connerney et al. ([1993](/article/10.1007/s11214-017-0396-y#ref-CR17 " J.E.P. Connerney, R. Baron, T. Satoh, T. Owen, Images of excited
H
3
+
<span class="katex"><span class="katex-mathml"><math xmlns="http://www.w3.org/1998/Math/MathML"><semantics><mrow><msup><msub><mi mathvariant="normal">H</mi><mn>3</mn></msub><mo lspace="0em" rspace="0em">+</mo></msup></mrow><annotation encoding="application/x-tex">{\mathrm{H}_{3}}^{+}</annotation></semantics></math></span><span class="katex-html" aria-hidden="true"><span class="base"><span class="strut" style="height:0.9946em;vertical-align:-0.15em;"></span><span class="mord"><span class="mord"><span class="mord"><span class="mord mathrm">H</span><span class="msupsub"><span class="vlist-t vlist-t2"><span class="vlist-r"><span class="vlist" style="height:0.3011em;"><span style="top:-2.55em;margin-left:0em;margin-right:0.05em;"><span class="pstrut" style="height:2.7em;"></span><span class="sizing reset-size6 size3 mtight"><span class="mord mtight"><span class="mord mtight">3</span></span></span></span></span><span class="vlist-s"></span></span><span class="vlist-r"><span class="vlist" style="height:0.15em;"><span></span></span></span></span></span></span></span><span class="msupsub"><span class="vlist-t"><span class="vlist-r"><span class="vlist" style="height:0.8446em;"><span style="top:-3.1362em;margin-right:0.05em;"><span class="pstrut" style="height:2.7em;"></span><span class="sizing reset-size6 size3 mtight"><span class="mord mtight"><span class="mord mtight">+</span></span></span></span></span></span></span></span></span></span></span></span>
at the foot of the Io flux tube in Jupiter’s atmosphere. Science 262, 1035–1038 (1993)
")) showed that the Io footprint aurora, as seen in \\({\\mathrm{H}\_{3}}^{+}\\) images, was well equatorward of Jupiter’s main auroral oval, confirming a more distant location as suggested by Barbosa et al. Fig. 6
Times when Voyager 1 observed broadband electrostatic noise in the vicinity of Jupiter. The emissions were found on field lines likely extending to Jupiter’s aurora by analogy with similar emissions observed at Earth. This is the first evidence that Jupiter’s aurora would be found on L-shells extending into the middle magnetosphere. From Barbosa et al. (1981)
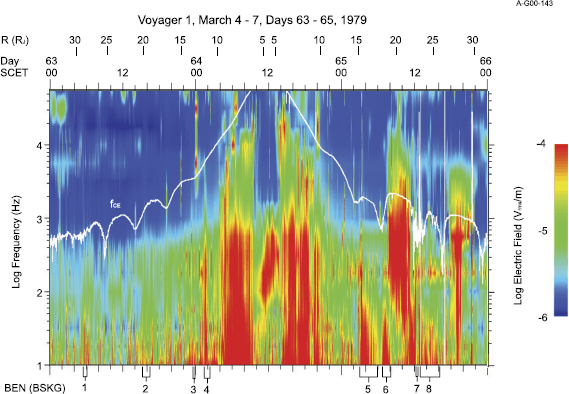
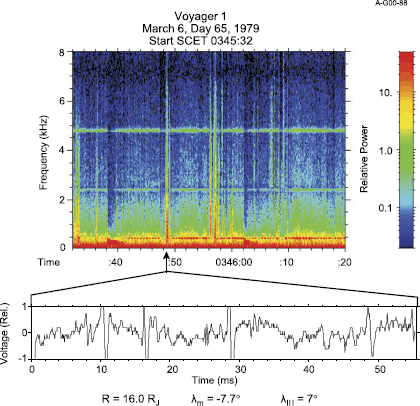
Figure 7 shows a summary of BEN events reported by Barbosa et al. (1981). Subsequent to the work of Barbosa et al. an examination of the Voyager PWS wideband data for some examples of BEN shows electrostatic solitary structures similar to those reported by Matsumoto et al. (1994). An example is shown in Fig. 8. Note that the broadband spectrum in the upper panel corresponds to waveforms showing solitary electrostatic waves. Of note, similar structures are reported in the Fast Auroral SnapshoT (FAST) data while traversing Earth’s downward current regions (Carlson et al. 1998).
Fig. 7
Voyager observations centered on Jupiter closest approach highlighting instances of broadband electrostatic noise labeled BEN (BSKG) identified by Barbosa et al. (1981)
Fig. 8
Voyager wideband observations obtained during an interval of broadband electrostatic noise. The spectrogram of the Fourier transformed waveforms is shown in the upper panel. One waveform capture showing solitary structures is shown below
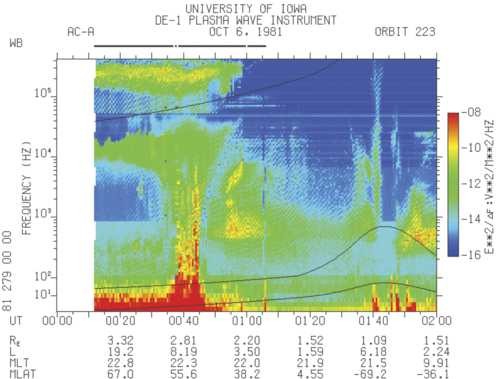
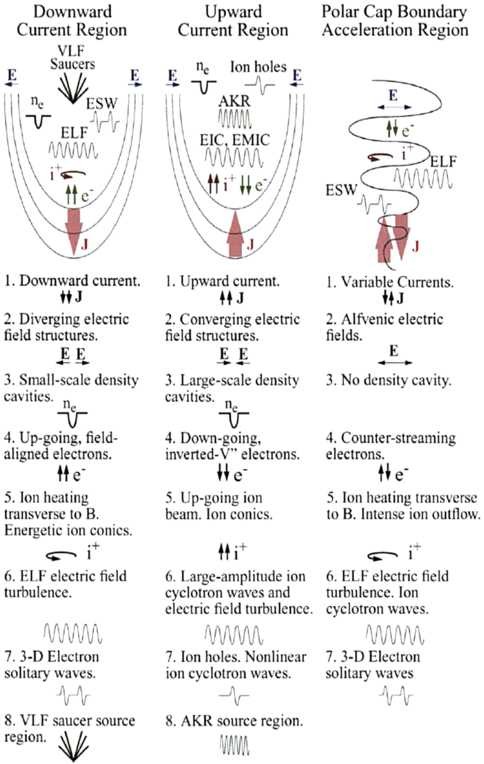
Hence, the Voyager observations of broadband electrostatic noise provides a hint that Jupiter’s auroral acceleration region will include many of the same types of processes and plasma wave phenomena known to exist in Earth’s auroral regions. The Juno Waves investigation relies, in part, on this terrestrial analogy. Figure 9 shows a typical passage through Earth’s auroral field lines observed by the Plasma Wave Instrument (PWI) on Dynamics Explorer 1 (DE-1). The most remarkable aspect of these observations is the funnel-shaped emission centered on the auroral crossing that lies below the electron cyclotron frequency (\(f_{ce} = 28|B|\) where \(f_{ce}\) is measured in Hz and \(|B|\) in nT). This emission is known as auroral hiss and is associated with the down-going electrons in an upward directed auroral current structure. As can be seen, the broadband intensity of the plasma wave spectrum clearly stands out from the surrounding times. In fact, there are a large number of other phenomena likely embedded in the funnel at lower frequencies as shown by the high resolution observations from the FAST satellite (Carlson et al. 1998). These are listed in Fig. 10. As will be discussed below, we will use the existence of a strong, broadband plasma wave spectrum as an indicator of auroral field line crossings on Juno and will use this as a factor in determining time periods during which to capture burst mode waveforms with the Waves instrument.
Fig. 9
A typical auroral zone crossing as shown using data from the plasma wave instrument on Dynamics Explorer 1. The funnel-shaped emission is auroral hiss with other types of plasma waves not distinguished at the lower frequencies. Auroral kilometric radiation is shown at the highest frequencies approaching \(f_{ce}\) (black line)
Fig. 10
A graphical listing of the various types of waves observed on Earth’s auroral field lines as observed by the FAST satellite (Bagenal et al. [2014](/article/10.1007/s11214-017-0396-y#ref-CR3 " F. Bagenal, A. Adriani, F. Allegrini, S.J. Bolton, B. Bonfond, E.J. Bunce, J.E.P. Connerney, S.W.H. Cowley, R.W. Ebert, G.R. Gladstone, C.J. Hansen, W.S. Kurth, S.M. Levin, B.H. Mauk, D.J. McComas, C.P. Paranicas, D. Santos-Costa, R.M. Thorne, P. Valek, J.H. Waite, P. Zarka, Magnetospheric science objectives of the Juno mission. Space Sci. Rev. (2014). doi: 10.1007/s11214-014-0036-8
                                "); adapted from Carlson et al. [1998](/article/10.1007/s11214-017-0396-y#ref-CR12 "
                C.W. Carlson, R.F. Pfaff, J.G. Watzin, The Fast Auroral SnapshoT (FAST) mission. Geophys. Res. Lett. 25, 2013–2016 (1998)
"))2 Scientific Objectives
A major scientific objective of the Juno mission is to explore Jupiter’s polar magnetosphere. This objective is discussed in detail in Bagenal et al. ([2014](/article/10.1007/s11214-017-0396-y#ref-CR3 " F. Bagenal, A. Adriani, F. Allegrini, S.J. Bolton, B. Bonfond, E.J. Bunce, J.E.P. Connerney, S.W.H. Cowley, R.W. Ebert, G.R. Gladstone, C.J. Hansen, W.S. Kurth, S.M. Levin, B.H. Mauk, D.J. McComas, C.P. Paranicas, D. Santos-Costa, R.M. Thorne, P. Valek, J.H. Waite, P. Zarka, Magnetospheric science objectives of the Juno mission. Space Sci. Rev. (2014). doi: 10.1007/s11214-014-0036-8
")). In this section we describe the specific role the Waves investigation plays in addressing this objective.2.1 Auroral Radio Emissions
Juno will likely pass through the source regions for Jupiter’s decametric, hectometric, and broadband kilometric radio emissions. The precession of the orbital line of apsides guarantees a progressive passage through auroral field lines over a broad range of radial distances. Since these emissions are all thought to be generated by the cyclotron maser instability, the sources will extend to larger distances for the lower frequency emissions as the magnetic field strength, hence, electron cyclotron frequency, decreases. Source regions will be apparent as emissions at the local electron cyclotron frequency are observed. While in burst mode, Waves will obtain waveforms of the radio emissions in a 1-MHz bandwidth including \(f_{ce}\) by using the onboard magnetometer (Connerney et al. [2017](/article/10.1007/s11214-017-0396-y#ref-CR19 " J.E.P. Connerney, M. Benn, J.B. Bjarno, T. Denver, J. Espley, P.S. Jorgensen, P. Lawton, A. Malinnikova, J.M. Merayo, S. Murphy, J. Odom, R. Oliversen, R. Schnurr, D. Sheppard, E.J. Smith, The Juno magnetic field investigation. Space Sci. Rev. (2017). doi: 10.1007/s11214-017-0334-z
                                ")) measurement of \\(|B|\\) to tune the receiver. Survey measurements will be made at a 1-spectrum/s cadence up to 41 MHz. Waves’ single dipole antenna limits the instrument to measuring amplitude versus time and frequency; no polarization measurements will be possible. Instantaneous direction of arrival information will be limited to the so-called rotating dipole technique (Kurth et al. [1975](/article/10.1007/s11214-017-0396-y#ref-CR49 "
                W.S. Kurth, M.M. Baumback, D.A. Gurnett, Direction-finding measurements of auroral kilometric radiation. J. Geophys. Res. 80, 2764–2770 (1975)
            "); Lecacheux [1978](/article/10.1007/s11214-017-0396-y#ref-CR58 "
                A. Lecacheux, Direction finding of a radiosource of unknown polarization with short electric antennas on a spacecraft. Astron. Astrophys. 70, 701–706 (1978)
            ")). This defines the plane of the source to be that which includes the spacecraft spin axis and the Waves effective electric dipole at the time of a null in the observed spin-modulated signal. The modulation index, or depth of the null, can be used to determine the angle of the source from the spacecraft spin plane under the assumption of a point source (but see Cecconi [2007](/article/10.1007/s11214-017-0396-y#ref-CR13 "
                B. Cecconi, Influence of an extended source on goniopolarimetry (or direction finding) with Cassini and solar terrestrial relations observatory radio receivers. Radio Sci. 42(2) (2007). doi:
                10.1029/2006RS003458


                                ")). Refer to the section describing the electric antenna calibration to see limitations imposed by a distorted antenna beam at higher frequencies resulting from the very short antenna in the presence of a very large spacecraft, dominated by the solar panels. This issue is further complicated by temporal variations on the time scale of the spacecraft rotation period.
Significant work has gone into modeling auroral radio emissions, especially of Io-related emissions at Jupiter. One such tool is called ExPRES (Hess et al. 2008a, 2010; Lamy et al. 2008). Such modeling can provide important information on sharply beamed CMI emissions because the modeling involves correctly identifying the source location and beaming characteristics which, in turn, require realistic information on such things as the energy of the auroral electrons. Successful modeling of emissions can verify the polarization of observed emissions, even if the receiver is incapable of polarization measurements. Existing tools like ExPRES have been successful at modeling Io-related emissions, perhaps because the source field lines are reasonably well known (Hess et al. 2008b). Modeling of non-Io sources will be a challenge since much less is known about the locations of such sources. In any case, an aggressive modeling effort will be important in deriving the maximal information from Juno radio observations. For example, one can take advantage of UV auroral hot spot locations and variability in ExPRES simulations to compare with radio variability.
There are now numerous low-frequency radio observatories across the globe such as in France, Ukraine, United States, to name a few, with extremely high spectral and temporal resolution that will be used in concert with Juno’s observations. For example, Earth-based observations can provide context for Juno’s close approach observations and can be used to determine beaming properties of emissions as they rotate (with either Io or Jupiter). Certainly the spectral and temporal resolution will complement the spaceborne observations that are always constrained by telemetry restrictions.
Waves Auroral Radio Emission Objectives:
- Determine the locations of auroral radio sources
- Determine what electron distribution functions drive the radio emissions, e.g. loss cone or shell (with JADE, JEDI)
- Confirm CMI is the emission process for auroral radio emissions
- Determine how CMI works in a regime with higher electron energies
- Determine the maximum field intensity at sources and the saturation mechanism
- Determine the beaming properties of Jovian radio emissions
- Compare the radio emission processes at Jupiter to those at Earth
- Compare observed Jovian radio emissions to modeling, e.g., ExPRES, using beaming to constrain the resonant electron energy
- Relate auroral radio sources with UV and IR auroral hot spots
- Use observations of radio waves to assess magnetospheric dynamics and the effect of the solar wind on the magnetosphere versus internal dynamics
2.2 Auroral Plasma Waves
Based on terrestrial studies of plasma waves on auroral field lines with Injun 3 (Gurnett 1966), Dynamics Explorer (Gurnett and Inan 1988), and FAST (Carlson et al. 1998), the Waves instrument will likely observe a number of plasma wave phenomena on Jovian auroral field lines. Auroral hiss should provide an intense broadband signature extending up to the lower of \(f_{ce}\) or \(f_{pe}\), where \(f_{pe}\) is the electron plasma frequency \(f_{pe} = 8980\sqrt{n_{e}}\) in Hz and \(n_{e}\) is in \(\mbox{cm}^{-3}\). At Earth, these waves are associated with downgoing electrons in the upward current region. A related emission, VLF saucers are typically observed in the terrestrial auroral region on downward current carrying field lines associated with upward moving electrons. Solitary structures sometimes referred to as electron or ion phase space holes are common features on terrestrial auroral field lines and are likely related to the broadband electrostatic noise observed by Voyager on auroral field lines mapped into the middle magnetosphere (Barbosa et al. 1981). Electromagnetic ion cyclotron waves may also be observed.
The auroral hiss is expected to provide an excellent fiducial marker of auroral field lines, helping to identify these from basic frequency-time spectrograms as in Fig. 9. The solitary structures may be hinted at by broadband impulses in the spectral data, but will be directly identifiable only with the waveform observations afforded by the burst observations. The single-axis measurements will limit the ability to analyze the details of these, since orthogonal components cannot be obtained. Nevertheless, their existence will enable some progress in understanding the physics of Jupiter’s aurora by bootstrapping from our considerable knowledge base at Earth.
Waves Auroral Plasma Wave Objectives:
- Determine the role of plasma waves in the acceleration of auroral particles
- Use plasma waves such as auroral hiss to identify auroral field lines
- Compare plasma waves and associated processes on Jovian auroral field lines to those observed at Earth
2.3 Other Science Possible with Waves
Other phenomena are likely observable with Waves at various locations in its orbit. While not among the prime motivations for this instrument, some additional science and diagnostic information may be gained.
2.3.1 Thermal Plasma
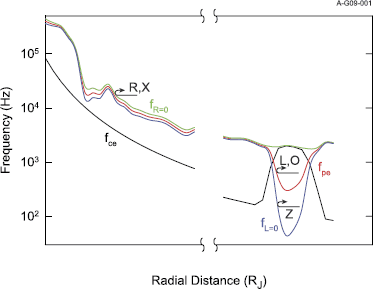
A wave instrument often observes resonances and cutoffs at frequencies related to the electron density. In the solar wind, the simplest example of these are electron plasma oscillations or Langmuir waves that occur at the electron plasma frequency. In planetary magnetospheres the upper hybrid resonance frequency is often observed as a narrowband emission \(f_{uh}^{2} = f_{ce}^{2} + f_{pe}^{2}\). The identification of such features can lead to the determination of \(f_{pe}\), hence \(n_{e}\). The low-frequency cutoff of ordinary mode radio emissions such as trapped continuum radiation found in the outer magnetosphere beyond about 25 RJ (cf. Barnhart et al. 2009) also provides an estimate of \(f_{pe}\) as shown schematically in Fig. 11. Finally, the quasi-thermal noise (QTN) spectrum has been used to determine not only \(n_{e}\) but also estimates of the bi-maxwellian temperatures of a plasma (Meyer-Vernet and Perche 1989). Given the very short Waves antenna and limited sensitivity of the instrument, we do not expect to be able to use this feature in many situations on Juno. The other features may be of use, provided identifiable spectral features are observed. Of course, the electron density is important for characterizing the magnetosphere as well as for understanding the propagation of waves and other physical properties.
Fig. 11
A schematic representation of characteristic frequencies of the plasma in Jupiter’s magnetosphere. At radial distances beyond about 25 RJ density cavities can be filled with ordinary mode radio emissions commonly referred to as trapped continuum radiation. The low-frequency cutoff of these emissions provides a measure of the electron density (Barnhart et al. 2009). Here \(f_{R=0}\) is the low-frequency cutoff of the right-hand, extraordinary mode, \(f_{L=0}\) is the low frequency cutoff of the Z-mode, and \(f_{pe}\) is the low frequency cutoff of the left-hand, ordinary mode
2.3.2 Dust
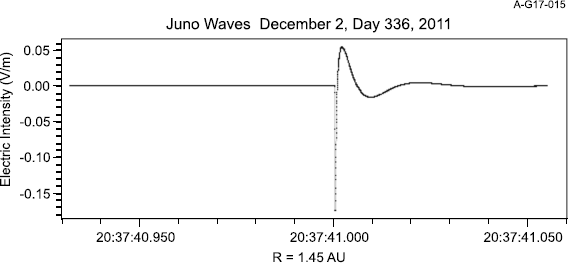
The Voyager 2 crossing of Saturn’s ring plane demonstrated the utility of a radio and plasma wave instrument for studying the dust environment of planetary magnetospheres and the solar wind (Gurnett et al. 1983; Aubier et al. 1983; Kurth et al. 2006; Ye et al. 2016). Figure 12 shows an example of a dust impact observed by the Juno Waves instrument during its interplanetary cruise phase and such measurements will be most useful and interesting during the ring plane crossing near perijove when Juno passes below Jupiter’s ring system and above the cloud tops. While this region is expected to be relatively clear, it is entirely possible that dust from the ring perturbed by various forces could be found there.
Fig. 12
An example of an impulse stemming from a dust impact observed by the Waves instrument during its interplanetary cruise at a heliocentric radial distance of 1.45 AU
When a spacecraft is impacted by a micron-sized dust grain moving with a relative speed of 10 km/s or more, the grain and a portion of the target material is vaporized by the conversion of the kinetic impact energy into heat. The temperature of the resulting gas is of order 105 K, hence, the gas is ionized. There is some debate as to the details of how a wave instrument detects the impacts with an electric field sensor. One possibility is that one element of a dipole antenna may collect more of the electrons produced by the impact than the other, leading to the detection of a differential impulse. Other theories involve temporal variations of the potential of the impacted surface that leads to a differential voltage between the chassis and antenna element, particularly if a monopole antenna is used. Another possibility is that the plasma sheath around the spacecraft is disturbed by the near-instantaneous introduction of a cloud of electrons and more slowly moving ions. We refer the reader to the references cited above for more details on the theory behind these measurements.
Wave measurements, especially if waveforms are measured, can be very effective at measuring dust flux and the size distribution since the pulse magnitude is a function of mass (and velocity which can be estimated assuming Keplerian orbits). It is more difficult to establish the absolute mass of an individual particle, although such estimates are made with caveats concerning the accuracy.
2.3.3 Lightning
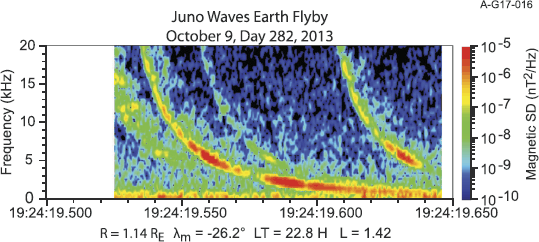
Voyager 1 revealed the existence of lightning at Jupiter (Gurnett et al. 1979b; Cook et al. 1979) through the detection of lightning whistlers in the Io torus. Juno will thread magnetic field lines which pass through latitudes in which lightning has been detected by Voyager and Galileo, typically near \(\sim 50^{\circ}\) jovigraphic latitude (Little et al. 1999). Because Juno will be close to the lightning source in a strong magnetic field, the dispersion will be small, since this is a function of the electron density integrated along the ray path of the whistlers. Juno detected such short dispersion whistlers during its flyby of Earth in 2013 (see Fig. 13). The burst mode waveforms are essential to identify these dispersed signals. To date, there has not been a detection of high frequency radio emissions from Jovian lightning such as the Saturn electrostatic discharges associated with lightning there (Fischer et al. 2006). Juno’s close proximity to the storms should enhance the possibility of detecting these, should they exist, and possibly help to understand why they seem to be weak or non-existent.
Fig. 13
Lightning whistlers observed by Juno during Earth flyby
3 Required Instrument Characteristics
3.1 Field Sensors
Juno is a challenging mission with a large payload, the need for many large fields of view, and significant mass resources going into a radiation vault to protect sensitive electronics and a very large solar array required to power the spacecraft and instruments at 5 Astronomical Units (AU) from the Sun. The requirements set out above can be met with a single axis electric antenna and a single axis magnetic field sensor. We rely on measurements at Earth with multi-axis sensors to guide the identification of wave phenomena assuming that the physics of the aurora will be similar to that at Earth. By orienting the sensitive axis of the electric antenna perpendicular to the spin axis, the spin of the spacecraft provides an effective second axis for electric fields. And, having the sensitive axis of the magnetic antenna perpendicular to the electric field antenna, it is possible, in principle, to determine the direction of the Poynting flux under some circumstances (Mosier and Gurnett 1971). Also, by having the search coil parallel to the spin axis, one can avoid a strong tone at the spin frequency due to Jupiter’s strong magnetic field that could otherwise limit the dynamic range of the sensor. The complement of an electric and magnetic measurement, at least for lower frequencies, allows for the identification of electromagnetic versus electrostatic modes. This also enables the determination of the E/cB ratio which can become large for whistler-mode waves propagating on or near the resonance cone. This two sensor approach is similar to that taken for the Galileo Plasma Wave Science instrument (Gurnett et al. 1992).
3.2 Frequency Range
It is important to measure radio emissions to at least 41 MHz to detect and characterize Jupiter’s auroral radio emissions to the maximum extent of their known range. The lower limit of the measured range is a trade between measuring as low in frequency as possible and guarding against saturation due to extremely large \(\mathbf{v} \times\mathbf{B}\) electric fields in Jupiter’s strong magnetic field coupled with Juno’s ∼ 60-km/s orbital speeds. In addition, Juno’s 2 rpm spin in Jupiter’s ∼ 10 Gauss magnetic field would represent a very strong spin tone in magnetic field measurements. Consequently, 50 Hz was deemed an acceptable low frequency limit to the Waves measurements. In addition, it was decided that having both electric and magnetic field measurements up to about 20 kHz would enable the distinction between electrostatic and electromagnetic modes for most plasma waves anticipated. Hence, Waves measures the wave magnetic field from 50 Hz to 20 kHz and wave electric fields from 50 Hz to at least 41 MHz.
3.3 Frequency and Time Resolution
The Waves instrument produces electric and magnetic spectra approximately once per second near periapsis. Burst data are generated for several brief (∼ 1 minute) periods per periapsis within auroral features. An onboard algorithm (using broadband plasma wave amplitudes) captures the ‘most interesting’ intervals within burst-enabled times scheduled based on Juno’s trajectory, available magnetic field models, and Jupiter’s average auroral oval from Hubble Space Telescope (HST) observations (Bonfond et al. [2012](/article/10.1007/s11214-017-0396-y#ref-CR10 " B. Bonfond, D. Grodent, J.C. Gérard, T. Stallard, J.T. Clarke, M. Yoneda, A. Radioti, J. Gustin, Auroral evidence of Io’s control over the magnetosphere of Jupiter. Geophys. Res. Lett. 39 (2012). doi: 10.1029/2011GL050253
")). During the outer portion of the orbit, Waves obtains spectra at a rate of one per 30 seconds. Sample rates and cadences are detailed in Table [1](/article/10.1007/s11214-017-0396-y#Tab1) for Perijove (PER), Intermediate (INT), and Apoapsis (APO) modes. See Sect. [6.1.2](/article/10.1007/s11214-017-0396-y#Sec36) for additional information on instrument modes. Table 1 Waveform capture information by receiver
3.4 Sensitivity and Dynamic Range
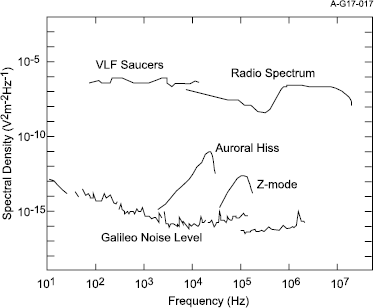
Figure 14 shows the expected amplitudes and frequencies of primary waves expected near Jupiter, particularly in the polar regions. The Galileo Plasma Wave Science instrument’s noise level is shown for comparison. Galileo had the advantage of accommodating electric antennas at the end of a long magnetometer boom. Juno’s field of view restrictions made such a configuration unrealistic for the Waves electric antenna. Prelaunch estimates suggested integrated electric fields near the auroral source might approach 3 Volts. It was a desire for the instrument to accommodate a field of this magnitude, first, without damage and, second, without saturation. In fact, it was this desire to measure such fields that limits the sensitivity of the instrument.
Fig. 14
Frequency and dynamic range of some expected Jovian wave phenomena
4 Instrument Description
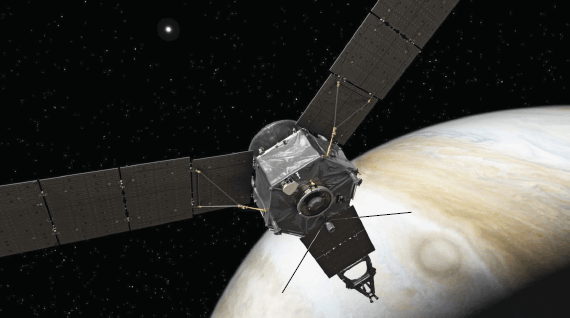
The Waves instrument utilizes an electric dipole antenna deployed from the aft flight deck (see Fig. 15) in a ‘V’ configuration with a tip-to-tip length of about 4.8 meters oriented such that the sensitive axis is perpendicular to both the spacecraft spin axis and the spacecraft x axis (along which the magnetometer boom is deployed), and a magnetic search coil (Fig. 16) oriented such that the sensitive axis is parallel to the spacecraft spin axis so as to minimize its response to the spin-modulated planetary field. The search coil uses a short (15 cm) mu-metal core sized to avoid interfering with the magnetometer measurements via induced magnetic fields. The instrument includes a set of receivers to detect signals from these sensors. In some respects the Waves instrument utilizes aspects of a software defined radio in that after filtering to limit frequency ranges and avoid full spectrum saturation from a strong signal in a limited frequency range, most of the spectrum analysis is performed digitally by a special purpose floating point processor. The low frequency receiver (LFR) includes two low-frequency channels to analyze plasma waves in the frequency range of 50 Hz to 20 kHz for electric and magnetic fields from the two sensors, simultaneously. This receiver produces a digitized waveform from each channel which is either sent directly to the ground in burst mode or spectrum analyzed in the digital processing unit (DPU) to produce spectra with \(\sim 18\) logarithmically spaced channels per decade of frequency. The LFR also includes a 10–150 kHz channel to analyze the electric field spectrum and to collect waveforms in this frequency range. There are nearly identical high frequency receivers that function as a spectrum analyzer (HFR) and a wideband waveform receiver (HFWBR). The spectrum analyzer compiles a spectrum from digital spectrum analysis between 100 kHz and 3 MHz and by a swept frequency receiver from 3 to 41 MHz. The waveform receiver can be tuned to a 1-MHz band between 3 and 41 MHz that includes the electron cyclotron frequency \(f_{ce}\) derived from onboard fluxgate Magnetometer (MAG) measurements (Connerney et al. [2017](/article/10.1007/s11214-017-0396-y#ref-CR19 " J.E.P. Connerney, M. Benn, J.B. Bjarno, T. Denver, J. Espley, P.S. Jorgensen, P. Lawton, A. Malinnikova, J.M. Merayo, S. Murphy, J. Odom, R. Oliversen, R. Schnurr, D. Sheppard, E.J. Smith, The Juno magnetic field investigation. Space Sci. Rev. (2017). doi: 10.1007/s11214-017-0334-z
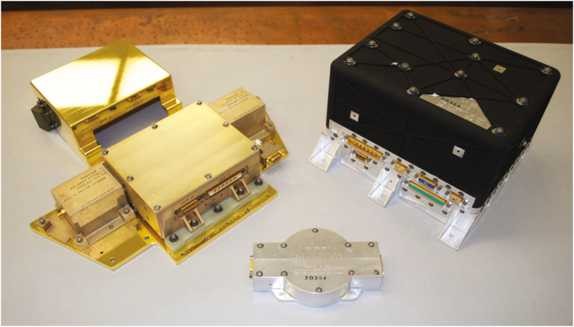
")) and generates waveforms for signals within that band. If \\(f\_{ce}\\) is below 3 MHz, then the 100 kHz–3 MHz baseband channel can be selected for waveform measurements. A digital floating point signal processing capability is implemented in a field-programmable gate array to provide spectrum analysis and lossless compression of waveform data. The receivers and processors, along with a power supply are packaged in the main electronics box located in Juno’s radiation vault. An image of the main electronics box along with the electric and magnetic preamplifiers is shown in Fig. [17](/article/10.1007/s11214-017-0396-y#Fig17). Fig. 15
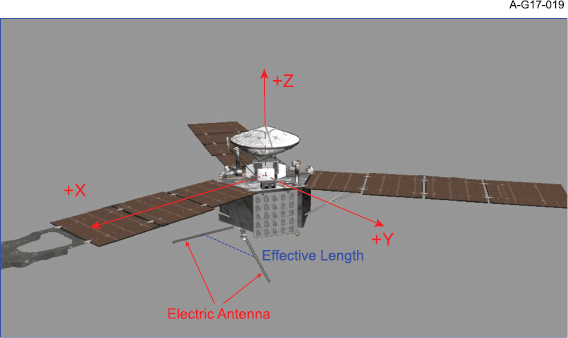
Juno with Waves electric antenna deployed from the aft flight deck. The sensitive axis is perpendicular to the solar panel containing the magnetometer boom (spacecraft x axis) and the spin (z) axis
Fig. 16
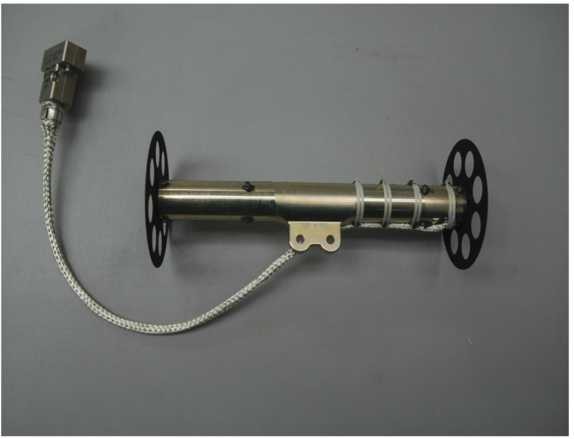
This is a photo of the Juno Waves search coil antenna. The ‘wheels’ at the ends are standoffs designed to support the antenna’s thermal blanket. The search coil is body-mounted to Juno with its long (sensitive axis) parallel to the spacecraft spin (z) axis
Fig. 17
This is a photo of the Juno Waves main electronics box (right), electric preamp (left), and magnetic preamp (center). The gold box behind the electric preamp is a thermal cover for the preamp. The electric preamp sits on a base plate that also holds the antenna hinges (not shown). In place of the hinges in this photo are test signal recepticles required for testing
4.1 Block Diagram
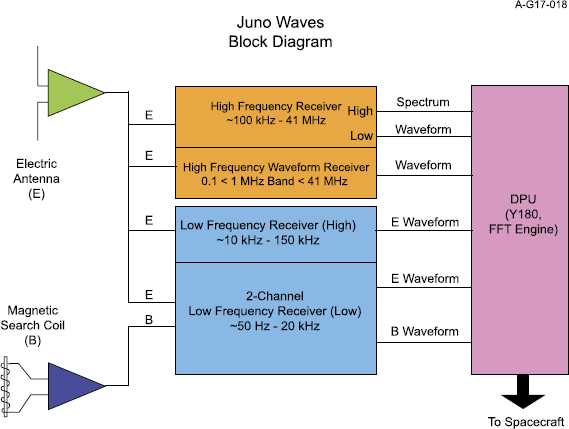
A simplified block diagram of the Waves instrument is given in Fig. 18. The signal flow is generally from left to right in this depiction beginning with the two sensors and ending with signal processing just prior to the delivery of the data to the spacecraft data system. The electric and magnetic sensors each have preamplifiers located close to the sensors, themselves. Conditioned signals are sent to the main electronics box located in Juno’s radiation vault. The main electronics includes a set of receivers, a data processing unit (DPU), and a power supply (not shown). The low frequency receiver (LFR) comprises LFR-Lo and LFR-B channels that allow for simultaneous electric and magnetic field measurements in the 50 Hz to 20 kHz band and an LFR-Hi channel that makes electric field measurements in the 10 kHz to 150 kHz frequency range. There are two nearly identical high frequency receivers. One is called the high frequency receiver (HFR) and the other the high frequency wideband receiver (HFWBR). The HFR is designated for performing spectrum analysis from 100 kHz to 41 MHz. The HFWBR is designated for acquiring waveform bursts of a selectable band, either in the baseband up to 3 MHz or a 1-MHz band at higher frequencies. In reality, these are redundant receivers and either can be used for spectrum analysis and/or waveform capture. Finally, the DPU decodes commands, acquires and digitizes waveforms from all the receivers, and performs hardware spectrum analysis in the 3–41 MHz frequency range. The DPU includes a floating point arithmetic processor called the Waves Fast Fourier Transform (FFT) Engine, or WvFE that is optimized for floating point FFT computations but can also be used for other signal processing tasks. The DPU is the interface with the spacecraft for commands and also has two serial interfaces with the spacecraft data system with one for housekeeping data and low rate science (LRS) data and the other for high rate science (HRS) data. The former sends computed spectra to the spacecraft and the latter sends burst mode waveforms to the spacecraft for later transmission to Earth.
Fig. 18
Juno Waves block diagram
4.2 Electric Antenna
The electric antenna is attached to the aft flight deck and consists of two elements, each 2.728 m long. The elements are deployed in a plane rotated \(45^{\circ}\) from the plane of the aft flight deck with a 120 degree subtended angle between them. The plane of symmetry of the deployed antenna also includes the axis of the solar panel with the magnetometer boom, the spacecraft x axis. The elements each comprise three equal-length segments of titanium tubing with outside diameters of 0.500, 0.375, 0.250 inches forming a tapered element in stepwise fashion. The deployed configuration of the electric antenna is shown in Fig. 15. Prior to launch, the two antenna elements were rotated about a spring-loaded hinge and tied to the aft flight deck. The elements were deployed several days after launch by the use of non-explosive shape memory alloy pin-pullers to release the caging mechanism.
The elements are attached to a titanium baseplate also holding the electric preamplifier. Each element is on a rotating hinge, allowing the element to deploy from its stowed position by the aft flight deck into its final position in a single motion. The deploying element traces a conical surface. The spacing between the roots of the two elements is 9 cm. Geometrically speaking, the distance between the two tips of the antennas is 4.82 m and the line segment between the two tips is parallel to the spacecraft y axis as shown in Fig. 19. Not including the capacitive divider effect of the base and antenna capacitances, the geometric effective length of the antenna, then is 2.41 m. The actual effective length depends on the spacecraft geometry as a complex ground plane and the capacitive divider effect. Detailed antenna modeling was carried out by the Austrian Academy of Sciences (Sampl et al. 2012, 2016) and is summarized in the section on calibration. These effects will be discussed in Sect. 5.1.1.
Fig. 19
Effective axis of electric antenna with spacecraft coordinate system
The electric field preamp is designed to cover the broad frequency range required without saturating at the large in-band signals expected. In addition, Waves is designed to withstand the very large low-frequency signals associated with the \(\mathbf{v} \times\mathbf{B}\) that can reach 60 V/m. An automatic attenuation capability in the preamp is used to protect against saturation effects at the largest expected amplitudes, thereby extending the dynamic range. This capability is provided by an independent attenuator in each of three frequency ranges: 20 Hz to 80 kHz, 400 Hz to 400 kHz, and 20 kHz to 40 MHz. These are set to cover the LFR-Lo, LFR-Hi, and both HFR frequency ranges with some margin. Very large signals in any one of these ranges would lead to the application of 25.3, 25.3 or 19.0 dB of attenuation in the respective band. While the attenuation can be set by command, the instrument can detect signal amplitude and respond autonomously by setting the preamp attenuation. The same three frequency ranges are also covered by individual signal lines to the main electronics. This further protects the analysis of signals in one band from large signals in one of the other bands. Additional signal amplitude management is available within the various receivers with the use of gain amplifiers to keep the signal within a usable range for the analog-to-digital converters.
4.3 Magnetic Antenna
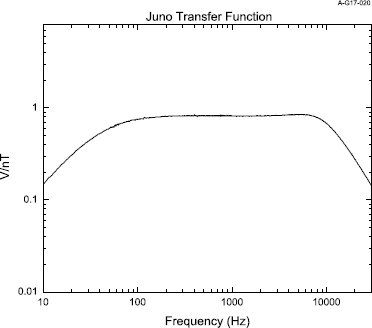
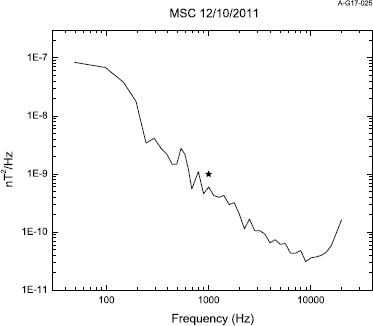
The magnetic component of waves in the frequency range of 50 Hz to 20 kHz is measured with a search coil magnetometer shown in Fig. 16 consisting of a 15-cm long high-permeability core within a bobbin holding 10,000 turns of #38 copper wire coupled to a preamplifier, shown schematically in Fig. 20. A detailed discussion of the basic design of search coil magnetometers is given by Hospodarsky (2016). The core length was limited for a couple of reasons. First, the length was shortened to reduce the possibility of creating a variable field by the soft magnetic core material that could be detected by the Juno MAG. Second, the shorter core reduces the sensitivity of the search coil at lower frequencies, hence, preventing saturation near perigee in the presence of Jupiter’s strong (∼ 10 Gauss) magnetic field. A low noise preamplifier designed to survive the heavy radiation environment is located about 40 cm from the search coil, but within the spacecraft thermal protection system. As discussed by Hospodarsky (2016) the preamplifier supplies a feedback current to the main coil which flattens the resonance that would otherwise be sharply peaked. This response is illustrated in Fig. 21 showing the transfer function of the Juno search coil. While it is customary to mount such antennas on booms of a few meters in length so as to minimize interference from the spacecraft and its systems, such a boom was impractical within the spacecraft design concept. Hence, the Juno search coil is body-mounted near the bottom of the main spacecraft structure with its sensitive axis parallel to the spacecraft spin axis in order to minimize the spin tone which would be experienced by the spacecraft spinning in the ∼ 10 Gauss field of Jupiter. The in-flight noise level of the search coil is given in the section on performance.
Fig. 20
Juno simplified search coil schematic after Hospodarsky (2016)
Fig. 21
Waves search coil transfer function
4.4 High Frequency Receiver and High Frequency Wideband Receiver
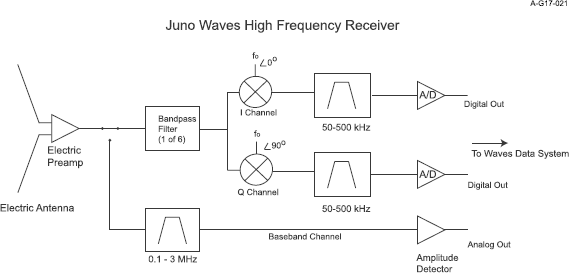
The High Frequency Receiver spectrum analyzer (HFR) shown schematically in Fig. 22 is a direct conversion receiver with quadrature detection at the baseband output. Above 3 MHz, the amplitude detected in a swept 1-MHz bandwidth is used to provide a spectrum for survey purposes. Below 3 MHz the waveform through the baseband filter digitized by a 12-bit analog-to-digital converter is Fourier transformed to provide the low frequency end of the spectrum at higher resolution. The high frequency wideband waveform receiver (HFWBR) is similar to the HFR; the measured magnetic field from the MAG is used to select the 1-MHz bandwidth containing the electron cyclotron frequency and the waveform in this band is compressed and sent to the ground in the burst mode. Other than the width of the notch at the zero-frequency point in the receiver, the HFR and HFWBR are identical in design. The notch is narrower for the HFWBR to minimize the gap in spectral coverage. However, because a narrower gap results in longer settling times in the detection circuit for spectrum analysis, a somewhat wider notch filter is used in the HFR to support rapid sweeping from 3 to 41 MHz in normal periapsis survey mode. In practice, the settling time is not a factor and either receiver can be used for either survey or wideband waveform measurements and one of the receivers can be used for both functions to provide some redundancy. In practice, the HFR has better sensitivity, hence, it is nominally used for both survey and burst mode functions. The Juno High Frequency Receiver baseline requirements are to cover the frequency range of 100 kHz to 41 MHz, with 1 second time resolution. Above 3 MHz, the frequency resolution is specified as 1 MHz, below 3 MHz, the requirement is 10 log-spaced steps per decade in frequency. See Table 1 for details of the sampling for this and other receivers. In addition, the requirement for a second receiver is to provide 1 MHz bandwidth wideband waveform data up to 41 MHz.
Fig. 22
Block diagram of Juno HFR and HFWBR
It was highly desirable from a system standpoint to create a single receiver which would be able to satisfy both sets of measurement requirements. This provides redundancy to the instrument and simplifies the fabrication process. The receiver topology chosen is a direct conversion receiver. In contrast with a double-conversion superheterodyne, a single conversion receiver utilizes a mixer driven by the desired detection frequency to convert directly to baseband. A strong advantage of this topology is a reduction in the parts count and power requirements, at the expense of more stringent requirements on the filters within the receiver.
To allow detection of a 1 MHz bandwidth channel, the input signal is passed through one of a bank of octave wide input filters. These filters reduce the response to out-of-band signals at harmonics of the mixing signal. The mixing signal is generated via a phase-locked loop frequency synthesizer, which has a 250 kHz step resolution, and a lock time below 25 ms. The frequency is selected at the middle of the desired 1 MHz band. To allow reconstruction of the downconverted waveform, a quadrature mixer is used which generates in-phase (I) and quadrature phase (Q) outputs at baseband. These signals are passed through identical 500 kHz low pass filters. For the HFR survey amplitude spectrum, the in-phase signal is detected by a wideband log detector, which outputs an analog signal proportional to the input amplitude. This analog voltage is sampled by a 16-bit A/D converter time shared with voltages monitored for engineering purposes. However, for both the HFR survey and the engineering measurements, only the high-order 8 bits of the A/D are used. For the waveform, both I and Q outputs are simultaneously sampled by parallel 12 bit A/D converters at a sample rate of 1.3125 MHz. The resulting data are captured by the digital processing unit for transfer to the ground in blocks of 4096 samples per channel. By using the I and Q samples as the real and imaginary inputs to an FFT during ground data processing, the entire 1 MHz (\(-500~\mbox{kHz}\) to \(+500~\mbox{kHz}\)) spectrum can be reproduced.
The result of the baseband conversion process is that frequencies near the mixing frequency are translated to low frequencies at the output of the mixer. If these low frequencies have sufficient amplitude, they will result in appreciable ripple in the detected analog output.
To avoid the problems created by the low frequencies, a high pass filter is used at the two outputs of the mixer. The highpass filter is set to 10 kHz for the HFWBR, and 100 kHz for the HFR. In addition, the frequency synthesizer for the HFWBR uses a narrower bandwidth loop filter. This has the effect of lowering the phase noise of the mixing signal, and results in a higher fidelity waveform output. The HFR synthesizer loop filter is set at a wider bandwidth, which allows a faster lock time.
Electron Cyclotron Frequency Tracking
While the High Frequency Wideband Receiver function exists to provide high spectral resolution for Jupiter’s radio emissions and can be tuned to a specific frequency by command, an especially useful band is one that can be used to study the emissions near their source. Given that most of Jupiter’s radio emissions above 150 kHz are generated by the cyclotron maser instability near \(f_{ce}\), it is useful to be able to tune to a band that includes this frequency. It is possible to sequence commands to tune to a band including \(f_{ce}\) using a model magnetic field. However, the field magnitude will vary rapidly during Juno’s perijove trajectory, requiring a significant number of commands. More importantly, the actual magnetic field may vary significantly from the model, making this approach useless should such differences be significant. Just a \(\sim 10\%\) variation in \(|B|\) from the model could move \(f_{ce}\) to an entirely different band. Hence, the HFWBR function utilizes the capability to track the actual \(f_{ce}\) through the use of an onboard broadcast of the field magnitude from the magnetometer in real time every 2 seconds. The Waves instrument computes the cyclotron frequency and then selects a 1-MHz band that includes \(f_{ce}\) in the lower portion of the band. The band selection has a 250 kHz granularity. Should \(f_{ce}\) fall below 3 MHz, then the baseband of the HFWBR is selected.
4.5 Low Frequency Receiver
The Low Frequency Receiver (LFR) is designed to receive signals in the frequency range of 50 Hz to 150 kHz. For the magnetic component of waves, the receiver has a 50 Hz to 20 kHz channel. For the electric component, there are two channels. One is identical to the magnetic channel at 50 Hz to 20 kHz and the second covers the range from 10 to 150 kHz. Each electric channel consists of a programmable gain amplifier, a passive bandpass filter, and a 16-bit analog-to-digital converter. The LFR-B channel does not have a programmable gain amplifier. For the low frequency bands, a sample rate of 50 kilosamples per second (ksps) is used. For the high frequency band, a sample rate of 375 ksps is used.
The primary mode of operation of this receiver is to collect a contiguous series of 6144 samples which are then Fourier transformed in the FFT engine and further processed as described in the DPU section. Clearly, another mode of use for this receiver is to collect waveforms in burst modes so that the waveforms can be telemetered to the ground for detailed analysis, providing the ultimate spectral and temporal resolution.
A description of all of the electromagnetic interference (EMI) mitigation techniques used on Juno on behalf of Waves is given by Blackburn et al. (2011) and summarized in Sect. 4.8. However, one of these techniques is novel and is rooted in the LFR, hence, we discuss this mitigation here. The very large solar arrays provide perhaps the greatest risk of EMI to Waves because of the possibility that voltage fluctuations inherent in the bus can be reflected in variations in the solar array potential, which has direct access to the plasma and can also radiate to the Waves antenna. While capacitive loading can minimize high frequency fluctuations on the solar arrays, the size of the capacitance required at low frequencies is prohibitive. The solution we selected on Juno was to perform onboard noise cancellation of the noise on the bus for the LFR signals. The noise on the bus is provided as a reference ‘noise’ signal via a transformer-coupled signal from the Power Distribution and Drive Unit (PDDU) to the Waves LFR. Since the LFR has two input channels for the low band, one of these channels bandpass-filters and digitizes the ‘noise’ signal at the same time the other channel filters and digitizes the signal from the sensor (presumably containing both signal and noise). The noise channel is digitally filtered in the DPU and subtracted from the sensor data. For performance evaluation, Waves has the ability to transmit back the sensor data (signal + noise), the ‘noise’ data, and the noise-cancelled ((signal + noise) − noise) data either as processed spectra or as waveforms (in burst mode).
Noise cancellation of the LFR-Hi channel can also be performed, if needed. While the original design of this receiver only had one 10 kHz to 150 kHz channel, a second but simpler bandpass filter was added to allow the noise signal from the PDDU to be subtracted from the input signal from the electric antenna. Since the noise signal is digitally filtered, the fact that this second channel is not identical to the original is immaterial.
4.6 Data Processing Unit
The Waves data processing unit utilizes two system on a chip (SoC) architectures implemented in radiation tolerant field programmable gate array (FPGA) technology, the host FPGA and the digital signal processor (WvFE) FPGA. These two FPGAs are responsible for collecting science and housekeeping data, applying digital signal processing techniques, data compression and formatting, and provide an interface to the spacecraft command and telemetry channels.
The primary processor of the DPU is the host FPGA. The host FPGA is based on a single processor core called the Y180s; a fault tolerant Z80 derivative. The Y180s, coupled with a memory management unit, interrupt controller and bus controller, provides the minimum hardware support needed by the University of Iowa’s real time operating system, a custom OS developed specifically for use in real time systems. This fundamental model provides a means to manage memory, handle task scheduling, and provides basic processing capabilities. In addition to this model, the host FPGA incorporates two serial interfaces to the Juno spacecraft, each of which is redundant; a channel that handles commands and low-speed telemetry and a high-speed telemetry channel, each conforming to the RS-422 specification. Further filling out the host FPGA are interfaces to control the state of the receivers and a single housekeeping 16-bit analog-to-digital converter (ADC) channel to periodically take system health measurements. Lastly, a real time interrupt (RTI) provides the scheduling heartbeat of the system and is phase locked to the spacecraft time pulse. The RTI cadence is 40 Hz, providing 25 millisecond scheduling granularity of tasks.
Supplementing the host FPGA’s capabilities, the DSP FPGA is responsible for capturing and analyzing scientific data. The DSP FPGA interfaces with three low frequency receiver ADCs, two high frequency receiver ADCs, and two wideband receiver ADCs, for a total of seven channels. Specialized ADC controllers within the DSP FPGA capture waveforms at a programmed size and sample rate, format the samples in two’s complement, and then place the resultant data in waveform memory. Once data are available in waveform memory various operations may be performed. A Rice compression processor that is capable of losslessly compressing 12-bit or 16-bit integer data provides a method for compressing raw waveforms. Additionally, signal-processing techniques may be applied on the data using the UI’s custom DSP processor architecture, the Waves FFT Engine (WvFE).
The WvFE processor is a programmable general-purpose digital signal processor which performs DSP calculations in IEEE 754 floating point arithmetic. The processor is capable of executing two instructions per clock with a peak performance of 21 million floating-point operations per second (MFLOPS) and 10.5 million integer operations per sec (MIPS) at 21 MHz. Several signal processing algorithms have been implemented in programs specific to the WvFE architecture, including waveform windowing, the fast Fourier transform, spectral averaging and binning, as well as noise cancellation. Given the programmable nature of the WvFE architecture, the software load that defines its operations may be updated to extend or modify the DSP capabilities of the instrument.
The DPU has several memories; each addressing a specific storage need for various aspects of the instrument’s operation. A programmable 32-kilobyte read only memory is used to store Y180s boot code. Once booted, the Y180s makes use of a two-megabyte random access memory to store the running operating system, applications, and formatted telemetry buffers. The DSP FPGA has an independent local memory due to the bandwidth requirements of the WvFE processor. This memory, known as the waveform memory, is eight megabytes and is used to store raw waveforms, WvFE programs, compressed data, and spectral products.
4.7 Resource Requirements
The Waves mass is detailed in Table 2. Power required for the various Waves operating modes are given in Table 3. Note that the power states include electric preamp heater power. The Waves instrument can produce a wide range of telemetry rates. In its APO mode, the rate is about 70 bps and PER mode requires 1824 bps. Some of the burst modes produce an average of ∼ 200 kbps. A bit more than 2 Gb are allocated to Waves for framed telemetry; data that are packaged for eventual transmission to the ground. Most of this is used for observations obtained near perijove.
Table 2 Waves mass summary
Table 3 Waves power by mode
4.8 Electromagnetic Interference Mitigation
Juno’s power management system utilizes a Solar Array Switch Module (SASM) to match power from the solar arrays to the instantaneous load by switching strings of solar cells into or out of the circuit when more or less power is required. The switching rate can be as high as 1000 times per second, although this rate is never really realized. Nevertheless, connecting or disconnecting a string of solar cells changes the potential of each cell in the string in a significant way. And, to have the capability to switch at a millisecond rate implies that the frequency content of such a switch can extend across a substantial portion of the low-frequency portion of the Waves spectrum.
During the development of the Juno flight system, it was recognized that the direct energy transfer power system used by the spacecraft presented a significant risk of inducing EMI into the radio and plasma wave measurements. In a direct energy transfer system, the solar array is connected directly to the batteries and spacecraft power bus. This allows an efficient, low mass power system, but results in the power bus being exposed to the external plasma environment, providing a path for electrical perturbations on the power bus being conducted to the outside environment.
To address the sensitivity requirements of the radio instruments on board, a multi-pronged approach was developed to lower the ambient EMI from the spacecraft (Blackburn et al. 2011). For the Waves and MWR measurements above a few MHz, passive filters were installed on each solar array string. Due to the large number of strings, the mass required made it not practical to extend the effective range of these filters much below 1 MHz. Additional filtering capacitors were also installed on the power bus, to decrease the bus impedance and reduce the ripple at lower frequencies. The inflight experience to date shows that the filtering has been highly effective and no high frequency interference from the spacecraft has been noted by either Waves or MWR.
Another EMI reduction approach involves the string switching used to regulate the solar array power. When the power system detects a difference between the power being delivered by the solar array and used by the flight system, the power system will automatically open or close string switches to bring the power into balance. This activity occurs at a fairly high rate, well within the bandwidth of the Waves instrument. When a string is opened or closed, there will be a large voltage transient on that string, as the voltage changes between the open circuit voltage and the power bus voltage. Ignoring plasma effects, this change in potential of one part of the spacecraft results in counterbalancing change in the rest of the exposed spacecraft area. Even though the voltage change can be divided by the proportional areas and reduced by the Waves input common mode rejection, calculations indicated that it would be a significant source of interference. And, in fact, early operations of the Waves instrument demonstrated interference up to a few kHz when nothing was done to control this interference.
To mitigate this interference, a time-sharing approach was developed. When Waves is in a nominal prime science mode, one spectrum per second is generated. To generate this spectrum, waveform samples from the LFR are collected in the first ∼ half of the second. Since both the spacecraft and instrument have knowledge of the time, a timesharing arrangement was devised where the spacecraft can suppress string switching during a programmable fraction of a second. A command is then sent to the Waves instrument, which is then aware of which fraction of the second will be quiet. Inflight experience has shown that this mitigation technique has been extremely effective. As expected, the solar array switching causes a great deal of low frequency interference. This is seen in both the low frequency electric and magnetic channels, with lower levels in the medium frequency electric. However, by implementing the timesharing scheme, virtually all of the switching noise is avoided.
During the development of the EMI mitigation program for the Juno spacecraft, considerable effort was expended attempting to estimate expected inflight noise levels. The results of this indicated significant uncertainty for the lower frequency noise levels that would be present on the power bus and therefore exposed outside the spacecraft Faraday shield. Additional uncertainty resulted from variable effects such as the increase in battery resistance as a function of aging and plasma effects.
Adaptive Noise Cancellation
To mitigate an unknown and variable noise source, an adaptive noise cancellation system was implemented. This system takes a noise channel input and attempts to subtract it from a signal channel. The signal is obtained from the Waves sensor inputs, the noise channel is obtained from a tap onto the spacecraft power bus provided by the spacecraft from the power distribution unit. To protect the spacecraft from any faults the signal is coupled through two series redundant capacitors and an isolation transformer. This coupling method results in a significant rolloff of the noise signal below 1 kHz. The noise signal is digitized simultaneously with each of the low frequency electric (LFR-Lo), low frequency magnetic (LFR-B), and medium frequency electric (LFR-Hi) signals. The gain on the noise signal was chosen to be the same as for the electric antenna input since it was considered that there was more risk to the desired measurements from large signals, and extra gain would run a risk of saturation which would make the system unusable. Bench level measurements made prior to spacecraft integration demonstrated success in cancelling a sinusoidal interference signal 60 dB above the noise level. The noise cancellation algorithm included with the initial flight software load is a basic adaptive filter algorithm. The algorithm seeks to minimize the error function by matching the transfer function of an internal finite impulse response (FIR) filter to the unknown transfer function between the noise source and the receiver.
The DSP implements the noise reduction algorithm as a data preprocessing step for the LFR receivers. It does this by applying an adaptive Least Mean Squares (LMS) filter (cf. Widrow and Stearns 1985) to the data. The LMS filter consists of a number of filter coefficients. The filter coefficients can be thought of as a transfer function to transform the noise data \((N)\) to the same space as the data channel \((S+N)\). After applying the transfer function, the noise can be subtracted from the \((S+N)\) data to produce the signal-only data \((S)\). The LMS scheme minimizes, in the least squares sense, the output \(S\). The noise coefficients are continuously modified to produce the minimum output. For each of the three LFR channels, a filter table of length 33 is initially configured, with all values of the filter coefficients set to zero (i.e., nothing is known about the transfer function). The length can be increased, up to a maximum of 65, but at a CPU usage cost. Using 33 coefficients for all 3 channels results in a CPU usage which allows the processing of spectra once every second. Going to 65 coefficients would require that the cadence be decreased to once every 2 seconds.
The default output is the filtered data \(S\), Fourier-analyzed and binned. Two diagnostic modes are implemented. First, a High Speed diagnostic mode is implemented, where the raw waveforms of the \(S+N\), \(N\), and \(S\) data sets are output via the HRS interface. Second, a Low Speed diagnostic mode is implemented, in which the Fourier-analyzed and binned spectra of the \(S+N\), \(N\), and \(S\) data sets are downlinked via the LRS interface.
Inflight performance of this system to date has been inconclusive, primarily because minimal noise on the PDDU voltage has been observed. The algorithm is best suited for continuous signals, while the majority of the noise seen by the instrument has been impulsive. The noise environment and the utility of the noise cancellation capability has been tested in the solar wind and in Earth’s magnetosphere during the Earth flyby. For these tests, only a fraction of the solar array strings were needed to supply adequate power to the flight system. Additional testing will occur during early Jupiter orbits to determine whether the noise cancellation is needed and, if so, is effective in the Jovian environment.
5 Calibration and Performance
5.1 Calibration Procedure
The Juno Waves engineering team performed an extensive series of amplitude calibrations, frequency responses, and instrument performance checks prior to launch, both before and after integration on the spacecraft. The primary calibration goal is to derive physical units (spectral density, etc.) from the instrument telemetered outputs. Calibrations were primarily performed by applying input signals at known amplitudes and frequencies, and recording the output of the instrument. Calibration tests were performed on each of the individual receivers, on the search coil sensor, and finally as an end-to-end calibration (sensor + receiver). The primary calibration was performed at \(+22^{\circ}\mbox{C}\), with additional testing performed at \(-35^{\circ}\mbox{C}\) and \(+75^{\circ}\mbox{C}\) to characterize the instrument at the predicted temperature extremes.
Electric field calibrations of the receivers were performed by applying signals with known amplitudes at the preamplifier inputs and relating the input signal strength with the resulting telemetry value. As described below, the telemetry values from the various receivers are related to the input signal strength either via a set of look-up tables or through an analytical function that fits the ground calibration data.
5.1.1 Electric Antenna
There are two aspects of the electric antenna that affect the calibration of electric field signals. First, the effective length of the antenna in the long wavelength approximation allows a detected voltage measured at the preamplifier input to be converted to an electric field \(E=V/L_{eff}\). Typically, \(L_{eff}\) is one-half of the tip-to-tip length of a linear dipole antenna. For a V-shaped antenna as used on Juno, the geometric \(L_{eff}\) is the length of a line segment between the center points of the two elements. For the Juno geometry, this is 2.41 m. However, the electric properties of the antenna can be significantly different from the physical ones, especially in this case of a relatively short antenna in the presence of a very large spacecraft, including solar panels that are much longer than the Waves antennas.
Sampl et al. (2012, 2016) analyzed the electrical properties of the Waves antenna using both rheometry measurements involving a scale model of the Juno flight system in a water bath as well as surface patch modeling. While several surface patch models were employed to verify the rheometry results, we use, here, the surface patch result of an effective dipole of length 1.46 m extended parallel to the spacecraft y-axis, to within 0.5 degrees (see Table 2 from Sampl et al. (2016)).
The other effect one needs to consider in converting measured voltages to the applied electric fields is the so-called voltage divider effect resulting from the antenna capacitance \(C_{A}\) and the base capacitance of the preamplifier \(C_{b}\) giving \(L'= L_{eff} C_{A}/(C_{A}+C_{b})\). The input capacitance of the antenna is 22.15 pF as measured on the flight-like qualification unit. The antenna capacitance is 14.69 pF (Sampl et al. 2016). Hence, if we take the measured preamp input capacitance as the base capacitance, the capacitive divider factor is 7.99 dB. \(L'\), then, is 0.58 m. There is another component to the base capacitance, however. This is the capacitance due to the surrounding structure. While this can be modeled, it is not known accurately. In principle, the frequency of the antenna resonance could be used to determine this, empirically. However, to reduce the maximum input amplitude to the preamp in the HFR frequency range, damping was added to the preamp circuit to flatten the response near the antenna resonance, hence we cannot identify this frequency. Using an estimate of an additional 10 pF of base capacitance due to the surrounding structure, the total base capacitance might be estimated to be 32 pf, hence, \(C_{A}/(C_{A}+C_{b}) = 14.69/46.69 = 0.31\) or about 10 dB. Using this value, \(L'= 0.46~\mbox{m}\). The overall loss expressed as the ratio of \(L'\) to the geometric \(L_{eff}\) is 14.4 dB.
Another aspect of the Sampl et al. (2012) antenna calibration involved the detailed antenna pattern of the Waves antenna as a function of frequency. This is important to understand for use in direction-finding, or even in understanding field strengths as the beam can affect the received signal strength as a function of direction. At low frequencies, the antenna acts like a short dipole with a typical toroidal beam. Sampl et al. find that the expected dipole antenna pattern remains stable up to 4 to 5 MHz. However, above this, multiple lobes and serious distortions from the large, asymmetric spacecraft ground plane come into play. Care must be used for things like direction-finding at higher frequencies.
5.1.2 Magnetic Antenna
The amplitude response of the search coil sensor and amplifier were determined in a two-step process. Initially, a detailed calibration of the search coil was performed in a Mu-metal shield by applying a known signal to a calibration coil to produce a magnetic field with a known magnitude. The resulting data relate input field strength to the voltage at the magnetic preamplifier output over the frequency range of the sensor. The second step related the voltage input to the receiver and the output telemetry value. Combining these two steps provides an overall end-to-end calibration of the magnetic field wave measurements. The search coil was also attached to the Waves instrument and end-to-end calibrations were performed by driving the calibration coil to produce a known magnetic field strength and verifying the expected telemetry values.
The section on the search coil design includes the transfer function for the antenna. The pre-launch calibration included the search coil noise levels as shown in Fig. 23. Other than the incorporation of the search coil transfer function, the amplitude calibration of the LFR-B channel was carried out in the same manner as for the LFR-Lo electric channel described below.
Fig. 23
Waves search coil noise levels determined via bench testing prelaunch
5.1.3 High Frequency Receiver
The Juno Waves instrument contains two nearly identical high frequency receivers HFR and HFWBR. In principle, one of the receivers operates as the HFR (High Frequency Receiver) and the other as the HFWBR (High Frequency Waveform Receiver). In practice, the HFR sensitivity is better than the HFWBR, so both survey and burst mode observations use the HFR. HFR products are reduced frequency resolution products and provide a constant background survey. Waveform products contain roughly 1000 times the frequency resolution of survey products and correspondingly have much greater storage and telemetry bandwidth requirements.
The HFR utilizes signals from the electric dipole and is capable of covering the range from 100 kHz to 45 MHz, though typical science data from the HFR cover the frequency range from ∼ 137 kHz to ∼ 41 MHz. The baseband channel of the HFR (100 kHz–3 MHz) is a broadband channel that is sampled at a rate of 7 Msps with 12 bit resolution. This waveform is sent to the DSP for onboard spectrum analysis and is converted to survey data products covering the range of 137 kHz to 2.98 MHz. The frequency range above \(\sim 3~\mbox{MHz}\) is covered by using a synthesized frequency mixed with the incoming signals in 1-MHz bands and the amplitude in each of the channels is detected sequentially as in a swept frequency receiver. The power in each band is recorded via a log amplifier whose output is sampled with 8-bit resolution. Though the instrument may be commanded to set the center frequency of the 1 MHz bands as high as 44.75 MHz, standard HFR science operations are conducted with a 41 MHz top edge.
For burst waveform data, the baseband (100 kHz–3 MHz) is sampled at 7 Msps with 12-bit resolution. High-frequency (above 3 MHz) science products are not derived from log amplifier measurements. Instead two synthesized signals are mixed with the incoming signal. Both synthesized I and Q signals are at the same frequency but the second signal is phase shifted by 90 degrees relative to the first. Both frequency-mixed signals are sampled at 1.3125 MHz with 12-bit resolution.
Electric field calibrations of the HFR receiver were performed by applying pure sine-wave tones at 1 MHz (baseband), 3.5 MHz, 6.5 MHz, 10.5 MHz, 21.5 MHz, 29.5 MHz, and 38.5 MHz at the preamplifier inputs. The amplitude of the input signal was stepped in 2 dB increments to cover the complete amplitude range of the receiver and the resulting telemetry values were recorded. This test was repeated for different configurations of the electric preamp and HFR receiver attenuator settings. A linear fit was performed on the resulting center part of the curves of input voltages vs. output telemetry values, producing a look-up table of input voltage to output telemetry values.
The frequency response of the HFR receivers was determined by applying pure sine-wave tones of fixed amplitude to the input of the electric preamplifier, sweeping the signal across the frequency band of the receiver, and measuring the output telemetry values of the receivers. An example of such a frequency response is shown in Fig. 24.
Fig. 24
Example frequency response of the 12.5 MHz HFR channel
Combining the results of the amplitude calibrations with the frequency sweep calibration, a look up table was created for the HFR receiver containing an electric field voltage value for each output telemetry value of each frequency channel of the receivers.
Amplitude calibrations were performed for each of a number of attenuator settings of the electric preamp and the HFR/HFWBR receivers. From these tests, attenuation or gain values were determined for each possible combination of attenuation settings, and are recorded in a look-up table.
5.1.4 Low Frequency Receiver
The Low Frequency Receiver (LFR) comprises two identical low-frequency channels (LFR-Lo and LFR-B) covering the range from ∼ 50 Hz to ∼ 20 kHz and allows measurements of both the electric and magnetic component of waves when utilizing both sensors. A third channel in the LFR (LFR-Hi) analyzes signals only from the electric dipole and covers the frequency range of ∼ 10 kHz to ∼ 150 kHz. The outputs from the LFR-Lo and LFR-B channels are digitized waveforms consisting of 50 ksps at 16-bit resolution. The waveforms are sent to the Digital Signal Processor (DSP) for on board spectrum analysis. The output from the LFR-Hi channel is digitized at a rate of 375 ksps with 16-bit accuracy. This waveform is also analyzed by the DSP.
Electric field calibrations of the LFR-Lo, LFR-B, and LFR-Hi channels were performed by applying signals at 5 kHz and 25 kHz, respectively, at the preamplifier inputs. The amplitude of the input signal was stepped in 2 dB increments to cover the complete amplitude range of the receiver and the resulting telemetry values were recorded as shown in Fig. 25. This test was repeated for each possible configuration of the electric preamp and LFR receiver attenuator settings. A linear fit was performed on the resulting center part of the curves of input voltages vs. output telemetry values, producing a look-up table of input voltage to output telemetry value at 5 and 25 kHz.
Fig. 25
Example amplitude calibration for the LFR-Lo channel
The frequency response of the LFR receivers was determined by applying input signals of fixed amplitude to the input of the electric preamplifier, sweeping the signal across the frequency band of the receivers, and measuring the output telemetry values of the receivers.
Combining the results of the amplitude calibrations at 5 and 25 kHz with the frequency sweep calibration, a look-up table was created for the LFR-Lo and LFR-Hi receivers containing an electric field voltage value for each output telemetry value for each frequency channel of the receivers.
Amplitude and frequency sweep calibrations were performed with the search coil attached to the LFR-B receiver by driving a calibration coil in a Mu-metal shield to produce a known magnetic field strength at the search coil sensor and measuring the output telemetry values of the LFR. These test results were used to create a look-up table containing the magnetic field (nT) for each output telemetry value of each frequency channel of the receiver.
Amplitude calibrations were performed for each attenuator setting of the electric preamp and the LFR receivers. From these tests, attenuation or gain values were determined for each possible combination of attenuation settings.
Calibration look-up tables and a description of the calibration process are archived with the data in the Planetary Data System.
5.2 Performance
Waves performance after launch has mostly been as expected from prelaunch testing. Shortly after launch some anomalous operations of the instrument were observed. These all seemed to be associated with an invalid address appearing on a particular bus in the WvFE processor. To date, the root cause of this issue has not been determined. However, Waves flight software has been modified to re-load software to the WvFE processor after the address fault is detected. While this reset and reload of the processor can result in the loss of a few instrument cycles of data acquisition, no long-lived issues have been noted since this flight software change.
One issue that was known prior to launch was some variation in the output of the engineering analog-to-digital converter (ADC) which results in some fluctuations in engineering parameter readings and in the HFR survey values for frequencies above 3 MHz. The source of this behaviour is thought to be an oscillation in the ADC circuit resulting from improper capacitor values used in this circuit. The issue has only been observed infrequently in flight. Resetting the ADC circuit seems to be effective in stopping the oscillation, hence, the ADC is reset along with major mode changes in each sequence. The reset can also be applied by realtime commands, if necessary.
The in-flight noise levels are as would be expected from prelaunch data. Those for the LFR-B channel are shown in Fig. 26. The electric field in-flight noise levels are shown in Fig. 27 and compared to prelaunch values. Again, these are as expected from prelaunch data. The HFR baseband channel covering the frequency range from about 140 kHz to about 3 MHz did not achieve its required sensitivity at 1 MHz due to a number of fabrication issues that could not be resolved in time for instrument delivery. This requirement was waived with the belief that the as-flown sensitivity in this band would provide useful information for observations close to Jovian radio sources in this band.
Fig. 26
Waves search coil in-flight noise levels
Fig. 27
Waves electric noise levels
Earth flyby provided an opportunity to understand the Waves performance in a planetary magnetosphere as shown in Fig. 28. Notice the clear detection of whistler mode chorus and plasmaspheric hiss in both the electric and magnetic channels and electron cyclotron harmonics (ECH) in the electric channel. At the highest frequencies terrestrial radio stations were detected near closest approach. Figure 13 shown above provides an example of the waveform receiver high spectral and temporal resolution observations for short intervals. It should be pointed out, however, that the necessity of avoiding SASM switching, discussed above in the section on electromagnetic interference mitigation, basically means that waveforms obtained when the solar arrays are being managed for power balance will suffer from interference. As a result, the waveforms from LFR-B, LFR-Lo, and LFR-Hi are only obtained once per second. This means that while good spectral and temporal resolution is afforded by the waveform measurements, these are typically obtained for 123 ms each second for LFR-B and LFR-Lo and 16 ms for LFR-Hi.
Fig. 28
Waves observations during Earth flyby
6 In-Flight Operations, Data Processing, and Archiving
6.1 In-Flight Operations
Waves is a relatively simple instrument with only two sensors. However, the desire to make high resolution (in both time and frequency) measurements in Jupiter’s auroral region on a highly constrained telemetry allocation leads to some complexities. In order to discuss operating modes, it is necessary to describe the data products produced by the instrument.
6.1.1 Waves Data Products
Survey Data
The purpose of Waves survey data is to capture complete electric and magnetic spectra for the entire frequency range on a regular cadence. This means that spectra from each of the receivers will be collected covering the frequency range of 50 Hz to 41 MHz for the electric field and from 50 Hz to 20 kHz for the magnetic field. The cadence is determined by where Juno is located, coupled with telemetry restrictions. In Jupiter orbit, it is anticipated that the highest cadence will be used during the approximately 12 hours around perijove. This mode is called Periapsis (PER) mode and returns a complete electric and magnetic spectrum every second. For several hours before and after the periapsis period, an intermediate cadence may be used, called Intermediate (INT) mode, which returns a complete electric and magnetic spectrum every 10 seconds. During the outermost portions of the orbit, comprising most of the orbital period, the Apoapsis (APO) mode will be used which collects a spectrum from both the electric and magnetic sensors once every 30 seconds. The investigations involved in the Magnetospheric Working Group of the Juno Science Team have also identified plasma sheet crossings near apoapsis which may be of particular interest. For these observations, lasting of order 12 hours, the Intermediate mode may be used. In practice, Periapsis mode will be used for as much of the orbit as telemetry allocations permit. The Apoapsis mode was also used extensively during cruise except for special observations.
Burst Data
Binning Mode
Waves burst data are waveform series from one or more of the Waves receivers. The waveform series include a defined number of consecutive samples at the appropriate sampling rate for each receiver that are typically losslessly compressed and telemetered to the ground to provide high temporal resolution measurements, or alternately, high spectral resolutions for particular periods of interest. See Table 1. For the LFR channels (LFR-B, LFR-Lo and LFR-Hi), the series include 6144 consecutive 16-bit samples. For the baseband channel of the wideband function of the HFR or HFWBR, 4096 12-bit samples are collected. For the WBRH (high frequency band) there are 4096 12-bit samples in each of the I and Q data sets. These modes can generate large volumes of data in a short time period, hence, can only be afforded infrequently and for brief periods of time.
The Waves data allocation, at minimum, will only support a few minutes of burst data per orbit, and even the higher allocations possible with the use of 70-m DSN stations increase this by only a factor or four or five. The primary objective for these data is to acquire observations on auroral field lines, those carrying auroral currents. It is expected that a variety of wave phenomena will be present on these field lines, as described above in Sect. 1, however, at the 60 km/s speed of Juno in the low altitude auroral region, auroral features could well be confined to very brief intervals. Further, the times for crossing such features will not be highly predictable. Given that a pass over one of Jupiter’s poles can take on the order of an hour, it is not possible to simply record burst data for the entire passage. Hence we have developed a simple event detection scheme which evaluates the integrated spectral intensity in some combination of the LFR-Lo and -Hi bands and assigns a quality index based on this spectral intensity. The intensity is recorded each second as burst waveforms are being transferred to the spacecraft data system.
To predict approximate times of interest during a given polar pass, we can use a model magnetic field, the trajectory of the spacecraft, and models of Jupiter’s polar aurora using, for example, a tool illustrated in Fig. 29. We can identify an interval of time during which Juno will likely be on field lines threading Jupiter’s main auroral oval and collect waveform burst observations for that interval. For this interval we may choose to record 5 bins of one minute duration, each (as an example). After all 5 bins have been filled at the beginning of the interval, the data system uses the quality index to determine whether a new interval in time is ‘more interesting’ than one already recorded where ‘more interesting’ is defined as having a higher integrated spectral intensity. An interval with a higher quality index will overwrite an existing bin with the lowest quality index. This process is repeated for the full hour. At the end of the burst period, the five bins with the highest quality indices will be saved, formatted for transmission, and queued to be sent to the ground during the ensuing apoapsis period. Typically, the bins are set up to include some data prior to the ‘event’ that was recorded in the quality index. For example, approximately 25% of the duration of the bin includes data prior to the event. However, multiple events can occur during the time span of a burst bin, and this can complicate such a simplistic picture. In addition to the tool illustrated in Fig. 29, we also use a tool provided by R. Gladstone (personal communication, 2015) which shows the location of the foot of the magnetic field line passing through Juno relative to the average auroral features obtained by an HST campaign in 2007 (Bonfond et al. [2012](/article/10.1007/s11214-017-0396-y#ref-CR10 " B. Bonfond, D. Grodent, J.C. Gérard, T. Stallard, J.T. Clarke, M. Yoneda, A. Radioti, J. Gustin, Auroral evidence of Io’s control over the magnetosphere of Jupiter. Geophys. Res. Lett. 39 (2012). doi: 10.1029/2011GL050253
")). This tool includes models for the Io footprint aurora and its wake, hence, we can use this to attempt to target burst data during a crossing of Io’s wake aurora as well as the footprints of the other Galilean satellites. While attractive, we do not anticipate being able to target the actual footprint aurora of Io or other Galilean satellites with Juno. Fig. 29
Example of planning tool used to schedule burst mode activities. The projection of Juno’s trajectory mapped along VIP4 field lines is plotted versus time. The green trace indicates the instrument is in its Perijove survey mode. Red intervals are burst mode binning sessions. The orange interval indicates that the 20-kHz electric channel is being recorded (continuing through the equator and into mid-southern latitudes)
Record Mode
Another type of burst data can be acquired that does not involve quality indices. For example, if one can accurately target a time of interest, it is possible to record a commandable duration of time. This type of burst mode is planned for use at the equator crossing near periapsis, when it is possible Juno might be impacted by micron-sized dust particles from the ring system. The ring material should be located very close to the equator, so we can use a timed recording to acquire electric waveforms that will enable the detection of individual impacts and possibly even estimates of their mass using a pulse-height analysis as has been used with Voyager and Cassini plasma wave data (Gurnett et al. 1983; Ye et al. 2016).
In principle, it is possible to select from which receivers data are acquired in either of the burst types. For example, for bursts at the equator, perhaps just the LFR-Lo data from the electric sensor would be collected since this type of data is similar to that analyzed from Voyager and Cassini. However, for the auroral bursts, we anticipate plasma and radio waves possibly extending over the entire frequency range of the instrument and the likelihood of electromagnetic modes at the lower frequencies, so we will collect waveforms from all of the receivers. The highest frequency phenomenon in the aurora of interest will be the cyclotron maser radio emissions comprising the decametric, hectometric, and kilometric radiation. Since these are produced very close to the electron cyclotron frequency, we will tune the high frequency waveform capture to a 1-MHz band which includes \(f_{ce}\). This provides the possibility to record high resolution observations of the radio emissions at or very close to their source.
6.1.2 Waves Operational Modes
Waves uses a set of Major Modes that are defined to configure the instrument to collect survey and burst data as described in the previous section. Each of these modes is defined in a table of configuration commands sometimes referred to as Instrument Expanded Blocks (IEBs) that are stored in the instrument and reside in memory for one or more spacecraft sequences. In Jupiter orbit, two sequences are expected to cover one of the 53-day orbits. In cruise, sequences nominally run 28 days.
Survey Modes
For survey data, the basic modes are Apoapsis (APO), Intermediate (INT), and Periapsis (PER) modes corresponding to the data products described in Sect. 6.1.1. At present, there are three different variations on these modes, having to do with the noise cancellation capability of the instrument. One variation returns noise-cancelled data for the LFR channels, another returns the traditional data (without noise cancellation) and a third returns both noise-cancelled and traditional data as well as the noise channel from the spacecraft power supply. This latter mode is primarily planned for use in early cruise and at Earth flyby to assess the utility of the noise cancellation algorithm and to provide a basis for improving the algorithm, if needed. It may also be used during early orbits at Jupiter for similar purposes. Because of the additional data returned and the additional data handling involved, this diagnostic mode can return spectra no faster than once per 2 seconds and results in a greater telemetry rate than either of the other modes. It should be noted that by modifying the configurations, additional variations on these modes can be defined. Such changes would entail uploading different IEBs to the Waves memory for use. An example of an additional mode that might be created by a redefined IEB would be an Intermediate mode, for example, that returned a spectrum every 5 seconds instead of every 10 seconds.
Burst Modes
Burst modes that have been defined for Waves closely follow the two basic burst data products described in Sect. 6.1.1.
Because of the need to focus limited telemetry on periods of interest in the auroral regions at Jupiter, the binning mode described above returns waveform data from each of the LFR channels, and the waveforms from the selectable HFR/HFWBR band that includes the local electron cyclotron frequency only for times deemed to be ‘interesting’. Since it is expected that a wide variety of wave phenomena covering a broad frequency range will be found on active auroral field lines, a rather simple algorithm identifying the largest broadband wave intensities has been implemented to capture such interesting times. Such a mode returns electric and magnetic waveforms in the band between 50 Hz and 20 kHz, and electric waveforms from 10 kHz to 150 kHz. Depending on the magnitude of the magnetic field, either the baseband HFWBR channel is selected (100 kHz to 3 MHz) or a 1-MHz wide band including \(f_{ce}\) determined from onboard measurements of \(|B|\) is selected for waveforms. This mode is used with the high speed interface in a high speed binning mode with the Juno Command and Data Handling System (C&DH) in which a commandable number of burst bins of commandable length can be defined and quality factors determined within the Waves instrument are used to identify ‘events’. An identified event will result in storing data beginning somewhat before and after the event in one of the bins in the raw memory portion of the C&DH. Later events with higher quality indices (larger intensities) will overwrite bins with lower quality events. This process continues as long as the binning session is enabled. When the binning session is closed, the bins are formatted for downlink and moved into the framed telemetry portion of the C&DH memory.
The Record Mode will be used to record burst mode data for targeting specific intervals of time for which there is a good understanding of the geometry for the desired phenomenon. The prime example is the jovigraphic equator crossing where the possibility of micron-sized dust impacts exists. Since the equator crossing time is well defined and known well in advance, such a burst observation can be scheduled with a well-defined start and stop time designed to cover the expected latitudinal range of dust.
6.1.3 General Plan of Operations
The general plan for Waves operations during an orbit are quite repetitive but are flexible to account for variations induced by the evolving orbit geometry, the availability of telemetry, or unforeseen circumstances. Note that the Juno planning cycle, called a science activity plan, runs for several weeks, with two per 53-day orbit. One of these runs from about perijove −24 hours to sometime around the following apojove. The second sequence continues from the end of the first and ends about 24 hours prior to the following perijove. The highest priority science is gained near perijove and it is expected that most or all of the data acquired near perijove will be downlinked within several days after perijove. As described above, Waves uses three major survey modes; one of these is expected to be operational at all times during the science phase. The lowest temporal resolution mode, Apoapsis Mode obtains a complete spectrum every 30 seconds (both electric and magnetic), is the nominal mode for the outer portion of the orbit, and is considered the starting mode for each science activity plan to allow for ease in interchangeability. Periapsis mode acquires complete electric and magnetic spectra every second. An intermediate mode is available that acquires spectra once every 10 seconds. Should telemetry resources be available, Periapsis mode will be used for as much of the orbit as possible.
The burst modes described in Sect. 6.1.2 are overlaid on the Periapsis survey mode. Binning Mode burst observations are scheduled primarily to target times when Juno is expected to cross various types of auroral features. Figure 29 shows a plot of the magnetic footprint of Juno for Perijove 1 on the northern hemisphere using the VIP4 magnetic field model (Connerney et al. 1998). The nominal main auroral oval based on Hubble Space Telescope (HST) observations is also shown. The footprint is plotted in yellow for Intermediate Mode, green for Periapsis Mode, and red for Binning burst modes. Two of the burst modes in this figure are targeted to capture crossings of the main auroral oval. The extension of the binning mode well north and south of the nominal oval allows for uncertainties in the magnetic field model used for the mapping. The third burst interval is set to capture polar auroras, possibly in concert with Earth-based observations such as X-ray observations from Chandra or UV observations from HST. In some orbits models suggest Juno’s footprint will cross the wake of Io’s footprint. For these orbits a Binning burst mode may be scheduled to target such an event. It should be noted that while we will look for the possibility of observing the Io footprint, itself (as opposed to its wake) or another of the Galilean satellite footprints, we do not consider such opportunities to be likely and there is no current plan to adjust Juno’s trajectory to target these. Another set of Binning Mode bursts are typically scheduled for the outbound southern hemisphere trajectory.
A Record Mode burst activity will typically be scheduled to cover the jovigraphic equatorial region. Until actual observations are available to understand the possible vertical extent of dust near the equator, this recording will be 20 minutes centered on the equator. These record modes may be extended to cover intermediate latitudes where lightning whistlers might be expected.
6.2 Data Processing
Juno Waves data processing is a largely automated process. A set of semi-automated processes acquire telemetry data from the Jet Propulsion Laboratory when available during and after a Deep Space Network (DSN) tracking pass. Two levels of data are generated by the processing pipeline. First, an Experiment Data Record (EDR) is generated that is uncalibrated and most closely represents the acquired measurements from the Waves instrument. This data set has been expanded from any compression that has been applied onboard, primarily for waveform measurements that may have been losslessly compressed. The instrument also uses a 9-bit floating point compression scheme for survey measurements. Juno employs a product accounting system that keeps track of data products that were transmitted, but not received properly. Such products are re-transmitted so that missing data can be filled, minimizing data gaps. The resulting data set is a Committee on Data Management and Computation (CODMAC) Level 2 data set commonly referred to as an Experiment Data Record (EDR) (Committee on Data Management and Computation 1986).
Once the Level 2 EDR exists, another semi-automated process is spawned which applies the most recent calibration and creates comma separated value (CSV) files of the low rate survey data. This is a full resolution, calibrated data set and is used for most science applications. Waveform data are calibrated for proper amplitude for a frequency well within the analysis band of the respective receiver and stored as a binary time series file for each receiver in units of electric or magnetic field amplitude. In principle, it is possible to use the frequency response of each receiver to calibrate across each band for the waveform data, but this is only done for special studies as it requires a Fourier transform into frequency space and then back into a time series which, among other things, is an intensive process with little gain for most applications. The calibrated survey and waveform data products correspond to CODMAC Level 3 data sets.
The frequency down-conversion process of the HFWBR function significantly alters the time domain signal received from the electric antenna (Pickett et al. 2014) and thus only reconstructed spectra are designed to be archived. Original waveforms for burst data above 3 MHz are only present in raw form in the Level 2 dataset.
Some additional data processing may be performed on the basic data described above to derive some basic parameters. For example, for some time periods an electron density can be determined from the frequency of Langmuir waves in the solar wind, upper hybrid bands in the magnetosphere or the low-frequency cutoff of continuum radiation trapped in the magnetosphere (Barnhart et al. 2009). Dust detection algorithms developed for Voyager and Cassini can be applied to Juno waveform observations to idenify and characterize dust grains, particularly near Jupiter’s ring plane (cf. Ye et al. 2016).
A vast portion of the Juno Waves data analysis software utilizes a tool known as autoplot as described at http://autoplot.org. While this is foremost a data visualization tool, it can also incorporate special scripts including analysis algorithms, functions involving Waves or other Juno data sets, etc.
6.3 Archiving
The Juno Waves data are archived in the Planetary Data System’s (PDS) Planetary Plasma Interactions Node. Two primary data sets have been defined for archive which correspond to the Level 2 EDRs (https://pds-ppi.igpp.ucla.edu/data/JNO-E_J_SS-WAV-2-EDR-V1.0) and Level 3 full resolution calibrated data (https://pds-ppi.igpp.ucla.edu/data/JNO-E_J_SS-WAV-3-CDR-SRVFULL-V1.0 and https://pds-ppi.igpp.ucla.edu/data/JNO-E_J_SS-WAV-3-CDR-BSTFULL-V1.0) described above. The Level 2 dataset includes as-flown sequence information. The Level 3 datasets include full calibration files with documentation on how the telemetry data are converted to physical units. Here, the data set levels correspond to those in CODMAC (Committee on Data Management and Computation 1986). Since the archived data are those that are used by the Juno team for science analysis, most issues in the archived data sets are revealed through use well before they end up in the PDS. The Waves data for the mission up to Jupiter Orbit Insertion are available through the PDS. The schedule for archiving orbital data is for data from two orbits to be archived within about 6 months from the point in time when all of the telemetry and ancillary data are available to the Waves team. In addition to the data files, themselves, all of the PDS required documentation is included. Browse data in the form of pre-computed frequency-time spectrograms are supplied as an easy means of finding events in the Waves archive without expending any programming effort to read the data files.
References
- A. Adriani, G. Filacchione, T. Di Iorio et al., JIRAM, the jovian infrared auroral mapper. Space Sci. Rev. (2014). doi:10.1007/s11214-014-0094-y
Google Scholar - M.G. Aubier, N. Meyer-Vernet, B.M. Pedersen, Shot noise from grain and particle impacts in Saturn’s ring plane. Geophys. Res. Lett. 10, 5–8 (1983)
Article ADS Google Scholar - F. Bagenal, A. Adriani, F. Allegrini, S.J. Bolton, B. Bonfond, E.J. Bunce, J.E.P. Connerney, S.W.H. Cowley, R.W. Ebert, G.R. Gladstone, C.J. Hansen, W.S. Kurth, S.M. Levin, B.H. Mauk, D.J. McComas, C.P. Paranicas, D. Santos-Costa, R.M. Thorne, P. Valek, J.H. Waite, P. Zarka, Magnetospheric science objectives of the Juno mission. Space Sci. Rev. (2014). doi:10.1007/s11214-014-0036-8
Google Scholar - D.D. Barbosa, W.S. Kurth, Theory and observations of electrostatic ion waves in the cold Io torus. J. Geophys. Res. 95, 6443–6450 (1990)
Article ADS Google Scholar - D.D. Barbosa, F.L. Scarf, W.S. Kurth, D.A. Gurnett, Broadband electrostatic noise and field-aligned currents in Jupiter’s middle magnetosphere. J. Geophys. Res. 86, 8357–8369 (1981)
Article ADS Google Scholar - B.L. Barnhart, W.S. Kurth, J.B. Groene, J.B. Faden, O. Santolik, D.A. Gurnett, Electron densities in Jupiter’s outer magnetosphere determined from Voyager 1 and 2 plasma wave spectra. J. Geophys. Res. 114, 05218 (2009)
Google Scholar - E.K. Bigg, Influence of the satellite Io on Jupiter’s decametric emission. Nature 203, 1008–1010 (1964)
Article ADS Google Scholar - T.J. Birmingham, J.K. Alexander, M.D. Desch, R.F. Hubbard, B.M. Pedersen, Observations of electron gyroharmonic waves and the structure of the Io plasma torus. J. Geophys. Res. 86, 8497 (1981)
Article ADS Google Scholar - K. Blackburn, B. Lessard, D. Kirchner, W. Kurth, Controlling low frequency interference from direct energy transfer spacecraft power systems electromagnetic compatibility (EMC), in 2011 IEEE International Symposium on Electromagnetic Compatibility (IEEE, Piscataway, 2011), pp. 840–845
Chapter Google Scholar - B. Bonfond, D. Grodent, J.C. Gérard, T. Stallard, J.T. Clarke, M. Yoneda, A. Radioti, J. Gustin, Auroral evidence of Io’s control over the magnetosphere of Jupiter. Geophys. Res. Lett. 39 (2012). doi:10.1029/2011GL050253
- B.F. Burke, K.L. Franklin, Observations of a variable radio source associated with the planet Jupiter. J. Geophys. Res. 60, 213–217 (1955)
Article ADS Google Scholar - C.W. Carlson, R.F. Pfaff, J.G. Watzin, The Fast Auroral SnapshoT (FAST) mission. Geophys. Res. Lett. 25, 2013–2016 (1998)
Article ADS Google Scholar - B. Cecconi, Influence of an extended source on goniopolarimetry (or direction finding) with Cassini and solar terrestrial relations observatory radio receivers. Radio Sci. 42(2) (2007). doi:10.1029/2006RS003458
- B. Cecconi, L. Lamy, P. Zarka, R. Prangé, W.S. Kurth, P. Louarn, Goniopolarimetric study of the revolution 29 perikrone using the Cassini Radio and Plasma Wave Science instrument high-frequency radio receiver. J. Geophys. Res. 114, 03215 (2009)
Google Scholar - J.T. Clarke, J. Ajello, G. Ballester, L. Ben Jaffel, J. Connerney, J.-C. Gérard, G.R. Gladstone, D. Grodent, W. Pryor, J. Trauger, J.H. Waite, Ultraviolet emissions from the magnetic footprints of Io, Ganymede, and Europa on Jupiter. Nature 415, 997–1000 (2002)
Article ADS Google Scholar - Committee on Data Management and Computation, Issues and Recommendations Associated with Distributed Computation and Data Management Systems for the Space Sciences (National Academy Press, Washington, D.C., 1986), pp. 31–32
Google Scholar - J.E.P. Connerney, R. Baron, T. Satoh, T. Owen, Images of excited \({\mathrm{H}_{3}}^{+}\) at the foot of the Io flux tube in Jupiter’s atmosphere. Science 262, 1035–1038 (1993)
Article ADS Google Scholar - J.E.P. Connerney, M.H. Acuña, N.F. Ness, T. Satoh, New models of Jupiter’s magnetic field constrained by the Io flux tube footprint. J. Geophys. Res. 103, 11929–11939 (1998)
Article ADS Google Scholar - J.E.P. Connerney, M. Benn, J.B. Bjarno, T. Denver, J. Espley, P.S. Jorgensen, P. Lawton, A. Malinnikova, J.M. Merayo, S. Murphy, J. Odom, R. Oliversen, R. Schnurr, D. Sheppard, E.J. Smith, The Juno magnetic field investigation. Space Sci. Rev. (2017). doi:10.1007/s11214-017-0334-z
Google Scholar - A.F. Cook II, T.C. Duxbury, G. Hunt, First results on jovian lightning. Nature 280, 794 (1979)
Article ADS Google Scholar - F.V. Coroniti, F.L. Scarf, C.F. Kennel, W.S. Kurth, D.A. Gurnett, Detection of Jovian whistler mode chorus—implications for the Io torus aurora. Geophys. Res. Lett. 7, 45–48 (1980)
Article ADS Google Scholar - G.T. Delory, R.E. Ergun, C.W. Carlson, L. Muschietti, C.C. Chaston, W. Peria, J.P. McFadden, R. Strangeway, FAST observations of electron distributions within AKR source regions. Geophys. Res. Lett. 25, 2069–2072 (1998)
Article ADS Google Scholar - G. Fischer, M.D. Desch, P. Zarka, M.L. Kaiser, D.A. Gurnett, W.S. Kurth, W. Macher, H.O. Rucker, A. Lecacheux, W.M. Farrell, B. Cecconi, Saturn lightning recorded by Cassini/RPWS in 2004. Icarus 183, 135–152 (2006)
Article ADS Google Scholar - F. Genova, P. Zarka, C.H. Barrow, Voyager and Nancay observations of the jovian radio emission at different frequencies: Solar wind effect and source extent. Astron. Astrophys. 182, 159–162 (1987)
ADS Google Scholar - F. Genova, P. Zarka, A. Lecacheux, Jupiter decametric radiation, in Time-Variable Phenomena in the Jovian System, ed. by M.J.S. Belton, R.A. West, J. Rahe (NASA, Washington, D.C., 1989), pp. 156–174, SP-494
Google Scholar - J.R. Gladstone et al., The Ultraviolet Spectrograph on NASA’s Juno Mission. Space Sci. Rev. (2014). doi:10.1007/s11214-014-0040-z
Google Scholar - D.A. Gurnett, A satellite study of VLF hiss. J. Geophys. Res. 71, 5599–5615 (1966)
Article ADS Google Scholar - D.A. Gurnett, L.A. Frank, Region of intense plasma-wave turbulence on auroral field lines. J. Geophys. Res. 82, 1031–1050 (1977)
Article ADS Google Scholar - D.A. Gurnett, U.S. Inan, Plasma wave observations with the Dynamics Explorer 1 spacecraft. Rev. Geophys. 26, 285–316 (1988)
Article ADS Google Scholar - D.A. Gurnett, F.L. Scarf, Plasma waves in the Jovian magnetosphere, in Physics of the Jovian Magnetosphere, ed. by A.J. Dessler (Cambridge University Press, Cambridge, 1983), pp. 285–316
Chapter Google Scholar - D.A. Gurnett, W.S. Kurth, F.L. Scarf, Plasma wave observations near Jupiter: Initial results from Voyager 2. Science 206, 987 (1979a)
Article ADS Google Scholar - D.A. Gurnett, R.R. Shaw, R.R. Anderson, W.S. Kurth, F.L. Scarf, Whistlers observed by Voyager 1: Detection of lightning on Jupiter. Geophys. Res. Lett. 6, 511 (1979b)
Article ADS Google Scholar - D.A. Gurnett, F.L. Scarf, W.S. Kurth, R.R. Shaw, R.L. Poynter, Determination of Jupiter’s electron density profile from plasma wave observations. J. Geophys. Res. 86, 8199–8212 (1981)
Article ADS Google Scholar - D.A. Gurnett, E. Grün, D. Gallagher, W.S. Kurth, F.L. Scarf, Micron-sized particles detected near Saturn by the Voyager plasma wave instrument. Icarus 53, 236–254 (1983)
Article ADS Google Scholar - D.A. Gurnett, W.S. Kurth, R.R. Shaw, A. Roux, R. Gendrin, C.F. Kennel, F.L. Scarf, S.D. Shawhan, The Galileo plasma wave investigation. Space Sci. Rev. 60, 341–355 (1992)
Article ADS Google Scholar - D.A. Gurnett, W.S. Kurth, G.B. Hospodarsky, A.M. Persoon, P. Zarka, A. Lecacheux, S.J. Bolton, M.D. Desch, W.M. Farrell, M.L. Kaiser, H.-P. Ladreiter, H.O. Rucker, P. Galopeau, P. Louarn, D.T. Young, W.R. Pryor, M.K. Dougherty, Control of Jupiter’s radio emission and aurorae by the solar wind. Nature 415, 985–987 (2002)
Article ADS Google Scholar - S. Hess, B. Cecconi, P. Zarka, Modeling of Io-Jupiter decameter arcs, emission beaming and energy source. Geophys. Res. Lett. 35, 13107 (2008a)
Article ADS Google Scholar - S. Hess, F. Mottez, P. Zarka, T. Chust, Generation of the jovian radio decametric arcs from the Io flux tube. J. Geophys. Res. 113, 03209 (2008b)
Article Google Scholar - S. Hess, P. Pétin, P. Zarka, B. Bonfond, B. Cecconi, Lead angles and emitting electron energies of Io-controlled decameter radio arcs. Planet. Space Sci. 58, 1188–1198 (2010)
Article ADS Google Scholar - S. Hess, E. Echer, P. Zarka, L. Lamy, P.A. Delamere, Multi-instrument study of the Jovian radio emissions triggered by solar wind shocks and inferred magnetospheric subcorotation rates. Planet. Space Sci. 99, 136–148 (2014)
Article ADS Google Scholar - T. Hill, Inertial limit on corotation. J. Geophys. Res. 84, 6554–6558 (1979)
Article ADS Google Scholar - G.B. Hospodarsky, Space-based search coil magnetometers. J. Geophys. Res. 121, 12068–12079 (2016)
Article Google Scholar - G.B. Hospodarsky, W.S. Kurth, B. Cecconi, D.A. Gurnett, M.L. Kaiser, M.D. Desch, P. Zarka, Simultaneous observations of Jovian quasi-periodic radio emissions by the Galileo and Cassini spacecraft. J. Geophys. Res. 109, A09S07 (2004)
Article ADS Google Scholar - M. Janssen et al., MWR: Microwave Radiometer for the Juno Mission to Jupiter. Space Sci. Rev. (2017). doi:10.1007/s11214-017-0349-5
Google Scholar - M.L. Kaiser, Time-variable magnetospheric radio emissions from Jupiter. J. Geophys. Res. 98, 18757–18765 (1993)
Article ADS Google Scholar - M.L. Kaiser, R.J. MacDowall, Jovian radio “bullseyes” observed by Ulysses. Geophys. Res. Lett. 25, 3113–3116 (1998)
Article ADS Google Scholar - M.L. Kaiser, M.D. Desch, M.E. Brown, Evidence for an Io plasma torus influence on high-latitude Jovian radio emission. J. Geophys. Res. 101, 13–18 (1996)
Article ADS Google Scholar - W.S. Kurth, D.A. Gurnett, Plasma waves in planetary magnetospheres. J. Geophys. Res. 96, 18977–18991 (1991)
Article ADS Google Scholar - W.S. Kurth, M.M. Baumback, D.A. Gurnett, Direction-finding measurements of auroral kilometric radiation. J. Geophys. Res. 80, 2764–2770 (1975)
Article ADS Google Scholar - W.S. Kurth, D.D. Barbosa, D.A. Gurnett, F.L. Scarf, Electrostatic waves in the Jovian magnetosphere. Geophys. Res. Lett. 7, 57–60 (1980)
Article ADS Google Scholar - W.S. Kurth, D.A. Gurnett, S.J. Bolton, A. Roux, S.M. Levin, Jovian radio emissions: An early overview of Galileo observations, in Planetary Radio Emissions IV, ed. by H.O. Rucker, S.J. Bauer, A. Lecacheux (Austrian Academy of Sciences, Vienna, 1997), pp. 1–13
Google Scholar - W.S. Kurth, T.F. Averkamp, D.A. Gurnett, Z. Wang, Cassini RPWS observations of dust in Saturn’s E ring. Planet. Space Sci. 54, 988–998 (2006)
Article ADS Google Scholar - W.S. Kurth, D.A. Gurnett, J.D. Menietti, R.L. Mutel, M.G. Kivelson, E.J. Bunce, S.W.H. Cowley, D.L. Talboys, M.K. Dougherty, C. Arridge, A. Coates, S. Grimald, L. Lamy, P. Zarka, B. Cecconi, P. Schippers, N. André, P. Louarn, D. Mitchell, J.S. Leisner, M. Morooka, A close encounter with a Saturn Kilometric Radiation source region, in Planetary Radio Emissions VII, ed. by H.O. Rucker, W.S. Kurth, P. Louarn, G. Fischer (Austrian Academy of Sciences, Vienna, 2011), pp. 75–86
Google Scholar - H.P. Ladreiter, P. Zarka, A. Lecacheux, Direction-finding study of Jovian hectometric and broadband kilometric radio emissions: Evidence for their auroral origin. Planet. Space Sci. 42, 919–931 (1994)
Article ADS Google Scholar - L. Lamy, P. Zarka, B. Cecconi, S. Hess, R. Prangé, Modeling of Saturn kilometric radiation arcs and equatorial shadow zone. J. Geophys. Res. 113, A10213 (2008)
ADS Google Scholar - L. Lamy, P. Schippers, B. Zarka, P. Cecconi, C.S. Arridge, M.K. Dougherty, P. Louarn, N. André, W.S. Kurth, R.L. Mutel, D.A. Gurnett, A.J. Coates, Properties of Saturn kilometric radiation measured within its source region. Geophys. Res. Lett. 37, 12104 (2010)
Article ADS Google Scholar - L. Lamy, B. Cecconi, P. Zarka, P. Canu, P. Schippers, W.S. Kurth, R.L. Mutel, D.A. Gurnett, J.D. Menietti, P. Louarn, Emission and propagation of Saturn kilometric radiation: Magnetoionic modes, beaming pattern, and polarization state. J. Geophys. Res. 116, 04212 (2011)
Article Google Scholar - A. Lecacheux, Direction finding of a radiosource of unknown polarization with short electric antennas on a spacecraft. Astron. Astrophys. 70, 701–706 (1978)
ADS Google Scholar - B. Little, C.D. Anger, A.P. Ingersoll, A.R. Vasavada, D.A. Senske, H.H. Breneman, W.J. Boruki (The Galileo SSI Team), Galileo images of lightning on Jupiter. Icarus 142, 306–323 (1999)
Article ADS Google Scholar - P. Louarn, C.P. Paranicas, W.S. Kurth, Global magnetodisk disturbances and energetic particle injections at Jupiter. J. Geophys. Res. 119, 4495–4511 (2014)
Article Google Scholar - P. Louarn, A. Roux, S. Perraut, W.S. Kurth, D.A. Gurnett, A study of the large-scale dynamics of the Jovian magnetosphere using the Galileo plasma wave experiment. Geophys. Res. Lett. 25, 2905–2908 (1998)
Article ADS Google Scholar - P. Louarn, A. Roux, S. Perraut, W.S. Kurth, D.A. Gurnett, A study of the Jovian “energetic magnetospheric events” observed by Galileo: Role in the radial plasma transport. J. Geophys. Res. 106, 29883–29898 (2000)
Article ADS Google Scholar - P. Louarn, B.H. Mauk, M.G. Kivelson, W.S. Kurth, A. Roux, C. Zimmer, D.A. Gurnett, D.J. Williams, A multi-instrument study of a Jovian magnetospheric disturbance. J. Geophys. Res. 105, 13073–13088 (2001)
Article Google Scholar - R.J. MacDowall, M.L. Kaiser, M.D. Desch, W.M. Farrell, R.A. Hess, R.G. Stone, Quasi-periodic Jovian radio bursts—observations from the Ulysses radio and plasma wave experiment. Planet. Space Sci. 41, 1059–1072 (1993)
Article ADS Google Scholar - H. Matsumoto, H. Kojima, T. Miyatake, Y. Omura, M. Okada, I. Nagano, M. Tsutsui, Electrostatic solitary waves (ESW) in the magnetotail—wave-forms observed by Geotail. Geophys. Res. Lett. 21, 2915–2918 (1994)
Article ADS Google Scholar - B.H. Mauk, D.K. Haggerty, S.E. Jaskulek, C.E. Schlemm, L.E. Brown, S.A. Cooper, R.S. Gurnee, C.M. Hammock, J.R. Hayes, G.C. Ho, J.C. Hutcheson, A.D. Jacques, S. Kerem, C.K. Kim, D.G. Mitchell, K.S. Nelson, C.P. Paranicas, N. Paschalidis, E. Rossano, M.R. Stokes, The Jupiter Energetic Particle Detector Instrument (JEDI) investigation for the Juno mission. Space Sci. Rev. (2013). doi:10.1007/s11214-013-0025-3
Google Scholar - D.J. McComas, N. Alexander, F. Allegrini, F. Bagenal, C. Beebe, G. Clark, F. Crary, A. Desai, A. De Los Santos, D. Demkee, J. Dickinson, D. Everett, T. Finley, A. Gribanova, R. Hill, J. Johnson, C. Kofoed, C. Loeffler, P. Louarn, M. Maple, W. Mills, C. Pollock, M. Reno, B. Rodriquez, J. Rouzaud, D. Santos-Costa, P. Valek, P. Wilson, R.J. Wilson, D. White, The Jovian Auroral Distributions Experiment (JADE) on the Juno mission to Jupiter. Space Sci. Rev. (2013). doi:10.1007/s11214-013-9990-9
Google Scholar - N. Meyer-Vernet, C. Perche, Tool kit for antennae and thermal noise near the plasma frequency. J. Geophys. Res. 94, 2405–2415 (1989)
Article ADS Google Scholar - S.R. Mosier, D.A. Gurnett, Theory of the Injun 5 very-low-frequency Poynting flux measurements. J. Geophys. Res. 76, 972–977 (1971)
Article ADS Google Scholar - L. Pallier, R. Prangé, More about the structure of the high latitude Jovian aurorae. Planet. Space Sci. 49, 1159–11736 (2001)
Article ADS Google Scholar - L. Pallier, R. Prangé, Detection of the southern counterpart of the Jovian northern polar cusp: Shared properties. Geophys. Res. Lett. 31, 06701 (2004)
Article ADS Google Scholar - M. Panchenko, H.O. Rucker, W.M. Farrell, Periodic bursts of Jovian non-Io decametric radio emission. Planet. Space Sci. 77, 3–11 (2013)
Article ADS Google Scholar - J.S. Pickett, I.W. Christopher, D.L. Kirchner, Interpretation of Cluster WBD frequency conversion mode data. Geosci. Instrum. Method. Data Syst. 3, 21–27 (2014)
Article ADS Google Scholar - M.J. Reiner, J. Fainberg, R.G. Stone, M.L. Kaiser, M.D. Desch, R. Manning, P. Zarka, B.-M. Pedersen, Source characteristics of Jovian narrow-band kilometric radio emissions. J. Geophys. Res. 98, 13163–13176 (1993)
Article ADS Google Scholar - A. Roux, A. Hilgers, H. Deferaudy, D. Lequeau, P. Louarn, S. Perraut, M. Bahnsen, A. Jespersen, E. Ungstrup, M. André, Auroral kilometric radiation sources—in-situ and remote observations from Viking. J. Geophys. Res. 98, 11657–11670 (1993)
Article ADS Google Scholar - V.B. Ryabov, P. Zarka, S. Hess, A. Konovalenko, G. Litvinenko, V. Zakharenko, V.A. Shevchenko, B. Cecconi, Fast and slow frequency-drifting millisecond bursts in Jovian decametric radio emissions. Astron. Astrophys. 568, A53 (2014). doi:10.1051/0004-6361/201423927
Article ADS Google Scholar - M. Sampl, T. Oswald, M. Kapper, H.O. Rucker, W. Macher, Calibration of the Juno/Waves antenna system, Tech. Rep. IWF-184 (Space Res. Inst., Austrian Acad. of Sci., Graz, Austria, 2012)
- M. Sampl, W. Macher, T. Oswald, D. Plettemeier, H.O. Rucker, W.S. Kurth, Juno model rheometry and simulation. Radio Sci. 51, 1627–1635 (2016)
Article ADS Google Scholar - J. Sauer, F.M. Neubauer, J.E.P. Connerney, P. Zarka, M.G. Kivelson, Plasma interaction of Io with its plasma torus, in Jupiter: The Planet, Satellites, and Magnetosphere, ed. by F. Bagenal, W. McKinnon, T. Dowling (Cambridge University Press, London, 2004), pp. 537–560
Google Scholar - F.L. Scarf, D.A. Gurnett, A plasma wave investigation for the Voyager mission. Space Sci. Rev. 21, 289 (1977)
Article ADS Google Scholar - F.L. Scarf, D.A. Gurnett, W.S. Kurth, Jupiter plasma wave observations: An initial Voyager 1 overview. Science 204, 991 (1979a)
Article ADS Google Scholar - F.L. Scarf, F.V. Coroniti, D.A. Gurnett, W.S. Kurth, Pitch-angle diffusion by whistler mode waves near the Io plasma torus. Geophys. Res. Lett. 6, 653–656 (1979b)
Article ADS Google Scholar - R.A. Treumann, The electron-cyclotron maser for astrophysical application. Astron. Astrophys. Rev. 13, 229–315 (2006)
Article ADS Google Scholar - J.W. Warwick, J.B. Pearce, A.C. Riddle, J.K. Alexander, M.D. Desch, M.L. Kaiser, J.R. Thieman, T.D. Carr, S. Gulkis, A. Boischot, C.C. Harvey, B.M. Pedersen, Voyager 1 planetary radio astronomy observations near Jupiter. Science 204, 995–998 (1979)
Article ADS Google Scholar - B. Widrow, S.D. Stearns, Adaptive Signal Processing (Prentice Hall, Upper Saddle River, 1985)
MATH Google Scholar - C.S. Wu, Kinetic cyclotron and synchrotron maser instabilities—radio-emission processes by direct amplification of radiation. Space Sci. Rev. 41, 215–298 (1985)
Article ADS Google Scholar - S. Ye, W.S. Kurth, G.B. Hospodarsky, T.F. Averkamp, D.A. Gurnett, Dust detection in space using the monopole and dipole electric field antennas. J. Geophys. Res. 121, 11964–11972 (2016)
Article Google Scholar - P. Zarka, Auroral radio emissions at the outer planets: Observations and theories. J. Geophys. Res. 103, 20159–20194 (1998)
Article ADS Google Scholar - P. Zarka, Radio and plasma waves at the outer planets. Adv. Space Res. 33, 2045–2060 (2004)
Article ADS Google Scholar - P. Zarka, F. Genova, Low frequency jovian emission and solar wind magnetic sector structure. Nature 306, 767–768 (1983)
Article ADS Google Scholar - P. Zarka, B. Cecconi, W.S. Kurth, Jupiter’s low-frequency radio spectrum from Cassini/Radio and Plasma Wave (RPWS) absolute flux density measurements. J. Geophys. Res. 109, A09S15 (2004)
Article ADS Google Scholar - P. Zarka, J. Queinnec, F.J. Crary, Low-frequency limit of Jovian radio emissions and implications on source locations and Io plasma wake. Planet. Space Sci. 49, 1137–1149 (2001)
Article ADS Google Scholar
Acknowledgements
The research at the University of Iowa is supported by NASA through Contract 699041X with the Southwest Research Institute. The Waves instrument was developed with support from NASA through Contract 1280139 through the Jet Propulsion Laboratory.
We would like to thank the many individuals who worked to make this instrument a reality: J. Altmaier, A. Averkamp, J. Barnholdt, D. Beals, T. Beckman, L. Detweiler, R. Dvorsky, J. Faden, P. Finn, H. Flander, M. Fountain, L. Granroth, D. Gurnett, W. Hansen, R. Heninger, C. Henry, A. Hudson, R. Huff, R. Johnson, T. Koch, R. Kramer, K. Kurth, S. Kutcher, J. Ladewig, K. Lloyd, M. Miller, P. Morton, S. Patzner, J. Pawlowski, J. Phillips, R. Phillips, J. Pickett, C. Rasbach, J. Reardanz, S. Remington, M. Thornburg, F. Jaeger, S. Safdar, J. Schroeder, D. Wilkinson, and P. Zach.
Author information
Author notes
- M. Sampl
Present address: KATHREIN-Werke KG, Portfolio & Innovation, Systems, Anton-Kathrein-Str. 1-3, 83004, Rosenheim, Germany
Authors and Affiliations
- Dept. Physics and Astronomy, University of Iowa, Iowa City, IA, USA
W. S. Kurth, G. B. Hospodarsky, D. L. Kirchner, B. T. Mokrzycki, T. F. Averkamp, W. T. Robison & C. W. Piker - Space Research Institute, Austrian Academy of Sciences, Graz, Austria
M. Sampl - LESIA, Observatoire de Paris, Meudon, France
P. Zarka
Authors
- W. S. Kurth
You can also search for this author inPubMed Google Scholar - G. B. Hospodarsky
You can also search for this author inPubMed Google Scholar - D. L. Kirchner
You can also search for this author inPubMed Google Scholar - B. T. Mokrzycki
You can also search for this author inPubMed Google Scholar - T. F. Averkamp
You can also search for this author inPubMed Google Scholar - W. T. Robison
You can also search for this author inPubMed Google Scholar - C. W. Piker
You can also search for this author inPubMed Google Scholar - M. Sampl
You can also search for this author inPubMed Google Scholar - P. Zarka
You can also search for this author inPubMed Google Scholar
Corresponding author
Correspondence toW. S. Kurth.
Rights and permissions
Open Access This article is distributed under the terms of the Creative Commons Attribution 4.0 International License (http://creativecommons.org/licenses/by/4.0/), which permits unrestricted use, distribution, and reproduction in any medium, provided you give appropriate credit to the original author(s) and the source, provide a link to the Creative Commons license, and indicate if changes were made.
About this article
Cite this article
Kurth, W.S., Hospodarsky, G.B., Kirchner, D.L. et al. The Juno Waves Investigation.Space Sci Rev 213, 347–392 (2017). https://doi.org/10.1007/s11214-017-0396-y
- Received: 01 April 2017
- Accepted: 28 June 2017
- Published: 10 July 2017
- Issue Date: November 2017
- DOI: https://doi.org/10.1007/s11214-017-0396-y
