Neurophysiological investigation of the basis of the fMRI signal (original) (raw)
References
- Ogawa, S. & Lee, T. M. Magnetic resonance imaging of blood vessels at high fields: in vivo and in vitro measurements and image simulation. Magn. Reson. Med. 16, 9–18 (1990).
Article CAS PubMed Google Scholar - Bandettini, P. A., Wong, E. C., Hinks, R. S., Tikofsky, R. S. & Hyde, J. S. Time course EPI of human brain function during task activation. Magn. Reson. Med. 25, 390–397 (1992).
Article CAS PubMed Google Scholar - Frahm, J., Bruhn, H., Merboldt, K. D. & Hanicke, W. Dynamic MR imaging of human brain oxygenation during rest and photic stimulation. J. Magn. Reson. Imaging 2, 501–505 (1992).
Article CAS PubMed Google Scholar - Menon, R. S. et al. Functional brain mapping using magnetic resonance imaging. Signal changes accompanying visual stimulation. Invest. Radiol. 27, (Suppl.) 53 (1992).
Article Google Scholar - Kwong, K. K. Dynamic magnetic resonance imaging of human brain activity during primary sensory stimulation. Proc. Natl Acad. Sci. USA 89, 5675–5679 (1992).
Article ADS CAS PubMed PubMed Central Google Scholar - Menon, V., Ford, J. M., Lim, K. O., Glover, G. H. & Pfefferbaum, A. Combined event-related fMRI and EEG evidence for temporal- parietal cortex activation during target detection. NeuroReport 8, 3029–3037 (1997).
Article CAS PubMed Google Scholar - Krakow, K. et al. EEG recording during fMRI experiments: image quality. Hum. Brain Mapp. 10, 10–15 (2000).
Article CAS PubMed PubMed Central Google Scholar - Krakow, K. et al. EEG-triggered functional MRI of interictal epileptiform activity in patients with partial seizures. Brain 122, 1679–1688 (1999).
Article PubMed Google Scholar - Bonmassar, G., Anami, K., Ives, J. & Belliveau, J. W. Visual evoked potential (VEP) measured by simultaneous 64-channel EEG and 3T fMRI. NeuroReport 10, 1893–1897 (1999).
Article CAS PubMed Google Scholar - Hess, A., Stiller, D., Kaulisch, T., Heil, P. & Scheich, H. New insights into the hemodynamic blood oxygenation level-dependent response through combination of functional magnetic resonance imaging and optical recording in gerbil barrel cortex. J. Neurosci. 20, 3328–3338 (2000).
Article CAS PubMed PubMed Central Google Scholar - Bonhoeffer, T. & Grinvald, A. Brain Mapping, The Methods (eds Toga, A. W. & Mazziotta, J. C.) 55–97 (Academic, New York, 1996).
Google Scholar - Schmitt, F., Stehling, M. K. & Turner, R. Echo-Planar Imaging: Theory, Technique and Application (Springer, Berlin, 1998).
Book Google Scholar - Legatt, A. D., Arezzo, J. & Vaughan, H. G. J. Averaged multiple unit activity as an estimate of phasic changes in local neuronal activity: effects of volume-conducted potentials. J. Neurosci. Methods 2, 203–217 (1980).
Article CAS PubMed Google Scholar - Freeman, W. J. Mass Action in the Nervous System (Academic, New York, 1975).
Google Scholar - Mitzdorf, U. Properties of the evoked potential generators: current source-density analysis of visually evoked potentials in the cat cortex. Int. J. Neurosci. 33, 33–59 (1987).
Article CAS PubMed Google Scholar - Juergens, E., Guettler, A. & Eckhorn, R. Visual stimulation elicits locked and induced gamma oscillations in monkey intracortical- and EEG-potentials, but not in human EEG. Exp. Brain Res. 129, 247–259 (1999).
Article CAS PubMed Google Scholar - Eckhorn, R. & Thomas, U. A new method for the insertion of multiple microprobes into neural and muscular tissue, including fiber electrodes, fine wires, needles and microsensors. J. Neurosci. Methods 49, 175–179 (1993).
Article CAS PubMed Google Scholar - Juergens, E., Eckhorn, R., Frien, A. & Woelbern, T. Brain and Evolution 418 (Thieme, Berlin, 1996).
Google Scholar - Hu, X., Le, T. H. & Ugurbil, K. Evaluation of the early response in fMRI in individual subjects using short stimulus duration. Magn. Reson. Med. 37, 877–884 (1997).
Article CAS PubMed Google Scholar - Logothetis, N. K., Guggenberger, H., Peled, S. & Pauls, J. Functional imaging of the monkey brain. Nature Neurosci. 2, 555–562 (1999).
Article CAS PubMed Google Scholar - Malonek, D. & Grinvald, A. Interactions between electrical activity and cortical microcirculation revealed by imaging spectroscopy: implications for functional brain mapping. Science 272, 551–554 (1996).
Article ADS CAS PubMed Google Scholar - Buxton, R. B., Wong, E. C. & Frank, L. R. Dynamics of blood flow and oxygenation changes during brain activation: the balloon model. Magn. Reson. Med. 39, 855–864 (1998).
Article CAS PubMed Google Scholar - Frahm, J., Kruger, G., Merboldt, K. D. & Kleinschmidt, A. Dynamic uncoupling and recoupling of perfusion and oxidative metabolism during focal brain activation in man. Magn. Reson. Med. 35, 143–148 (1996).
Article CAS PubMed Google Scholar - Kruger, G., Kleinschmidt, A. & Frahm, J. Dynamic MRI sensitized to cerebral blood oxygenation and flow during sustained activation of human visual cortex. Magn. Reson. Med. 35, 797–800 (1996).
Article CAS PubMed Google Scholar - Eckhorn, R. et al. Coherent oscillations: a mechanism of feature linking in the visual cortex? Multiple electrode and correlation analyses in the cat. Biol. Cybern. 60, 121–130 (1988).
Article CAS PubMed Google Scholar - Murthy, V. N. & Fetz, E. E. Coherent 25- to 35-Hz oscillations in the sensorimotor cortex of awake behaving monkeys. Proc. Natl Acad. Sci. USA 89, 5670–5674 (1992).
Article ADS CAS PubMed PubMed Central Google Scholar - Gray, C. M. & Singer, W. Stimulus-specific neuronal oscillations in orientation columns of cat visual cortex. Proc. Natl Acad. Sci. USA 86, 1698–1702 (1989).
Article ADS CAS PubMed PubMed Central Google Scholar - Singer, W. Synchronization of cortical activity and its putative role in information processing and learning. Annu. Rev. Physiol. 55, 349–374 (1993).
Article CAS PubMed Google Scholar - Tallon-Baudry, C., Bertrand, O., Wienbruch, C., Ross, B. & Pantev, C. Combined EEG and MEG recordings of visual 40 Hz responses to illusory triangles in human. NeuroReport 8, 1103–1107 (1997).
Article CAS PubMed Google Scholar - Joliot, M., Ribary, U. & Llinas, R. Human oscillatory brain activity near 40 Hz coexists with cognitive temporal binding. Proc. Natl Acad. Sci. USA 91, 11748–11751 (1994).
Article ADS CAS PubMed PubMed Central Google Scholar - Singer, W. Neuronal synchrony: a versatile code for the definition of relations? Neuron 24, 49–65 (1999).
Article CAS PubMed Google Scholar - Shadlen, M. N. & Movshon, J. A. Synchrony unbound: a critical evaluation of the temporal binding hypothesis. Neuron 24, 67–77 (1999).
Article CAS PubMed Google Scholar - Sokoloff, L. in Basic Neurochemistry (eds Siegel, G., Agranoff, B., Albers, R. W. & Molinoff, P.) 565–590 (Raven, New York, 1989).
Google Scholar - Magistretti, P. J., Pellerin, L., Rothman, D. L. & Shulman, R. G. Neuroscience—energy on demand. Science 283, 496–497 (1999).
Article CAS PubMed Google Scholar - Rothman, D. L. et al. In vivo nuclear magnetic resonance spectroscopy studies of the relationship between the glutamate-glutamine neurotransmitter cycle and functional neuroenergetics. Phil. Trans. R. Soc. Lond. B 354, 1165–1177 (1999).
Article CAS Google Scholar - Shulman, R. G. & Rothman, D. L. Interpreting functional imaging studies in terms of neurotransmitter cycling. Proc. Natl Acad. Sci. USA 95, 11993–11998 (1998).
Article ADS CAS PubMed PubMed Central Google Scholar - Takahashi, S., Driscoll, B. F., Law, M. J. & Sokoloff, L. Role of sodium and potassium ions in regulation of glucose metabolism in cultured astroglia. Proc. Natl Acad. Sci. USA 92, 4616–4620 (1995).
Article ADS CAS PubMed PubMed Central Google Scholar - Pellerin, L. & Magistretti, P. J. Glutamate uptake into astrocytes stimulates aerobic glycolysis: a mechanism coupling neuronal activity to glucose utilization. Proc. Natl Acad. Sci. USA 91, 10625–10629 (1994).
Article ADS CAS PubMed PubMed Central Google Scholar - Sibson, N. R. et al. Stoichiometric coupling of brain glucose metabolism and glutamatergic neuronal activity. Proc. Natl Acad. Sci. USA 95, 316–321 (1998).
Article ADS CAS PubMed PubMed Central Google Scholar - Pan, J. W. et al. Spectroscopic imaging of glutamate C4 turnover in human brain. Magn. Reson. Med. 44, 673–679 (2000).
Article CAS PubMed Google Scholar - Rees, G., Friston, K. & Koch, C. A direct quantitative relationship between the functional properties of human and macaque V5. Nature Neurosci. 3, 716–723 (2000).
Article CAS PubMed Google Scholar - Carandini, M., Heeger, D. J. & Movshon, J. A. Linearity and normalization in simple cells of the macaque primary visual cortex. J. Neurosci. 17, 8621–8644 (1997).
Article CAS PubMed PubMed Central Google Scholar - Sclar, G., Maunsell, J. H. R. & Lennie, P. Coding of image contrast in central visual pathways of the macaque monkey. Vision Res. 30, 1–11 (1990).
Article CAS PubMed Google Scholar - Boynton, G. M., Demb, J. B., Glover, G. H. & Heeger, D. J. Neuronal basis of contrast discrimination. Vision Res. 39, 257–269 (1999).
Article CAS PubMed Google Scholar - Boynton, G. M., Engel, S. A., Glover, G. H. & Heeger, D. J. Linear systems analysis of functional magnetic resonance imaging in human V1. J. Neurosci. 16, 4207–4221 (1996).
Article CAS PubMed PubMed Central Google Scholar - Rainer, G., Augath, M., Trinath, T. & Logothetis, N. K. Nonmonotonic noise tuning of BOLD fMRI signal to natural images in the visual cortex of the anesthetized monkey. Curr. Biol. 11, 846–854 (2001).
Article CAS PubMed Google Scholar - Ugurbil, K. et al. Imaging at high magnetic fields: initial experiences at 4 T. Magn. Reson. Quart. 9, 259–277 (1993).
CAS Google Scholar - Haase, A., Frahm, J., Matthaei, D., Hanicke, W. & Merboldt, K.-D. FLASH imaging. Rapid NMR imaging using low flip-angle pulses. J. Magn. Reson. 67, 258–266 (1986).
ADS CAS Google Scholar - Mansfield, P. Multi-planar image formation using NMR spin echoes. J. Phys. C 10 L55–L58 (1977).
Article ADS CAS Google Scholar - Gruetter, R. Automatic, localized in vivo adjustment of all first- and second-order shim coils. Magn. Reson. Med. 29, 804–811 (1993).
Article CAS PubMed Google Scholar
Acknowledgements
We thank D. Leopold, G. Rainer and N. Sigala for reading the manuscript and for many useful suggestions. We also thank H. Mandelkow for writing some of the Matlab code; K. Lamberty for the drawings; D. Blaurock for English corrections and editing; and S. Weber for fine-mechanic work. This research was supported by the Max Planck Society.
Author information
Authors and Affiliations
- Max Planck Institute for Biological Cybernetics, Spemannstrasse 38, Tuebingen, 72076, Germany
Nikos K. Logothetis, Jon Pauls, Mark Augath, Torsten Trinath & Axel Oeltermann
Authors
- Nikos K. Logothetis
You can also search for this author inPubMed Google Scholar - Jon Pauls
You can also search for this author inPubMed Google Scholar - Mark Augath
You can also search for this author inPubMed Google Scholar - Torsten Trinath
You can also search for this author inPubMed Google Scholar - Axel Oeltermann
You can also search for this author inPubMed Google Scholar
Corresponding author
Correspondence toNikos K. Logothetis.
Supplementary information
Controls
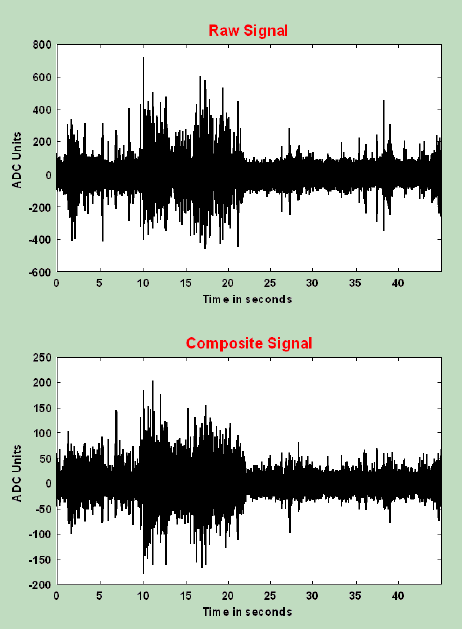
Area Normalization: The stronger contribution of LFPs to the BOLD signal could, in principle, be the result of differences in spatial summation, as LFPs usually integrate signals from a couple of millimeters, while MUA does so only for a few hundreds of micrometers. To test whether such an explanation is plausible, we repeated the same experiments outside the magnet, with exactly the same stimulation and anesthesia conditions, but with a 16-electrode multiunit recording system1. Specifically, intracortical recordings were carried out with a 4x4 array of microfiber electrodes (quartz-Pt90W10; 80 lm shaft diameter, 250 lm center-to-center spacing, 250kOhm – 750kOhm impedance, at 500Hz). MUAs of distant electrodes were added using a weighting factor that decreases with the same rate as the LFPs decrease with distance from electrode2.
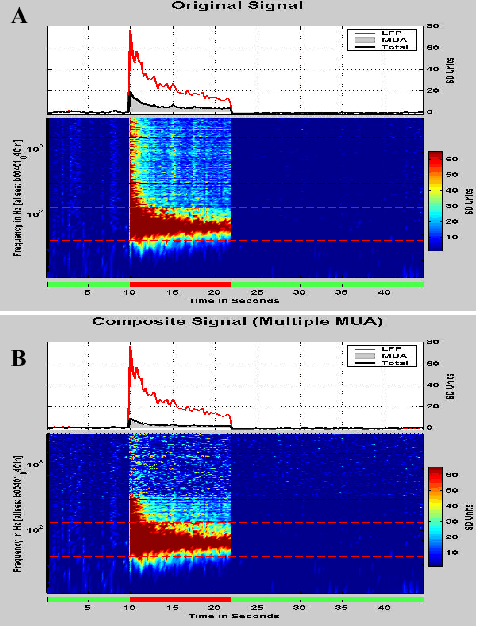
We (arbitrarily) assumed that MUA is collected from an area of 200x200 lm2, and that LFPs are collected from an area of 2000x2000 lm2, (considering two dimensions only and ignoring changes in the radial direction), which means that about 100 MUA signals (multiple recordings from each electrode) must be "summed" to account for the spatial summation assumed for the LFPs. Since we had only 9 reliably modulated recording sites (out of 16 electrodes), we summed 12 trials from each electrode (108 MUA signals). LFPs and MUA were separated as described in the Methods section. Supplementary Figure 1A shows the original, and 1B the "composite" signal. Figure 2A shows the spectrogram of the original and 2B of the composite signal. As can be seen in the figure, the contribution of MUA with the BOLD signal may even decrease when it is summed in this way. This is presumably due to the lack of significant synchronization in this frequency band. Summing the signals a single trial (9 signals) only slightly increased the transient portion of the MUA, but it never increased the sustained part of the response that is clearly seen in the LFP band.
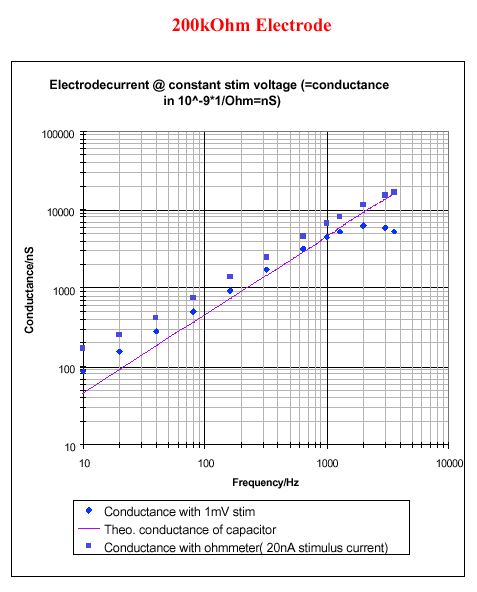
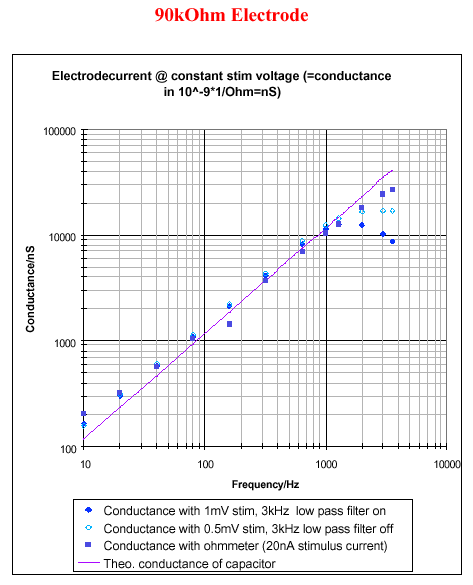
Transfer Function: To ensure that lower frequencies were not preferentially amplified due to conductance differences at different frequencies, we carefully measured the frequency response of the recording assembly including electrodes, amplifiers and filters. Measurements could be done on and off line, with a system developed in our laboratory (N.K.L., A.O. and M.A., in preparation). Measurements were done as follows: A 1mV zero-to-peak sinusoidal voltage, meant to simulate the neuronal signal, was applied between a region around the electrode tip and a far-located reference by using a simple system, consisting of a wave generator and a voltage divider. The current flowing through the electrode tip was measured indirectly by measuring the output of the amplifier (volts) at various frequencies from 10Hz to 3.56kHz. This amplifier was the same as that used for recordings. By dividing the measured current (zero-to-peak) by the applied 1mV voltage, we computed the conductance (inversely related to the system’s impedance) of the system for any given frequency.
Figures 3 and 4 show the results. On the y-axis of the diagram we plotted the system conductance – reflecting the system output spectrum for a flat spectrum of the neural signal - and on the x-axis we plotted the frequency. The squares show measurements made with our homemade on-line impedance meter; namely the one used for measuring the impedance of the recording site in the brain. Diamonds show the conductance measured by applying the 1mV stimulus in a saline bath. The increasing deviation of measurements with frequency is due to the 3kHz low-pass filter or other imperfections of the first stage of the recording amplifier. Finally, the continuous line shows the theoretical values of total conductance when a capacitance is assumed that normalizes the line, so that it passes through the measured value at 1kHz.
As it can be seen in these figures, the recording system response is such that the gain at each frequency actually increases monotonically as the frequency increases. That is, the transformation of the system linear transfer function into a constant function, would attenuate MUAs even more with respect to the LFP signals.
Methods
Surgery: A skull-form-specific, custom-made PEEK (Polyetheretherketone; TecaPEEK, Ensinger, Inc., Nufringen, Germany) head-holder was implanted stereotaxically on the cranium of each animal under general anesthesia (balanced anesthesia consisting of isoflurane 1.3% and fentanyl 3lm/kg I.V. injections, with 1.8L/min N2O and 0.8L/min O2) using aseptic techniques. The implant was secured with custom-made ceramic screws (zirconium oxide Y2O3-TPZ 5x1, Pfannenstiel, Germany). During the experiment, the animal’s head was held by a custom-made restraining device. The Frankfurt zero-plane, including the interaural line and the infraorbital ridge (depicted by saline-filled bar-markers), was at an angle 20 degrees off the horizontal plane, and all transverse NMR slices were selected parallel to this plane.
Anesthesia during the Experiment: After premedication with glycopyrolate (I.M. 0.01mg/kg) and ketamine (I.M. 15 mg/kg), a 20-gauge intravenous catheter was introduced into the saphenous vein, and the monitors (HP OmniCare/CMS; ECG, NIBP, CO2, SpO2, temperature) were connected. The monkeys were preoxygenated and anesthesia was induced with fentanyl (3lg/kg), thiopental (5mg/kg), and succinylcholine chloride (3mg/kg). Following the intubation of the trachea, the lungs were ventilated using a Servo Ventilator 900 C (Siemens, Germany), maintaining an end-tidal CO2 of 33mmHg and oxygen saturation over 95%. Balanced anesthesia was maintained with end-tidal 0.35% (0.23 MAC for macaques) isoflurane in air and fentanyl (3lg/kg/hr). Muscle relaxation was achieved with mivacurium (5mg/kg/h). Body temperature was kept constant, and lactated Ringer’s solution was given at a rate of 10ml/kg/h. Intravascular volume was maintained by administering colloids (hydroxyethyl starch, 30-50ml over 1-2 minutes as needed). Emergence from anesthesia was typically without complications and lasted an average of 30 minutes. The paralytic and fentanyl were stopped, and ventilation was reduced to stimulate spontaneous breathing. When spontaneous respiration was assured and the CO2 was below 40mmHg the trachea was extubated. During the entire experiment, depth of anesthesia was controlled by continuously monitoring the vital signs of the monkey and responding accordingly.
Optical Corrections: Following the restraint of the animal, two drops of 1% ophthalmic solution of the anticholinergic cyclopentolate hydrochloride were instilled into each eye to achieve cycloplegia and mydriasis. Refractive errors were measured after the induction of paralysis, approximately one hour after the application of cyclopentolate. Subsequently contact lenses (hard PMMA lenses, Firma Wöhlk, Kiel) with the appropriate dioptric power were used to bring the animal’s eye to a focus on the plane at which the stimuli were to be presented. The eyes of the monkeys were kept open with custom-made irrigating lid specula to prevent any drying of the tissues. The specula were constructed so as to irrigate the eye at the medial and lateral canthus, with a saline infusion at a rate of 0.05ml/min.
Generation and Positioning of the Visual Stimulus: The visual stimulator was a dual processor Pentium II workstation running Windows NT (Intergraph Corp., Huntsville, Alabama) and equipped with two VX113 graphics subsystems. The screen resolution of each subsystem was reduced to 640 by 480 pixels and the frame rate to 60Hz. All image generation was in 24 bit true color, using hardware double buffering to provide smooth animation. The stimulation software was written in C and utilized Microsoft's OpenGL 1.1 implementation with the client driver specific for Intergraph hardware. The two 640x480 VGA outputs were used to drive the left- and right-eye liquid crystal displays (LCD) of a fiber-optic system (Avotec, Silent Vision, Florida). Each LCD had a resolution of 832Hx624V and a field of view (FOV) of 30Hx23V degrees of visual angle focused at 2 diopters. The effective resolution was determined by the fiber-optic projection system and was 530Hx400V fibers. Binocular presentations were created using two independently positioned plastic, fiber-optic glasses. Positioning was aided by a modified fundus camera (Zeiss RC250) that permitted the simultaneous observation of the eye fundus and a 30Hx23V degree calibration frame. This process ensured the alignment of the stimulus center with the fovea of each eye.
Timing Control: The timing of stimulus presentation and of the acquisition of images was controlled by a local network of three industrial PCs, each with one Pentium CPU (Advantec, Inc.) running the QNX real-time operating system (QNX Software Systems Ltd., Canada) and our own software for experiment control and data acquisition. A pulse sent by the anesthesia machine triggered a sequence of 32 dummy scans used to avoid magnetization transients. Immediately after the last dummy scan each excitation was preceded by a pulse-signal that was acquired and stored by the state-system program running on the QNX computer. The latter controlled the presentation of the stimuli, the acquisition of physiological signals such as respiration flow, inhaled and exhaled airway pressure and plethysmogramm, the gradient currents, and the neurophysiological signals.
Reference List
- Eckhorn, R. & Thomas, U. A new method for the insertion of multiple microprobes into neural and muscular tissue, including fiber electrodes, fine wires, needles and microsensors. Journal of Neuroscience Methods 49, 175-179 (1993).
- Juergens, E., Eckhorn, R., Frien, A. & Woelbern, T. Brain and Evolution., pp. 418 (Thieme, Berlin, New York,1996).
Figures
Rights and permissions
About this article
Cite this article
Logothetis, N., Pauls, J., Augath, M. et al. Neurophysiological investigation of the basis of the fMRI signal.Nature 412, 150–157 (2001). https://doi.org/10.1038/35084005
- Received: 21 May 2001
- Accepted: 19 June 2001
- Issue Date: 12 July 2001
- DOI: https://doi.org/10.1038/35084005