Translocations at 8q24 juxtapose MYC with genes that harbor superenhancers resulting in overexpression and poor prognosis in myeloma patients (original) (raw)
Abstract
Secondary MYC translocations in myeloma have been shown to be important in the pathogenesis and progression of disease. Here, we have used a DNA capture and massively parallel sequencing approach to identify the partner chromosomes in 104 presentation myeloma samples. 8q24 breakpoints were identified in 21 (20%) samples with partner loci including IGH, IGK and IGL, which juxtapose the immunoglobulin (Ig) enhancers next to MYC in 8/23 samples. The remaining samples had partner loci including XBP1, FAM46C, CCND1 and KRAS, which are important in B-cell maturation or myeloma pathogenesis. Analysis of the region surrounding the breakpoints indicated the presence of superenhancers on the partner chromosomes and gene expression analysis showed increased expression of MYC in these samples. Patients with MYC translocations had a decreased progression-free and overall survival. We postulate that translocation breakpoints near MYC result in colocalization of the gene with superenhancers from loci, which are important in the development of the cell type in which they occur. In the case of myeloma these are the Ig loci and those important for plasma cell development and myeloma pathogenesis, resulting in increased expression of MYC and an aggressive disease phenotype.
Introduction
Rearrangements at 8q24 have been reported in up to 47% of myeloma patients by a combination of fluorescence in situ hybridization (FISH), spectral karyotyping and classical cytogenetics.1 In presenting myeloma this frequency is lower, with abnormalities of 8q reported in 15% of cases using mapping arrays and FISH.2, 3 The gene of interest in this region is MYC, an oncogene that has a pivotal role in cell growth, proliferation, tumorigenesis and stem cells.4
The importance of MYC activation in myeloma has been shown through the use of the Vk*MYC transgenic mouse model, where activation of MYC arises through AID-dependent somatic hypermutation during B-cell development, resulting in the onset of myeloma in these mice.5 MYC has also been shown to be activated in the transition from monoclonal gammopathy of undetermined significance to myeloma, implicating it in disease progression.6 Myeloma cells have been shown to have a dependency on MYC for survival, where inhibition of MYC by small hairpin RNA or small-molecule inhibitors results in cell death indicating that MYC is a promising therapeutic target.7
The mechanism of MYC activation is mainly through secondary translocations involving the immunoglobulin (Ig) loci (_IGH_>_IGL_>IGK), which juxtapose the strong B-cell enhancers present at these loci and MYC, resulting in overexpression of the oncogene.8 Unlike primary translocations in myeloma, which are often simple reciprocal exchanges of chromosomal material, the rearrangements that result from MYC translocations are often complex, involving many partner chromosomes.1, 8 Interestingly, it has been reported that up to 74% of MYC rearrangements do not involve an Ig locus3 leading to the conclusion that other mechanisms of activation may also be important in myeloma. Using FISH, partner chromosomes at 1p13, 1p21–22, 6p21, 6q12–15, 13q14 and 16q22 have been identified, but the specific loci involved have remained elusive.3, 9, 10, 11
The breakpoints on 8q24 have been mapped in a large number of myeloma cell lines and the majority are found within 1 Mb of MYC, but some can be greater than 3 Mb either telomeric or centromeric of the locus.8, 12, 13 The loci surrounding MYC are POU5F1B (centromeric) and PVT1 (telomeric). PVT1 is a non-coding RNA that has been shown to be the location of variant t(8;22) breakpoints in Burkitt’s lymphoma,14 as well as generating fusion genes with WWOX and NBEA in myeloma patients with an 8q24 rearrangement.13
Here, we have used targeted capture followed by massively parallel sequencing to pull down the region surrounding MYC in a series of presenting myeloma cases in order to identify any translocations in this area and the mechanism of action involved.
Materials and methods
Cell selection
CD138-positive bone marrow plasma cells were selected to a purity >95% using magnetic assisted cell sorting (Miltenyi Biotech, Bisley, UK). Tumor DNA and RNA were extracted using the AllPrep kit (Qiagen, Manchester, UK). All patients were at presentation and had not received any treatment when the sample was taken.
FISH
Probes have been previously published with the addition of the LPL (8p22), CEP 8 and MYC (8q24.1-24.21) probes (Abbott, Maidenhead, UK).15, 16, 17 MYC abnormalities were defined using the t(8;14) fusion probe, LPL/CEP 8/MYC probes, IGH@ translocations (IGH@ break-apart probe followed by fusion probes for the common partner chromosomes). FISH results were interpreted alongside karyotype data, where available.
Targeted capture of the MYC locus
A targeted capture system was designed using the SureSelect system (Agilent, Santa Clara, CA, USA) that was based on tiling RNA baits across the MYC, IGH, IGK and IGL loci as previously described.18 The region captured surrounding MYC spanned from 127.5–129.8 Mb on chromosome 8, roughly 1 Mb on either side of MYC, which is located at 128.75 Mb. This region includes POU5F1B and PVT1, which are common sites of 8q24 translocations in myeloma.
DNA from 104 samples were assayed using 150 ng of DNA and a modified capture protocol with eight cycles of prehybridization PCR and 11 cycles of posthybridization PCR. Samples were barcoded using Illumina (San Diego, CA, USA) indexes and up to 27 samples were sequenced per lane on a HiSeq2000 generating 76-bp paired-end reads. After base calling and quality control metrics, the raw fastq reads were aligned to the reference human genome (build GRCh37) resulting in a median depth of 289 × per sample after de-duplication for the captured region.
Translocation breakpoints were identified in the sequencing data using DELLY.19 Breakpoints called using the bioinformatic approach were further filtered based on depth, unique mappability for 76 bp reads, number of supporting reads and whether or not they were detected in non-tumor samples. The coordinates of the breakpoints and superenhancers were compared with randomized data produced using Monte Carlo sampling using the Genomic Hyper Browser.20
Statistical analyses were performed using SPSS version 19.0 (SPSS Inc., Chicago, IL, USA). Discrete data were expressed as frequencies and percentages and were assessed by Fisher’s exact test or the _χ_2-test, as appropriate. Survival curves were plotted using the Kaplan–Meier method. Differences between curves were tested for statistical significance using the log-rank test. A multivariate Cox regression analysis was done to identify factors significantly associated with progression-free survival (PFS) and overall survival (OS), with statistical significance set at P<0.05.
Results
MYC rearrangements detected by FISH
MYC rearrangements were tested for using interphase FISH on CD138+ selected plasma cells on patient samples from the UK MRC Myeloma IX trial using a combination of probes for MYC (8q24), LPL (8p22) and CEP 8. Interphase FISH was successful on 751 patients and was interpreted with data from FISH probes for the IGH locus and karyotyping. Table 1 shows the frequency of MYC abnormalities, split by translocation group in these samples. MYC abnormalities were detected in 26% of samples with the most frequent abnormality being gain of the locus, followed by a split probe signal. In 50% (32/63) of those with a split probe signal the IGH/K/L locus was identified as the partner. Of the 32 samples with an Ig partner 28 were with the IGH locus. In the remaining 50% the partner remained undetermined, but may involve the light chain loci in samples where cytogenetics or karyotyping was unsuccessful or uninformative. MYC rearrangements were not associated with any particular primary translocation, but were associated with ISS II (_P_=0.022) or ISS III (_P_=0.0027). There was no negative impact on PFS or OS in patients with a MYC abnormality.
Table 1 Frequency of 8q24 abnormalities detected by FISH
MYC rearrangements detected by sequence capture
The presence of unidentified MYC partner chromosomes led us to investigate possible partner chromosomes using an alternative technique. We had previously used a DNA capture technique followed by massively parallel sequencing to identify the translocation partner chromosomes to the IGH/K/L loci.18 In this assay we had also captured a region surrounding MYC and set out to identify potential partner chromosomes. A region of ∼2 Mb was tiled around the MYC locus using RNA baits and used to capture DNA and associated translocations in this region.
We assayed 104 presentation myeloma samples for the presence of MYC translocations using the capture assay followed by massively parallel sequencing. The samples consisted of 55 samples from the Myeloma IX trial and an additional 49 samples from the UK Myeloma XI trial, for which FISH results are not available. The samples were categorized according to IGH translocation using a combination of FISH,15, 21 gene expression22 and targeted capture of the IGH locus18 and consisted of a variety of samples with IGH translocations and 8q24 rearrangements as shown in Table 2; Supplementary Table 1. Only three samples analyzed by the capture technique had a split MYC locus, as determined by FISH or karyotyping. In these samples the translocation was detected using the capture and was found to be the IGH locus in one sample (673; verifying the FISH result) and in the other two samples (29 and 1310) was found to be chromosome 6 (also seen by karyotyping in one sample).
Table 2 Incidence of 8q24 breakpoints in sequence-capture samples
Breakpoints were identified and mapped in 21 samples and are shown in Figure 1. We identified breakpoints in 10 samples where either FISH or karyotyping failed to identify a translocation, as well as three samples where FISH did identify a translocation and also eight samples for which no FISH data were available. Interestingly, there was an enrichment for t(14;16) and a depletion of t(4;14) and hyperdiploidy associated with an 8q24 breakpoint, Table 2, which was not seen with FISH alone.
Figure 1
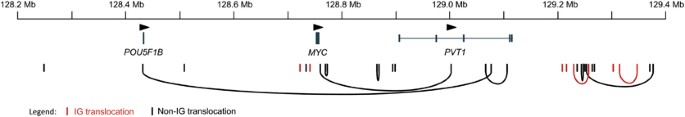
MYC locus breakpoints in myeloma. The locations of breakpoints are indicated by vertical lines corresponding in color to whether the partner chromosome belongs to an Ig loci (IGH@, IGK@ or IGL@; red) or a non-Ig locus (black). The genes and orientation are indicated according to their genomic location on chromosome 8. Arcs indicate the positions of two breakpoints found in one sample.
The positions of the breakpoints on 8q24 were spread out over 1.2 Mb. The majority of the breaks were situated telomeric of PVT1 (51.5%) with 12% within PVT1, 15% between MYC and PVT1 and 15% between POU5F1B and MYC. Of the three samples with breakpoints within PVT1 two were found to have potential fusion genes, one with FOXO3 and the other with LINC00309.
Nine samples had two breakpoints on 8q24, often with two different chromosome partners. In samples with two breakpoints, the sequencing reads indicate that MYC is only involved in one of the breakpoints (that is, only one side of the translocation was captured). The reason for this is not clear and will require long reads to clarify the final genomic rearrangements. Several samples had complex rearrangements resulting in multiple chromosomal segments being joined together, often involving MYC, an Ig enhancer and the primary Ig partner oncogene (for example, sample 11/625 that has a t(6;14) and a t(6;8) or sample 12/0404 that has a t(11;14) and a t(8;11)). Details of breakpoints are shown in Table 3. It is possible that the Ig enhancer is influencing both the target oncogene of the primary translocation (for example, CCND1 or CCND3) and MYC through the assembly of a complex t(8;11;14) or t(6;8;14) derivative chromosome.
Table 3 Genomic locations of MYC breakpoints
Table 4a Clinical characteristics of MYC-translocated samples
Table 4b Multivariate analysis of variables significantly associated with an improved PFS
Table 4c Multivariate analysis of variables significantly associated with an improved OS
Superenhancer colocalization with MYC
A total of 8/21 samples (38%) with MYC abnormalities had rearrangements with an Ig locus on the partner chromosome. Ig partner loci are recognized to upregulate expression of the target oncogene and have been shown to have clinical relevance as prognostic markers. Given that the mechanism of upregulation of Ig loci partner oncogenes is through colocalization of active enhancer elements with the oncogene, we examined the remaining samples with rearrangements for the presence of enhancer elements. We used data from two papers in which binding sites of BRD4 and MED1, which occur at transcriptionally active sites, enhancers and superenhancers in MM1.s cells had been annotated using only enhancer sites on the assembled derivative chromosome.23, 24 As expected, the Ig loci breakpoints were typically close to or within an enhancer/superenhancer (minimum distance=0, maximum distance=26 kb) with the exception of IGKC breakpoints, which were ∼292 kb from the nearest superenhancer (Table 3). This discrepancy is likely owing to MM1.s cells being a lambda light chain expresser that do not express a kappa light chain. If a cell line expressing a kappa light chain had been used in the analysis an enhancer may have been detected much closer.
In order to determine whether there was an enrichment of superenhancer sites in the vicinity of MYC breakpoints, we used the genomic locations of superenhancers from a variety of the cell types determined in Hnisz et al.23 There was a statistically significant enrichment for breakpoints within 1 Mb of a superenhancer in the MM1.s myeloma cell line and in CD19+ B cells (_P_=0.0049 and 0.041, respectively). No enrichment was seen with enhancer locations in K562 cells, CD3+ T cells or skeletal muscle myoblasts indicating a cell-specific enrichment for superenhancers in the B-cell lineage.
The partner loci to MYC are also mostly related to myeloma pathogenesis or B-cell biology (Table 3). In addition to the Ig loci, partner genes of MYC rearrangements included FAM46C, KRAS and CCND1. All of these genes are candidates in many genetic studies of myeloma. FAM46C is deleted in ∼20% of samples and mutated in ∼3% of samples.2, 25 KRAS is mutated in 31% of samples and CCND1 is overexpressed in t(11;14) accounting for ∼15% of samples.26, 27 In addition, XBP1 is involved in plasma cell differentiation, the unfolded protein response and is mutated in a low percentage of relapsed refractory myeloma.26, 28 The genes located next to breakpoints in the remaining samples may also be active in B-cell biology or myeloma pathogenesis as recurrent translocations are found near the CHST15 locus, which is known to be involved in B-cell signaling,29, 30 and FOXO3, which is involved in B-cell development.31 Some rearrangements from these samples are shown in Figure 2 to illustrate the colocalization of superenhancers to MYC.
Figure 2
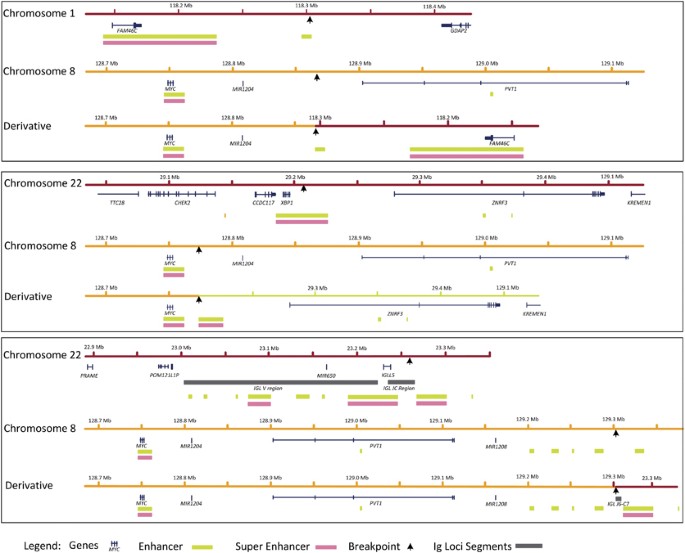
MYC rearrangements result in superenhancer colocalization on the derivative chromosome. Superenhancer elements are colocated near to MYC from a t(1;8) (top) or a t(8;22) (middle and bottom) where the partner chromosome gene (FAM46C, XBP1 and IGL, respectively) has a known function in myeloma or B-cell biology.
Impact on MYC expression
Previously published gene expression array data were available on 33 of the samples (Supplementary Table 2).2 We categorized the samples according to the presence (_n_=9) or absence (_n_=24) of a MYC translocation, as detected by the capture assay, and used the MYC probe set (202431_s_at) to examine any difference in expression between the groups. Those samples with any MYC translocation had higher expression of MYC compared with those without a translocation (median 703.2 vs 2313), but this did not reach significance with this number of samples (_P_=0.065) Figure 3a. This was extended in the full Myeloma IX data set for which any translocation was detected by FISH or capture and for which expression array data were available. In this larger data set, samples with any translocation (_n_=27) had a significantly higher expression of MYC (2003 vs 945.8, _P_=0.009) compared with those with no translocation (_n_=142), even allowing for those samples on which no capture had been performed (and may contain translocations not detected by FISH) (Figure 3b). The increase in expression of MYC is consistent with its deregulation being the central mechanism.
Figure 3
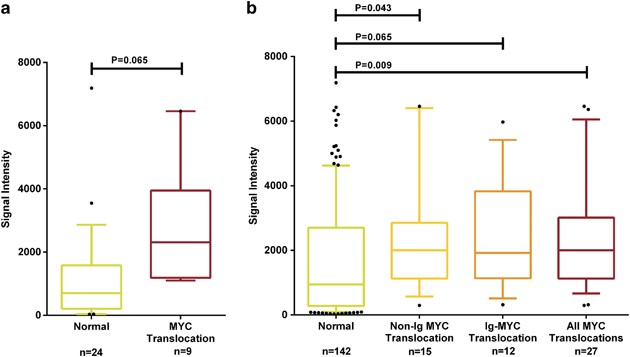
Expression of MYC in samples with a breakpoint is higher than in those without a breakpoint. (a) Expression data from 33 samples with sequence capture-determined translocations for those samples with no breakpoint at 8q24 (normal) and for those with an identified breakpoint (split MYC). (b) Expression data from 169 samples with any translocation detected by capture or FISH. Whisker plots show the 10–90 percentiles.
Impact on clinical outcome
A subset of patients (_n_=55) from the capture panel had taken part in the UK MRC Myeloma IX trial, so we performed an analysis of the impact of MYC translocations on survival. MYC translocations had a significant impact on OS and PFS in univariate analysis (Table 3), which carried over into multivariate analysis, resulting in a significant decrease in OS and PFS for patients with a MYC translocation (Figure 4).
Figure 4
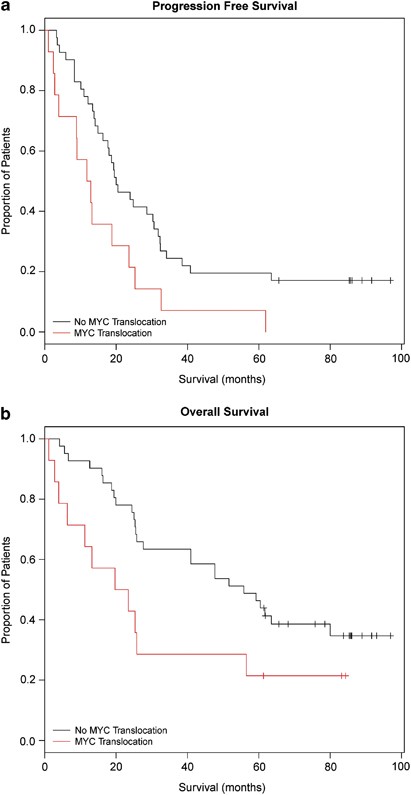
Progression-free survival (a) and Overall-free survival (b) in patients with a MYC breakpoint is significantly decreased compared with those without a breakpoint. PFS _P_=0.032, OS _P_=0.035. Data adjusted for confounding variables in Tables 4a, 4b and 4c.
Discussion
Here, we have investigated the partner loci involved in rearrangements with 8q24, namely MYC. We analyzed presenting cases of myeloma characterized by a range of different primary IGH translocation events and found evidence of a MYC translocation in 21% of samples, making it the most frequent translocation in presenting myeloma cases.
Although FISH analysis of 8q24 rearrangements found no significant association with primary translocation groups, we did find an enrichment for samples with a MYC breakpoint in samples that had a t(14;16) and a depletion of samples with a t(4;14) or hyperdiploidy when screened by the sequence capture technique. Other studies using FISH agree with our FISH-based results in that it has been reported that rearrangements at the MYC locus show a similar prevalence in hyperdiploid and non-hyperdiploid tumors1 or show some trend to being associated with t(4;14).3 The discrepancy between our capture results and those determined by FISH may lie in the technique used to study the abnormality. One study used both FISH and mapping arrays to examine MYC breakpoints and found that 33% of breakpoints detected by array were not detected by routine FISH analysis.17 Therefore, a higher resolution assay, such as genome sequencing, may identify more breakpoints and explain some of the discrepant results. However, care must be taken regarding the frequency of sequence capture translocations within the primary translocation groups owing to the bias in sample selection and the relatively small number of samples studied.
It is notable that all groups find MYC rearrangements to be complex, often involving many chromosomes. We only capture the region surrounding MYC and are not able to detect any rearrangements downstream on the partner chromosome, which could result in inversions, insertions or duplications of DNA segments. Whole-genome sequencing of samples will provide more complex and detailed information regarding the final composition of the genome in these samples.
The translocations at 8q24 results in overexpression of MYC due to the colocalization of active superenhancers in the partner loci. The obvious examples of this belong to the known active enhancers in the B-cell lineage, the Ig loci, but in addition to these a series of previously unknown partners have also been identified. A similar study in B-cell lymphomas identified non-immunoglobulin partners to MYC rearrangements and concluded that these are non-random processes that juxtapose MYC with genes involved in lymphomagenesis (namely BCL6, PAX5 and IKAROS).32 We have identified a different set of genes in this study and interestingly these genes are related to B-cell biology and myeloma pathogenesis. We hypothesize that in different diseases with MYC rearrangements there is a selection process, which results in active superenhancers from genes that are expressed in that cell type being placed near MYC. In all B-cell neoplasias these include the Ig loci, but in different B-cell subtypes the non-Ig loci differ to include those that are expressed in that cell type. In myeloma these non-Ig partner genes include FAM46C, KRAS, XBP1 and CCND1. The other partner genes identified here, which have no known function in myeloma or plasma cells, are likely also to be important in plasma cell development or myeloma disease as they have active superenhancers that are sequestered by MYC.
Some of the loci identified have active superenhancers up to 22 Mb away from the breakpoint. These distal superenhancers may be responsible for MYC overexpression, but as these results are based solely on data from the MM1.s cell line24 it may be that in different myeloma cell types an enhancer closer to the breakpoint is active, and it is this as yet unidentified superenhancer that is located near MYC in this patient. This argument is exemplified by the lack of a superenhancer at the IGK locus in MM1.s and can be explained as this cell line expresses the lambda light chain and not the kappa light chain.33 Similar studies involving a large cohort of myeloma cell lines would give further insight into the complex nature of superenhancers in this disease.
As the mechanism of action for MYC overexpression is through the juxtaposition of superenhancers specific to each disease, it is possible that this unifying mechanism can be therapeutically targeted. Given that it has been shown that superenhancers can be disrupted using BET-bromodomain inhibitors, such as JQ1,24 it makes patients with MYC rearrangements good candidates for treatment with this class of drugs. We show here that patients identified with a MYC translocation have a poor PFS and OS compared with those with no rearrangement. If these patients could be identified in advance they may benefit from treatment with this class of targeted drugs.
References
- Gabrea A, Martelli ML, Qi Y, Roschke A, Barlogie B, Shaughnessy JD Jr. et al. Secondary genomic rearrangements involving immunoglobulin or MYC loci show similar prevalences in hyperdiploid and nonhyperdiploid myeloma tumors. Genes Chromosomes Cancer 2008; 47: 573–590.
Article CAS Google Scholar - Walker BA, Leone PE, Chiecchio L, Dickens NJ, Jenner MW, Boyd KD et al. A compendium of myeloma-associated chromosomal copy number abnormalities and their prognostic value. Blood 2010; 116: e56–e65.
Article CAS Google Scholar - Avet-Loiseau H, Gerson F, Magrangeas F, Minvielle S, Harousseau JL, Bataille R et al. Rearrangements of the c-myc oncogene are present in 15% of primary human multiple myeloma tumors. Blood 2001; 98: 3082–3086.
Article CAS Google Scholar - Dang CV . MYC on the path to cancer. Cell 2012; 149: 22–35.
Article CAS Google Scholar - Chesi M, Robbiani DF, Sebag M, Chng WJ, Affer M, Tiedemann R et al. AID-dependent activation of a MYC transgene induces multiple myeloma in a conditional mouse model of post-germinal center malignancies. Cancer Cell 2008; 13: 167–180.
Article CAS Google Scholar - Chng WJ, Huang GF, Chung TH, Ng SB, Gonzalez-Paz N, Troska-Price T et al. Clinical and biological implications of MYC activation: a common difference between MGUS and newly diagnosed multiple myeloma. Leukemia 2011; 25: 1026–1035.
Article CAS Google Scholar - Holien T, Vatsveen TK, Hella H, Waage A, Sundan A . Addiction to c-MYC in multiple myeloma. Blood 2012; 120: 2450–2453.
Article CAS Google Scholar - Dib A, Gabrea A, Glebov OK, Bergsagel PL, Kuehl WM . Characterization of MYC translocations in multiple myeloma cell lines. J Natl Cancer Inst Monogr 2008; 39: 25–31.
Article CAS Google Scholar - Sawyer JR, Lukacs JL, Thomas EL, Swanson CM, Goosen LS, Sammartino G et al. Multicolour spectral karyotyping identifies new translocations and a recurring pathway for chromosome loss in multiple myeloma. Br J Haematol 2001; 112: 167–174.
Article CAS Google Scholar - Avet-Loiseau H, Daviet A, Brigaudeau C, Callet-Bauchu E, Terre C, Lafage-Pochitaloff M et al. Cytogenetic, interphase, and multicolor fluorescence in situ hybridization analyses in primary plasma cell leukemia: a study of 40 patients at diagnosis, on behalf of the Intergroupe Francophone du Myelome and the Groupe Francais de Cytogenetique Hematologique. Blood 2001; 97: 822–825.
Article CAS Google Scholar - Mohamed AN, Bentley G, Bonnett ML, Zonder J, Al-Katib A . Chromosome aberrations in a series of 120 multiple myeloma cases with abnormal karyotypes. Am J Hematol 2007; 82: 1080–1087.
Article Google Scholar - Fabris S, Storlazzi CT, Baldini L, Nobili L, Lombardi L, Maiolo AT et al. Heterogeneous pattern of chromosomal breakpoints involving the MYC locus in multiple myeloma. Genes Chromosomes Cancer 2003; 37: 261–269.
Article CAS Google Scholar - Nagoshi H, Taki T, Hanamura I, Nitta M, Otsuki T, Nishida K et al. Frequent PVT1 rearrangement and novel chimeric genes PVT1-NBEA and PVT1-WWOX occur in multiple myeloma with 8q24 abnormality. Cancer Res 2012; 72: 4954–4962.
Article CAS Google Scholar - Zeidler R, Joos S, Delecluse HJ, Klobeck G, Vuillaume M, Lenoir GM et al. Breakpoints of Burkitt’s lymphoma t(8;22) translocations map within a distance of 300 kb downstream of MYC. Genes Chromosomes Cancer 1994; 9: 282–287.
Article CAS Google Scholar - Ross FM, Ibrahim AH, Vilain-Holmes A, Winfield MO, Chiecchio L, Protheroe RK et al. Age has a profound effect on the incidence and significance of chromosome abnormalities in myeloma. Leukemia 2005; 19: 1634–1642.
Article CAS Google Scholar - Chiecchio L, Protheroe RK, Ibrahim AH, Cheung KL, Rudduck C, Dagrada GP et al. Deletion of chromosome 13 detected by conventional cytogenetics is a critical prognostic factor in myeloma. Leukemia 2006; 20: 1610–1617.
Article CAS Google Scholar - Chiecchio L, Dagrada GP, White HE, Towsend MR, Protheroe RK, Cheung KL et al. Frequent upregulation of MYC in plasma cell leukemia. Genes Chromosomes Cancer 2009; 48: 624–636.
Article CAS Google Scholar - Walker BA, Wardell CP, Johnson DC, Kaiser MF, Begum DB, Dahir NB et al. Characterization of IGH locus breakpoints in multiple myeloma indicates a subset of translocations appear to occur in pregerminal center B cells. Blood 2013; 121: 3413–3419.
Article CAS Google Scholar - Rausch T, Zichner T, Schlattl A, Stutz AM, Benes V, Korbel JO . DELLY: structural variant discovery by integrated paired-end and split-read analysis. Bioinformatics 2012; 28: i333–i339.
Article CAS Google Scholar - Goecks J, Nekrutenko A, Taylor J, Galaxy T . Galaxy: a comprehensive approach for supporting accessible, reproducible, and transparent computational research in the life sciences. Genome Biol 2010; 11: 8.
Article Google Scholar - Chiecchio L, Dagrada GP, Ibrahim AH, Dachs Cabanas E, Protheroe RK, Stockley DM et al. Timing of acquisition of deletion 13 in plasma cell dyscrasias is dependent on genetic context. Haematologica 2009; 94: 1708–1713.
Article CAS Google Scholar - Kaiser MF, Walker BA, Hockley SL, Begum DB, Wardell CP, Gonzalez D et al. A TC classification-based predictor for multiple myeloma using multiplexed real-time quantitative PCR. Leukemia 2013; 27: 1754–1757.
Article CAS Google Scholar - Hnisz D, Abraham B, Lee T, Lau A, Saint-André V, Sigova A et al. Super-enhancers in the control of cell identity and disease. Cell 2013; 155: 934–947.
Article CAS Google Scholar - Loven J, Hoke HA, Lin CY, Lau A, Orlando DA, Vakoc CR et al. Selective inhibition of tumor oncogenes by disruption of super-enhancers. Cell 2013; 153: 320–334.
Article CAS Google Scholar - Boyd KD, Ross FM, Walker BA, Wardell CP, Tapper WJ, Chiecchio L et al. Mapping of chromosome 1p deletions in myeloma identifies FAM46C at 1p12 and CDKN2C at 1p32.3 as being genes in regions associated with adverse survival. Clin Cancer Res 2011; 17: 7776–7784.
Article CAS Google Scholar - Chapman MA, Lawrence MS, Keats JJ, Cibulskis K, Sougnez C, Schinzel AC et al. Initial genome sequencing and analysis of multiple myeloma. Nature 2011; 471: 467–472.
Article CAS Google Scholar - Walker BA, Wardell CP, Melchor L, Hulkki S, Potter NE, Johnson DC et al. Intraclonal heterogeneity and distinct molecular mechanisms characterize the development of t(4;14) and t(11;14) myeloma. Blood 2012; 120: 1077–1086.
Article CAS Google Scholar - Morgan GJ, Walker BA, Davies FE . The genetic architecture of multiple myeloma. Nat Rev Cancer 2012; 12: 335–348.
Article CAS Google Scholar - Verkoczy L, Guinn B, Berinstein N . Characterization of the human B cell RAG-associated gene, hBRAG, as a B cell receptor signal-enhancing glycoprotein dimer that associates with phosphorylated proteins in resting B cells. J Biol Chem 2000; 275: 20967–20979.
Article CAS Google Scholar - Verkoczy L, Marsden P, Berinstein N . hBRAG a novel B cell lineage cDNA encoding a type II transmembrane glycoprotein potentially involved in the regulation of recombination activating gene 1 (RAG1). Eur J Immunol 1998; 28: 2839–2853.
Article CAS Google Scholar - Hinman R, Nichols W, Diaz T, Gallardo T, Castrillon D, Satterthwaite A . Foxo3-/-mice demonstrate reduced numbers of pre-B and recirculating B cells but normal splenic B cell sub-population distribution. Int Immunol 2009; 21: 831–842.
Article CAS Google Scholar - Bertrand P, Bastard C, Maingonnat C, Jardin F, Maisonneuve C, Courel MN et al. Mapping of MYC breakpoints in 8q24 rearrangements involving non-immunoglobulin partners in B-cell lymphomas. Leukemia 2007; 21: 515–523.
Article CAS Google Scholar - Moalli PA, Pillay S, Weiner D, Leikin R, Rosen ST . A mechanism of resistance to glucocorticoids in multiple myeloma: transient expression of a truncated glucocorticoid receptor mRNA. Blood 1992; 79: 213–222.
CAS PubMed Google Scholar
Acknowledgements
We acknowledge The Institute of Cancer Research Tumour Profiling Unit for their support and technical expertise in this study. This work was supported by a Myeloma UK program grant, a CRUK CTAAC sample collection grant and funds from the National Institute of Health Biomedical Research Centre at the Royal Marsden Hospital. FED is a Cancer Research UK Senior Clinical Fellow.
Author information
Authors and Affiliations
- Division of Molecular Pathology, The Institute of Cancer Research, London, UK
B A Walker, C P Wardell, A Brioli, E Boyle, M F Kaiser, D B Begum, N B Dahir, D C Johnson & G J Morgan - Istituto di Ematologia Seràgnoli, Università degli Studi di Bologna, Policlinico S. Orsola-Malpighi, Bologna, Italy
A Brioli - Wessex Regional Genetics Laboratory, Salisbury District Hospital, Salisbury, UK
F M Ross - Divisions of Molecular Pathology, Cancer Therapeutics and Clinical Sciences, The Institute of Cancer Research, London, UK
F E Davies
Authors
- B A Walker
You can also search for this author inPubMed Google Scholar - C P Wardell
You can also search for this author inPubMed Google Scholar - A Brioli
You can also search for this author inPubMed Google Scholar - E Boyle
You can also search for this author inPubMed Google Scholar - M F Kaiser
You can also search for this author inPubMed Google Scholar - D B Begum
You can also search for this author inPubMed Google Scholar - N B Dahir
You can also search for this author inPubMed Google Scholar - D C Johnson
You can also search for this author inPubMed Google Scholar - F M Ross
You can also search for this author inPubMed Google Scholar - F E Davies
You can also search for this author inPubMed Google Scholar - G J Morgan
You can also search for this author inPubMed Google Scholar
Corresponding author
Correspondence toG J Morgan.
Additional information
Supplementary Information accompanies this paper on Blood Cancer Journal website
Supplementary information
Rights and permissions
This work is licensed under a Creative Commons Attribution-NonCommercial-NoDerivs 3.0 Unported License. To view a copy of this license, visit http://creativecommons.org/licenses/by-nc-nd/3.0/
About this article
Cite this article
Walker, B., Wardell, C., Brioli, A. et al. Translocations at 8q24 juxtapose MYC with genes that harbor superenhancers resulting in overexpression and poor prognosis in myeloma patients.Blood Cancer Journal 4, e191 (2014). https://doi.org/10.1038/bcj.2014.13
- Received: 30 January 2014
- Accepted: 06 February 2014
- Published: 14 March 2014
- Issue Date: March 2014
- DOI: https://doi.org/10.1038/bcj.2014.13