Mapping the p53 transcriptome universe using p53 natural polymorphs (original) (raw)
Main
The tumor suppressor p53 acts as a master regulator of cellular stress responses through transcriptionally regulating specific target genes involved in diverse cellular functions including cell cycle arrest, apoptosis, and DNA repair.1 With the aid of large-scale screening techniques, it has become clear that the scope of p53 functions is much broader than previously thought,2, 3 expanding to cellular and physiological processes such as metabolism4 and development.5 To have a better understanding of this important tumor suppressor, we must be able to study the full complexity of its downstream effects and this requires the efficient identification and validation of genes directly regulated by p53. To date, there are fewer than 150 validated p53 target genes6, 7, 8 and at the same time validation studies have been slow, which is a limitation on the progress in this field.
In order to be regulated by p53 a gene must possess the appropriate cognate response element (RE) within its regulatory region. However, our previous study has shown that simple sequence motif identification is not sufficient, as the p53RE exhibits variable binding kinetics that are dependent upon the dinucleotide core ‘C_WW_G’ combinations.9 These variables often result in spurious outcomes and hence we are in need of more robust approaches to accurately identify p53 transcriptional networks.
Here, we describe an unbiased method to review 135 reported p53 target genes and at the same time identify new p53 targets on a genome-wide scale. We utilized wild-type (WT) p53 together with 16 allelic replicates comprising all reported non-synonymous single-nucleotide polymorphism (SNP) variants of p53. As the transcriptional functions of these 16 SNPs have not been well studied, we first developed a customized luciferase assay with promoter reporter vectors encompassing all combinatorial forms of the dinucleotide core ‘C_WW_G’ to analyze the p53 SNPs, which separated them into two distinct functional groups of p53WT-like and p53null-like variants. This functional partitioning enabled the characterization of each p53 SNP as a pattern response and allowed the differential behavior of p53WT and its 16 SNP variants to be reflected in their capacity to drive different programs of transcriptome activity. Interrogating the genome using allelic forms of p53 as replicates, with each variant functionally characterized for their binding kinetics to the p53RE, has yielded a set of p53 target genes, many of which had not been previously identified.
Results
p53 SNP variants possess distinct transcriptional and DNA-binding properties
To identify novel p53 direct target genes on a genome-wide scale, we sought to improve the traditional gene expression profiling-based methods by applying a comprehensive functional assessment of natural p53 polymorphisms. Constructs of the p53 variants expressing all reported exonic missense polymorphisms10, [11](/articles/cdd2013132#ref-CR11 "NCBI SNP database [ http://www.ncbi.nlm.nih.gov/projects/SNP/
].") were generated using site-directed mutagenesis, covering 16 SNPs located in the p53 transactivating domain (TAD) P47S, proline-rich domain (PD) P72R, DNA-binding domain (DBD) R110L, R110P, D184N, V217M, R248Q, N263D, R267W, P278A, R290H, linker region N311S, G360A, oligomerization domain (OD) E339K, or in the negative regulatory domain (NRD) S366A, S378P ([Figure 1a](/articles/cdd2013132#Fig1); [Supplementary Table 1](/articles/cdd2013132#MOESM1)).[12](/articles/cdd2013132#ref-CR12 "Cho Y, Gorina S, Jeffrey PD, Pavletich NP . Crystal structure of a p53 tumor suppressor-DNA complex: understanding tumorigenic mutations. Science 1994; 265: 346–355.") To provide a more robust and reliable method for determination of p53 regulated transcription, we developed two customized assays, one to accurately assess the transcriptional function of p53 using a p53RE-driven luciferase system comprising all combinations of the core C_WW_G motif[9](/articles/cdd2013132#ref-CR9 "Wang B, Xiao Z, Ren EC . Redefining the p53 response element. Proc Natl Acad Sci USA 2009; 106: 14373–14378.") and the second a sensitive DNA binding assay to understand the correlation between transcriptional activity and the capacity of p53 to bind DNA ([Figure 1b](/articles/cdd2013132#Fig1)).Figure 1
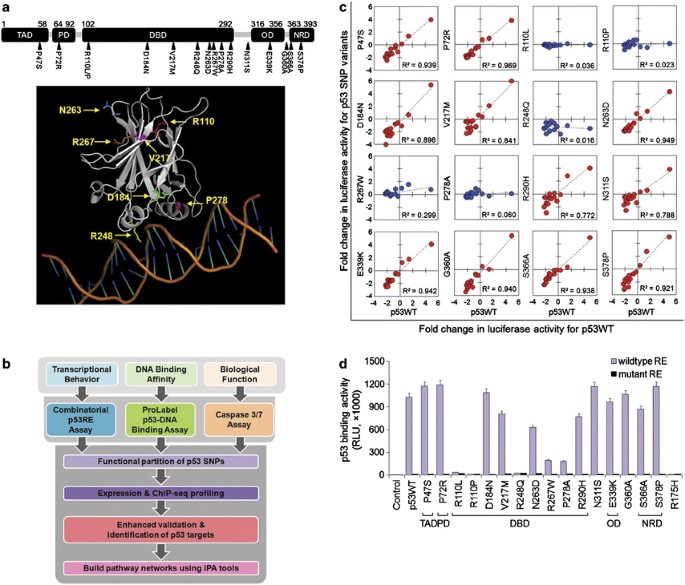
p53 SNP variants possess different transcriptional activities. (a) Schematic representation of the location of 16 p53 SNPs within TP53. The amino-acid number marking the beginning and end of each domain is also indicated. A structural image showing the SNP locations available from the reported p53 protein structure (PDB code: 1TSR)12 was generated using the PyMOL Molecular Graphics System and shown at the bottom panel. (b) Flowchart showing strategy using functional assessment of p53 SNP variants to validate known p53 targets and identify novel p53 targets. (c) Correlation analysis of fold change in luciferase activity for p53WT versus each of the 16 p53 SNPs relative to pcDNA3.1 control showed that the 11 p53 SNPs functionally behave like p53WT in regulating the target promoter activity (red), whereas the other 5 SNPs are functionally null (blue). Background LASP1 gene promoter luciferase constructs containing 16 different dinucleotide core combinations were used. R: correlation coefficient. (d) DNA binding activity of p53WT-like SNPs and p53null-like SNPs to the p21 p53RE sequences (wild type or mutant) was determined by ProLabel p53-DNA binding assay. The 11 p53WT-like SNPs bind effectively to the p21 p53RE as the wild-type p53 does, in contrast, the 5 p53null-like SNPs show minimal binding. Data are representative of three independent experiments (mean±S.D.). Abbreviations: TAD, transactivating domain; PD, proline-rich domain; DBD, DNA-binding domain; OD, oligomerization domain; NRD, negative regulatory domain
The transcriptional activity of each p53 SNP variant was measured by the combinatorial p53RE assay and compared against WT p53 (p53WT). When the results were plotted as a 16-point regression line, it revealed two distinct behaviors of the 16 p53 SNP variants (Figure 1c): 11 resembled p53WT across all C_WW_G combinations (p53WT-like) (_R_2=0.772–0.969), whereas the remaining 5 SNPs, all located in the DBD (R110L, R110P, R248Q, R267W, and P278A, _R_2=0.016–0.299), lost their ability to regulate the p53 target RE constructs (p53null-like).
Three established p53 targets, p21 (also known as CDKN1A),13 PLK3,14 and RNF144B (also known as p53RFP),15 were tested as an additional confirmation for transcriptional functions of p53 SNP variants. The luciferase results using promoter constructs bearing the respective p53RE together with the real-time qPCR analysis for the mRNA expression (Supplementary Figure 1) recapitulated the differential patterns, thus further validating the efficacy of the combinatorial p53RE assay.
As the loss-of-function p53 variants all possessed SNPs within the DBD (though not all DBD SNPs were loss-of-function), we asked whether this was due to a direct effect on their ability to bind the p53REs. To test this, we developed a second customized assay using a ProLabel Protein-DNA assay system (Clontech Laboratories, Inc., Mountain View, CA, USA) by generating a series of pProLabel vectors carrying p53WT or different SNP variants to express ProLabel-tagged human p53 protein variants for testing their binding to the p53RE of the p21 gene.13 The results showed a perfect agreement in which the p53WT-like SNPs bound strongly to the established p53RE, whereas the p53null-like SNPs showed negligible binding (Figure 1d).
p53 SNP variants possess differential functional characteristics
To determine the functional impact of the different DNA-binding and transcriptional activities of the p53 SNP variants, we proceeded to measure apoptosis which is a process highly dependent on p53 activation.16 The results showed a clear separation of Caspase 3/7 activity levels between p53WT-like and p53null-like groups of variants in both unstressed (Supplementary Figure 2) and stressed conditions such as 5-fluorouracil (5-FU) treatment (Figure 2a).
Figure 2
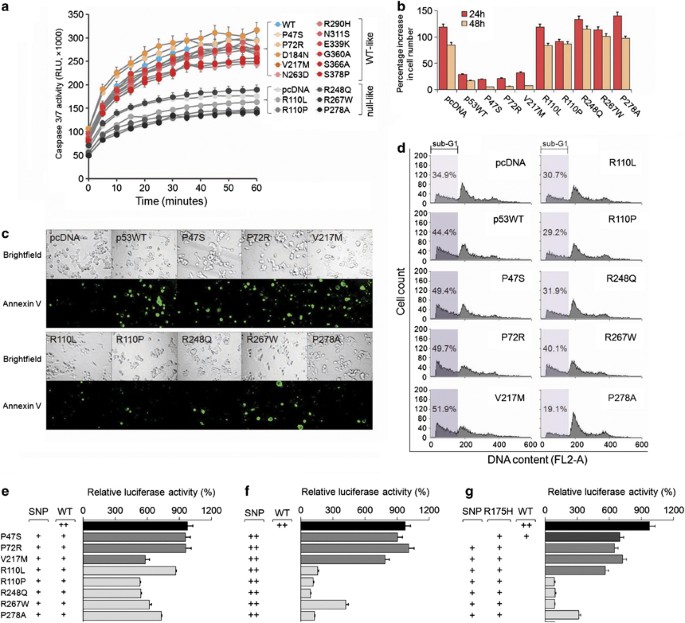
p53 SNP variants possess differential functional characteristics. (a) Caspase 3/7 activities of p53WT- and 16 p53 SNP-transfected HCT116 (p53−/−) cells in response to 5-FU treatment. Readings were taken at 5 min intervals for 60 min. p53WT and p53WT-like SNP transfectants clustered to exhibit higher Caspase 3/7 activities than the other clusters containing pcDNA3.1 control and p53null-like SNP-transfected cells. (b) Cell proliferation rates of p53WT- and eight p53 SNP-transfected HCT116 (p53−/−) cells in response to genotoxic 5-FU (50 _μ_g/ml) treatment, measured by WST-1 assay. Data are presented as the percentage increase in cell number at each time point relative to the starting point. (c) Images of apoptotic HCT116 (p53−/−) cells transfected with p53WT or one of eight p53 SNPs, and labelled with Annexin V-FITC following 5-FU treatment. (d) Overexpression of p53WT or three p53WT-like SNPs (P47S, P72R, and V217M) in HCT116 (p53−/−) cells induces more cell death than five p53null-like SNPs (R110L, R110P, R248Q, R267W, and P278A) in response to 5-FU treatment for 48 h. Cells in different treatment groups were separately collected for flow cytometric analysis with PI staining. The percentage of cells in sub-G1 phase is indicated. (e) Effect of transfection of equal amounts of each different p53 SNP and p53WT on p21 promoter activity, measured by luciferase assay. (f) Effect of transfection of each different p53 SNP on p21 promoter activity by luciferase assay. (g) Effect of transfection of equal amount of each different p53 SNP and the dominant-negative p53 mutant R175H on p21 promoter activity, measured by luciferase assay. +, single dose (20 ng/ml); ++, double dose (40 ng/ml). Data are representative of three independent experiments (mean±S.D.)
The differential abilities of p53 SNPs in driving apoptosis were further evaluated using three representative p53WT-like SNPs (P47S, P72R, and V217M) and the five p53null-like SNPs by additional evidence. Cells transfected with the p53WT-like SNPs proliferated slower than p53null-like SNP-transfected cells (Supplementary Figure 3a). In addition, no increase in cell number was observed for cells with overexpressed p53WT-like SNPs after 48 h of exposure to 5-FU (Figure 2b) or Doxorubicin (Dox) (Supplementary Figure 3b), while p53null-like SNP-transfected cells remained proliferative, suggesting that these SNPs could adversely affect the activation of p53 following genotoxic insult. Another measurement of cellular apoptosis using Annexin V labelling confirmed that cells transfected with p53WT-like SNPs were undergoing cell death, while the p53null-like SNPs were dying at a comparable rate to the pcDNA3.1 control transfectants (Figure 2c). Propidium iodide staining supported the Annexin V data: 5-FU-treated p53WT-like SNP transfectants exhibited cell death rates averaging 50.3% (range 49.4–51.9%), whereas p53null-like SNPs averaged 30.2% (19.1–40.1%, Figure 2d). These effects were not specific to chemically induced DNA lesions and were also seen following ultraviolet (UV) treatment of transfected cells (Supplementary Figure 4). Thus, the initial observation of two distinguishable groups of p53 SNP variants based on their DNA-binding and transcriptional activity is further supported by observations on their functional effects in whole-cell assays.
To test whether there is any combination effect of the polymorphs, we generated nine constructs covering all combined forms of the five p53null-like SNPs in two different sites and assessed their functions by both luciferase promoter assay and Caspase 3/7 assay. The results showed that these SNP variants consistently lost their functions no matter whether they exist alone or in combination with any of the other one (Supplementary Figure 5).
To further investigate the functional effect of p53 SNP variants, we tested the dose effect of p53WT and a p53 SNP variant transfected into HCT116 (p53−/−) cells. Figure 2e shows that having a single copy of p53WT in combination with any of the p53 SNP variants tested is able to efficiently drive promoter activity of the p21 gene. By replacing p53WT with a second copy of the same SNP, there is a dramatic loss of function in the case of the p53null-like SNPs; while p53WT-like SNPs retained a similar level of activity as p53WT (Figure 2f). Strikingly, when p53WT was replaced by the dominant-negative mutant R175H, in combination with any of the five p53null-like SNPs, we observed a complete loss of function (Figure 2g). In contrast, the p53WT-like SNPs maintained a high level of activity even in the presence of the R175H mutant, suggesting that these variants functionally resemble p53WT, and so can legitimately be considered as functional alleles of the WT tumor suppressor. These data not only revealed that p53null-like SNPs cause potentially deleterious functional defects, but also highlighted the opportunity to utilize them as biologically relevant negative controls, similar to dominant-negative p53 mutants such as R175H.
Enhanced validation of known p53 targets using gene expression profiling of p53 SNPs
A reference panel of well-characterized p53 targets (_n_=135) were first compiled from the literature (Supplementary Table 2) and we asked the question whether the evaluation of these genes using the p53 SNPs as biological replicates can provide a stringent assessment for their p53 response. First, each of the 16 p53 SNP constructs were separately transfected into HCT116 (p53−/−) cells and their expression profiles measured by Exon Array. Student’s _t_-test was introduced to assess the significance of fold change (FC) for the set of 135 reference panel genes. In all, 118/135 genes were found to conform to the differential expression pattern in p53WT-like and p53null-like SNP transfectants with a calculated significance of P<0.05 (Supplementary Figure 6; Supplementary Table 3). When analyzing these genes as a whole, the p53WT-like variants correlated strongly with the p53WT control (Figure 3a; Supplementary Figure 7), while no correlation was seen between the p53WT-like variants and a pcDNA3.1-negative control (Figure 3b). The cells transfected with p53null-like SNPs showed either no change or downregulation of mRNA expression when compared with p53WT (Figure 3c; Supplementary Figure 7).
Figure 3
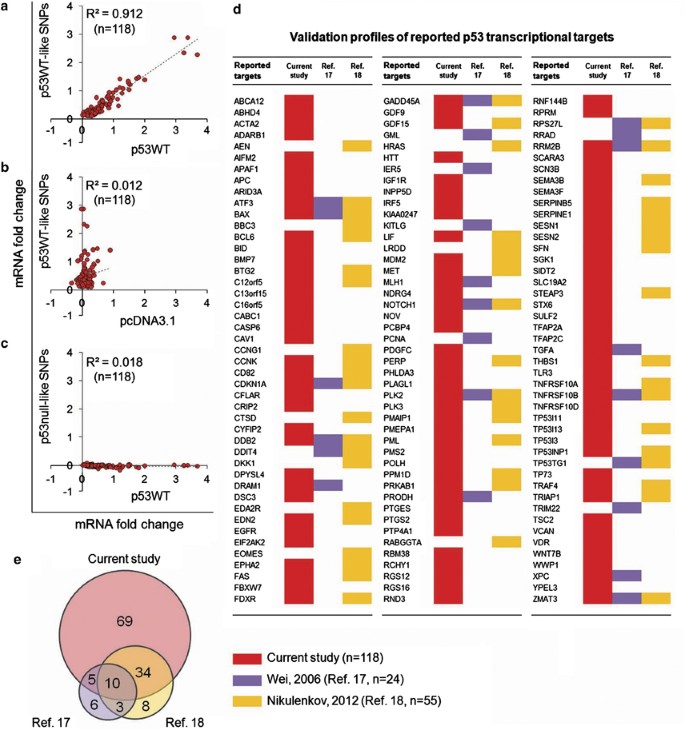
Validation of p53 targets using gene expression profiling of p53 SNP variants. (a) Correlation analysis of normalized fold change (FC) in expression of 118 validated reported p53 target genes induced by p53WT versus the average FC of 11 p53WT-like SNPs. (b) Correlation analysis of normalized FC in expression of 118 validated reported p53 target genes induced by pcDNA3.1 versus the average FC of 11 p53WT-like SNPs. (c) Correlation analysis of normalized FC in expression of 118 validated reported p53 target genes induced by p53WT versus the average FC of 5 p53null-like SNPs. (d) Validation profiles of 135 well-characterized p53 target genes. Data sets were obtained from three independent studies on p53 targets. Individual genes were highlighted with background colors when successfully validated by the current study (red), Wei et al.17 (purple) or Nikulenkov et al.18 (orange). (e) Overlap of well-characterized reported p53 targets validated by the current study (red), Wei et al.17 (purple) and Nikulenkov et al.18 (orange)
Two other genome-scale studies that utilized comparable microarray profiling and chromatin-IP coupled sequencing techniques had listed a number of p53-regulated genes. A search within these 2 studies for genes that corresponded to the reference list of 135 reported p53 target genes showed that only 24/135 genes (17.8%, Wei et al.17) and 55/135 genes (40.7%, Nikulenkov et al.18) were correctly identified among the reference list. In comparison, our current study was able to validate 118/135 (87.4%) reported p53 target genes (Figure 3d). When the three studies are compared for their coverage of p53 targets, our current study successfully picked out 69 unique genes which were missed by the other 2 studies (Figure 3e), demonstrating a highly sensitive and reliable method in validation of p53 targets.
Identification of novel p53 target genes
Another potential application of this method is to apply the Exon Array expression patterns toward identifying novel p53 target genes. To do so, 10 genes that were confirmed by all three studies (Figure 3e) were used to generate a classifier set. On the basis of these 10 genes, an inclusion criteria to be used as a cutoff point was calculated to be median FC≥0.248 (P<0.05). To enhance the identification of direct p53 targets, we also performed genome-wide chromatin immunoprecipitation coupled sequencing (ChIP-seq) on two different cell types HCT116 (p53+/+) and normal human peripheral blood mononuclear cells (PBMCs) and their combined data set were used to provide more robust coverage of chromosome segments.
By applying the inclusion criteria together with ChIP-seq confirmation, a list of potential p53 targets (_n_=664) were thus derived from the screen (Figure 4a). Among the 664 genes, 72 were found to be well-characterized reported targets and they showed a high degree of concordance in their differential expression patterns with the remaining 592 novel gene targets (Supplementary Figure 8; Supplementary Tables 4–6). In contrast, only 8 genes from Wei et al.17 and 24 genes from Nikulenkov et al.18 were similarly found to be present (Figure 4a). The mRNA expression of these novel p53 targets in 11 p53WT-like SNP-transfected cell showed a strong correlation with p53WT, whereas the 5 p53null-like SNPs showed no correlation (Figures 4b–d; Supplementary Figure 8). A combined correlation analysis of the set of reported target genes validated by the current study (_n_=118) with the 592 newly identified targets also highlighted a high degree of consistency (_R_2=0.869; Figures 4e–g).
Figure 4
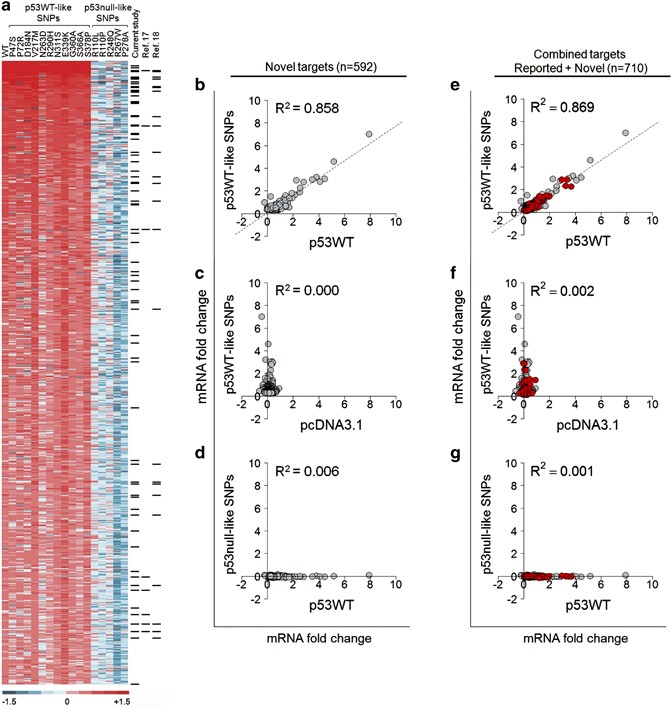
Genome-wide identification of novel p53 target genes using gene expression profiling of p53 SNPs transfected into HCT116 (p53−/−) cells. (a) Heatmap representation of fold change in mRNA expression in 17 different experiments (p53WT and 16 p53 variants) in which 664 genes that meet the inclusion criteria of P<0.05, FC≥0.248 are displayed. Among the set of 664 genes, 72 genes are well-characterized reported p53 targets (represented by black bars on the right-hand columns of chart) and demonstrate the comparative effectiveness in selecting p53 targets by the current study (_n_=72), Wei et al.17 (_n_=8) and Nikulenkov et al.18 (_n_=24). The remaining 592 novel p53 targets are listed in detail in Supplementary Table 5. (b) Correlation analysis of normalized FC in expression of 592 newly identified p53 targets induced by p53WT versus the average FC of 11 p53WT-like SNPs. (c) Correlation analysis of normalized FC in expression of 592 newly identified p53 targets induced by pcDNA3.1 versus the average FC of 11 p53WT-like SNPs. (d) Correlation analysis of normalized FC in expression of 592 newly identified p53 targets induced by p53WT versus the average FC of 5 p53null-like SNPs. (e) Combined correlation analysis of normalized FC in expression of all p53 targets (_n_=710) in the current study induced by p53WT versus the average FC of 11 p53WT-like SNPs. Known targets in red and novel targets in gray. (f) Combined correlation analysis of normalized FC in expression of all p53 targets (_n_=710) in the current study induced by pcDNA3.1 versus the average FC of 11 p53WT-like SNPs. Known targets in red and novel targets in gray. (g) Combined correlation analysis of normalized FC in expression of all p53 targets (_n_=710) in the current study induced by p53WT versus the average FC of five p53null-like SNPs. Known targets in red and novel targets in gray. R, correlation coefficient
Insights from the globally mapped p53 targets
The globally mapped p53 targets that were validated and newly identified by the current study were clustered into 14 major functional categories (and one group of unknown function) based on the gene annotation (Figure 5a). As expected, ‘apoptosis’, ‘cell-cycle regulation’, and ‘cellular stress and DNA damage response’ predominated in terms of known genes. This suggests that the past p53 studies were largely focused on these classical p53 functions. In contrast, many new target genes were seen in the other gene clusters including ‘cell signalling’, ‘biosynthesis and metabolism’, and ‘cell motility’ (Figure 5b), indicating that p53 has a potential functional involvement in a more variety of cellular processes than that was previously thought.
Figure 5
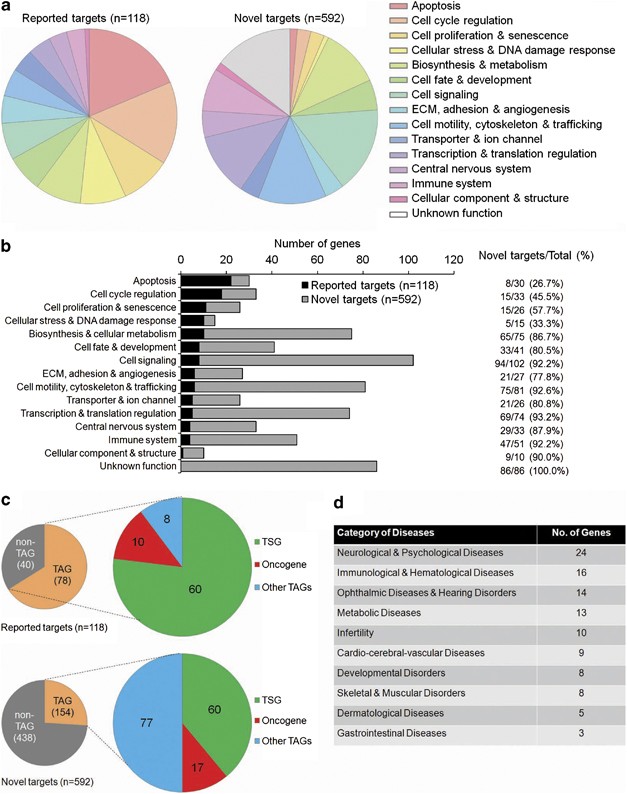
Functional distribution analysis of p53 target genes. (a) Pie charts showing functional distributions of validated known targets (_n_=118) and novel targets (_n_=592) identified by the current study. (b) Bar chart showing the relative numbers of validated known targets and identified novel targets in each functional category. The percentages for novel targets are also listed. (c) Small pie charts showing the number of tumor-associated genes (TAGs) and non-TAGs, large pie charts showing the number of tumor suppressor genes (TSGs), oncogenes, and other TAGs within the category of TAGs for both known targets (_n_=118) and novel targets (_n_=592) identified in the current study. The detailed information of TAGs is listed in Supplementary Table 7. (d) Table showing the number of disease-associated genes (DAGs) in each disease category. The detailed information of DAGs is listed in Supplementary Table 8
As a master tumor suppressor gene (TSG), p53 regulates many other tumor-associated genes (TAGs). We tabulated the number of TAGs and non-TAGs from the current gene list (Figure 5c; Supplementary Table 7). Not surprisingly, the majority of known target genes (66%) are tumor associated, including 60 TSGs, 10 oncogenes, and 8 other TAGs. However, among novel target genes only 26% were TAGs, showing that our unbiased approach had uncovered a large proportion of genes potentially regulated by p53 that are involved in cellular phenomena distinct from cancer.
In accordance with our finding of p53-regulated genes outside the tumor categories, there is increasing evidence that p53 is an important regulator in both normal physiology and disease.16 Several p53 targets have been associated with non-cancerous conditions, such as neurological diseases (HTT),19 ophthalmic diseases (EPHA2),20 and developmental disorders (CAV1, TFAP2A).21, 22 Indeed, 97 of the 592 novel p53 targets we identified are associated with diseases across 10 major categories (Figure 5d; Supplementary Table 8); these include eczema (LCE3C), rheumatoid arthritis (FAM167A, IKBKB, STAT4, etc.), and diabetes (CPE, ENPP1, KCNQ1, RBM43, etc.). Intriguingly, 10 genes (BMP8A, CLGN, INPP5B, etc.) are associated with infertility and suggest a possible role of p53 in human reproduction.
A more cohesive view of transcriptional regulation can be gained when target genes are considered within a broader network; to achieve this Ingenuity Pathway Analysis (www.ingenuity.com) was used to link p53-regulated genes within their functional clusters (Figure 5a). Even in the established p53-regulated functional networks such as apoptosis and cell-cycle regulation (Supplementary Figure 9), the addition of several new gene candidates has enriched these pathways.
Validation of novel p53 targets
To confirm whether the novel potential targets respond to changes in p53 levels, 20 genes were randomly selected from the novel p53 target list (_n_=592) for validation: HCT116 (p53−/−) cells separately transfected with 16 p53 SNP variants were assayed for their mRNA expression by qPCR. While in cells transfected with the p53null-like SNPs, there was no notable upregulation of the genes tested, the p53WT-like transfectants markedly induced the target genes (Figure 6a). For further validation, we applied two additional treatments which are specific to p53, that is, Nutlin 3 induction23 and p53 siRNA knockdown. The results showed that all 20 genes responded to these treatments in a p53-dependent manner, and therefore provides strong support for the list of novel p53 targets (Figures 6b and c).
Figure 6
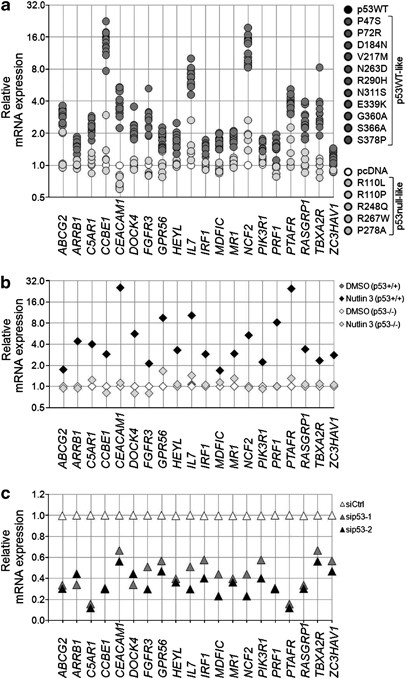
Validation of transcriptional regulation of selected novel potential p53 target genes. (a) Overexpression of p53WT-like SNPs but not p53null-like SNPs in HCT116 (p53−/−) cells activate the mRNA expression of 20 selected target genes relative to pcDNA3.1 control-transfected cells, as measured by real-time qPCR. (b) Nutlin 3 (25 _μ_M) treatment upregulates mRNA expression of 20 selected target genes in HCT116 (p53+/+) but not in HCT116 (p53−/−) cells, relative to DMSO solvent control-treated cells, as measured by real-time qPCR. (c) p53-specific siRNAs (sip53-1 and sip53-2) downregulate mRNA expression of 20 selected genes in HCT116 (p53+/+) cells relative to control siRNA (siCtrl)-transfected cells, as measured by real-time qPCR
To provide further validation of the list, we chose a single gene for functional assessment. One of the strongest responders to p53 regulation was STAT4, a critical mediator in IL12-induced interferon gamma (IFN_γ_) production.24, 25 Transfection of WT p53, but not the p53null-like SNP P278A in HCT116 (p53−/−) cells induced activation of STAT4 mRNA expression (Figure 7a) as well as its corresponding protein (Figure 7b), while knockdown of p53 in HCT116 (p53+/+) cells significantly diminished STAT4 expression (Figures 7c and d). In addition, treatment with Nutlin 3 or 5FU had similar effects that were also dependent on p53 (Figures 7e and f). A putative RE sequence identified from ChIP-seq peaks based on the p53 consensus binding sequence9, 26 was validated by luciferase promoter-driven assay (Figure 7g), tested to show a strong binding affinity to WT p53 protein but not the five p53null-like SNPs (Figure 7h), and thus can be confirmed to be the bona fide p53 responsive element (Figure 7i). A duplicate set of validations using Hep3B (p53−/−) and HepG2 (p53+/+) cells as well as Saos-2 (p53−/−) and U2OS (p53+/+) cells (Supplementary Figure 10) provided further evidence of the direct regulation of STAT4 by p53. Next, we measured the transcriptional activation of IFN_γ_ in phytohemagglutinin (PHA)-stimulated PBMCs. A significant upregulation of STAT4 as well as IFN_γ_ mRNA levels in response to Nutlin 3 was observed in both IL12- and solvent control- (PBS) treated cells (Figure 7j). Consistently, a specific IFN_γ_ enzyme-linked immunosorbent assay (ELISA) showed that Nutlin 3 could significantly enhance the production of IFN_γ_ (Figure 7k). These results suggest that p53 could affect IFN_γ_ secretion by directly regulating STAT4 transcription.
Figure 7
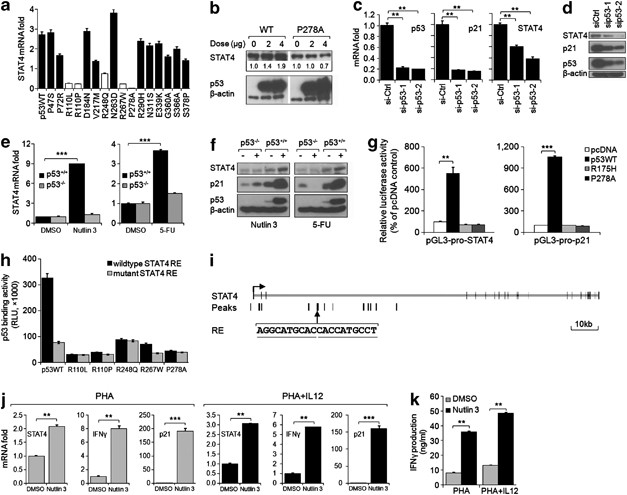
Identification of STAT4 as a bona fide p53 transcriptional target. (a) p53WT-like SNPs but not p53null-like SNPs activate the mRNA expression of STAT4 in HCT116 (p53−/−) cells, as measured by real-time qPCR. (b) Western blot analysis of STAT4 and p53 protein levels in HCT116 (p53−/−) cells transfected with different quantities of p53WT or P278A SNP variant constructs, with β_-actin as a loading control. The expression level of STAT4 relative to control was quantified as the fold strength of bands by the ImageJ software and indicated. (c) p53-specific siRNAs significantly decrease the mRNA expression of p53, p21, and STAT4 in HCT116 (p53+/+) cells compared with control siRNA (siCtrl)-transfected cells. (d) p53-specific siRNAs downregulate the protein level of p53, p21, and STAT4 in HCT116 (p53+/+) cells compared with control siRNA (siCtrl)-transfected cells. (e) mRNA expression of STAT4 in Nutlin 3 or 5FU-treated HCT116 (p53+/+) and HCT116 (p53−/−) cells relative to DMSO solvent control-treated cells. (f) Nutlin 3 or 5FU treatments activate and stabilize the cellular p53 as well as upregulate STAT4 and p21 protein expression in HCT116 (p53+/+) but not HCT116 (p53−/−) cells as measured by western blot analysis, with β_-actin as a loading control. (g) p53WT but not the dominant-negative mutant R175H, or the p53null-like SNP P278A activates the STAT4 putative RE constructs (pGL3-pro-STAT4) in HCT116 (p53−/−) cells, as measured by dual-luciferase assay. Data are presented as the percentage luciferase activity relative to the pcDNA3.1 control vector-transfected cells. The promoter construct containing p21 p53RE (pGL3-pro-p21) was used as a positive control. (h) p53WT but not the five p53null-like SNPs binds effectively to the sequence of putative wild-type STAT4 p53RE as determined by ProLabel p53-DNA binding assay. Mutant STAT4 p53RE was also included as a control. (i) Schematic representation of identified STAT4 p53RE in relative to the ChIP-seq peaks and the genomic localization of STAT4 gene. (j) Nutlin 3 treatment upregulates the mRNA expression of STAT4, p21, and IFN_γ in PHA-treated PBMCs both in the absence and in the presence of IL12, as measured by real-time qPCR. (k) IFN_γ_-specific ELISA showing the enhanced IFN_γ release in PHA-treated PBMCs in response to Nutlin 3 treatment, both in the absence and in the presence of IL12. **P<0.01, ***P<0.001. Data are representative of three independent experiments (mean±S.D.)
Discussion
Despite the extensive use of large-scale gene expression-based screening methods such as microarray, and genome-wide binding site searches using ChIP-coupled analysis17 or computational RE scans,27, 28 the universe of the p53 transcriptome has not been efficiently reproduced or validated. To provide a more robust and reliable approach, we developed a functional differentiation assay using the unique platform of p53RE C_WW_G core combinations to interrogate the transcriptional properties of p53 non-synonymous SNP variants. As each SNP variant is measured by 16 different combinations of C_WW_G (C_AT_G, C_AG_G, C_CG_G, etc.), their transcriptional behavior is accurately scored as an _R_2 value, which allowed the SNP variants to be differentiated into p53WT-like and p53null-like groups (Figure 1). In addition, we searched the IARC p53 database (http://p53.iarc.fr/)29 and retrieved the information for the clinical association of the SNP variants with p53 mutations found in a wide variety of cancers. The results showed that of the 1131 somatic mutations associated with p53 SNP variants, 93.1% (1053/1131) correlated with the p53null-like SNPs, while 50/61 (81.9%) are linked to the null-like variants at the germline level (Supplementary Table 9). This suggests that there is a significantly higher incidence of these alleles among human cancers.
The 11 p53WT-like SNP variants were utilized as ‘allelic replicates’ of WT p53, whereas the five p53null-like SNP variants served as dominant-negative controls for p53. The importance of replicates in microarray gene expression studies to provide reliability and improve data quality has been well documented.30 In p53 expression profile studies, several dominant-negative forms of p53 mutants are easily available for use as replicates of negative display.31, 32, 33 However, with WT p53 only a single form was utilized for positive display. Hence, the combinatorial C_WW_G p53RE assay was particularly valuable in its capacity to partition the p53 SNP variants, such that along with the p53WT, there are now 11 allelic replicates and for p53 null function, there are 5 allelic replicates.
Indeed, Exon Array data showed that these two groups of p53 variants elicited very different expression profiles when transfected into HCT116 (p53−/−) cells and these resulted in validation of 118 out of 135 known p53-activated targets. Although our method validated 87.4% of the reference p53 gene list, it is possible that the remaining 17/135 genes that were missed may have tissue-specific expression patterns or other transcriptional regulatory variations. There is evidence showing that both the cell type and the nature of the stress signal can affect the modulation of the transcriptional pattern of p53-responsive genes.8 This conditional induction of expression is suggestive of the complexity of p53-regulated gene networks and the use of this strategy on other cell types may yield additional valuable perspectives.
Applying the stringent criteria derived from the 10 overlapping genes validated by all three studies and integrating a genome-wide ChIP-seq analysis, 592 novel genes were found to match the criteria, and a pooled analysis (_n_=710) showed a close correlation for the p53WT-like SNPs (Figure 4e). The diversity of p53 functions is further illustrated by the functional classification analysis of both validated and novel identified p53 targets, which links p53 to many physiological function groups such as immune system, cell signalling, and cell motility. The functional distribution shown in Figure 5b indicated that the roles of p53 in certain cellular processes, such as apoptosis pathway (22/30 genes) are well established, while its potential functions in some other aspects, for example, the central nervous system (4/33 genes) are underestimated.
In this study, STAT4 was used for further validation and demonstrated to be a bona fide transcriptional target by p53, and this may provide an explanation for the dampening of the inflammatory response observed in cancers such as adult T-cell leukemia/lymphoma (ATL) in which both STAT4 and IFN_γ_ have been reported to be significantly reduced.34 In addition, although several studies proposed the cross-talk between the interferon system and p53,35, 36, 37, 38 it is still unclear whether p53 regulates the type II interferon gene IFNG. Our results, for the first time, established the connection from p53 activation to enhanced IFN_γ_ release in PHA-stimulated PBMCs via upregulation of STAT4 expression.
In summary, our results establish that sixteen p53 non-synonymous SNPs can be partitioned into two distinct functional groups, and thus are a useful tool with which to assess the global p53 transcriptome. Our data reveal that the universe of p53 targets extends more widely and deeply than previously thought, and suggest that there are many novel cellular and physiological functions regulated by p53. Future applications of this approach in other cell sources or with other stress signals will greatly contribute to a better understanding of p53 in health and disease.
Materials and Methods
Cell lines and cell culture
The human colon cancer cell line HCT116, its derived isogenic p53−/− cells, the p53WT (pCMV-p53), and mutant p53 (pCMV-p53-R175H) expression vectors were kindly provided by Dr Bert Vogelstein (Johns Hopkins University). The human liver cancer cell line HepG2 (HB-8065) and Hep3B (HB-8064) were purchased from ATCC, and the human osteosarcoma cell lines U2OS and Saos-2 were gifts from Dr Qiang Yu (Genome Institute of Singapore). All cells were maintained in Dulbecco’s Modified Eagle Medium supplemented with 10% fetal bovine serum.
Constructs, siRNAs, and drugs
Expression vectors of 16 different p53 SNPs and 9 double variants were generated using the QuickChange Site-Directed Mutagenesis Kit (Agilent Technologies, Santa Clara, CA, USA) with primer sequences listed in Supplementary Table 10. The promoter regions of p21, PLK3, and RNF144B each containing their p53 REs were cloned into pGL3-Basic vector (Promega, Madison, WI, USA). Primers used to separately isolate these promoter regions by PCR are listed in Supplementary Table 11. To validate the functionality of proposed REs of STAT4, the putative RE sequence was annealed and directly cloned between _Sac_I and _Xho_I restriction sites upstream of the minimal SV40 promoter in pGL3-Promoter vector (Promega). Annealing primers are listed in Supplementary Table 11. Stealth select RNAi duplexes for human TP53 (HSS110905/sip53-1, 5′-GCUUCGAGAUGUUCCGAGAGCUGAA-3′; HSS186390/sip53-2, 5′-GAGUGGAAGGAAAUUUGCGUGUGGA-3′) and negative control siRNA duplex (medium GC/siCtrl) were purchased from Life Technologies. Lipofectamine 2000 reagents (Life Technologies, Carlsbad, CA, USA) were used for transient transfection of either expression plasmids or siRNAs. 5-FU, Dox, and Nutlin 3 were purchased from Sigma-Aldrich (St. Louis, MO, USA). UV treatment was performed using a UVC 5000 crosslinker (GE Healthcare, Little Chalfont, UK).
Combinatorial p53RE assay
The 16 luciferase constructs based on the LASP1 promoter region containing different C_WW_G core motifs used in this study have been described previously.9, 39 Different promoter luciferase reporter constructs (2 _μ_g/ml) were co-transfected with pCMV-p53, pCMV-p53-SNPs, pCMV-p53-R175H, or pcDNA3.1 control plasmid (20–200 ng/ml), together with 20 ng/ml of Renilla control vector into HCT116 (p53−/−) cells plated in 96-well Flat Clear Black Microplates (Corning Incorporated, Corning, NY, USA). Thirty hours post transfection, the luciferase activity was measured by the Dual-Luciferase Reporter Assay System (Promega). For all luciferase assays, the normalized luciferase activity of each construct (Firefly/Renilla ratio) in the pCMV-p53 or pCMV-p53-SNPs co-transfected cells was then compared with that of the pcDNA3.1 control co-transfected cells.
ProLabel p53-DNA binding assay
ProLabel p53-DNA binding assay was performed to measure the binding affinity of different p53 SNP variants to p53 target RE sequences according to the manufacturer’s protocol (Clontech Laboratories, Inc.). The human WT p53 gene sequence was cloned between _Eco_RI and _Bam_HI restriction sites of pProLabel-C vector using primer set 5'-AAAGAATTCTATGGAGGAGCCGCAGTCAGATCCTA-3' (forward) and 5'-AAAGGATCCTCAGTCTGAGTCAGGCCCTTCTGT-3' (reverse). All pProLabel constructs carrying p53 variant sequences were then made by site-directed mutagenesis using pProLabel-p53WT as a template, using the same primer sequences as in Supplementary Table 10. Different pProLabel vectors were separately transfected into HCT116 (p53−/−) cells (4 _μ_g per 2 million cells) and 48 h later, cells were lysed with TALON Extractor Buffer (Protease inhibitor added) and the protein concentration quantified by the Bradford assay reagent (Bio-Rad Laboratories, Inc., Hercules, CA, USA). In all, 100 _μ_g of total cell lysate was used per binding reaction, and sequences for the biotinylated DNA probes (2 pmol per reaction) are listed in Supplementary Table 12.
WST-1 cell proliferation assay
HCT116 (p53−/−) cells transiently transfected with different p53 expression plasmids were harvested 24 h after transfection and replated into 96-well plates in triplicates in medium containing 5-FU (50 _μ_g/ml) or Dox (10 _μ_M). The number of living cells was measured daily using a modified MTT assay (WST-1 reagent; Roche Applied Science, Penzberg, Germany) according to the manufacturer’s protocol.
Annexin V labelling
HCT116 (p53−/−) cells transiently transfected with p53WT or different p53 SNP expression plasmids were replated into chamber slides (Becton Dickinson, Franklin Lakes, NJ, USA) in medium containing 5-FU (50 _μ_g/ml) 24 h after transfection. After overnight culture, the culture medium was decanted and the cells were washed with PBS twice before labelling with Annexin V Fluorescein (Annexin V-FLUOS kit; Roche) according to the manufacturer’s protocol. The fluorescence signals were immediately photographed through an Axiovert 200 inverted fluorescence microscope (Carl Zeiss, Oberkochen, Germany).
PI staining and flow cytometric analysis
HCT116 (p53−/−) cells transiently transfected with p53WT or different p53 SNP expression plasmids were treated with 5-FU (50 _μ_g/ml) or exposed to UV radiation (30 J/m2). Forty-eight hours later, cells were harvested and fixed in ice-cold 70% ethanol for 4 h. After treatment with RNase A (100 _μ_g/ml) for 5 min, the cells were stained with propidium iodide (50 _μ_g/ml, Sigma-Aldrich) for 60 min in the dark at room temperature. The DNA content of the stained cells was analyzed using a FACSCalibur with the CellQuest software (Becton Dickinson).
Caspase 3/7 assay
HCT116 (p53−/−) cells were seeded in 96-well plates for overnight incubation before transient transfection with p53WT or different p53 SNP expression plasmids, in triplicate. Twenty-four hours later, caspase 3/7 activity was measured using the Caspase-Glo 3/7 Assay (Promega) according to the manufacturer’s instructions.
Whole-genome exon array
p53WT, the 16 p53 SNP expression vectors, and the pcDNA3.1 control plasmid were separately transfected into HCT116 (p53−/−) cells. Total RNA was extracted 24 h post transfection, and 1 _μ_g of total RNA was used for GeneChip Human Exon 1.0 ST Arrays (Affymetrix, Inc., Santa Clara, CA, USA) according to the manufacturer’s instructions. After washing and staining by an Affymetrix Fluidics Station, the hybridized arrays were scanned on a Gene Array Scanner 2500 (Affymetrix) to capture the raw probe signal intensities. Background subtraction, quantile normalization, and summarizing probe sets from Affymetrix expression microarrays employed the Affymetrix Power Tools (APT) software. The resulting probeset signals were annotated by the Affymetrix annotation library HuEx-1_0-st-v2.na30.hg19.probeset.csv. FC was calculated for each individual gene as the percentage change of the differences between the average positive (p53WT and 11 p53WT-like SNPs) and negative values (pcDNA3.1 control and 5 p53null-like SNPs) relative to the negative measurements. Differences between positive and negative measurements were also analyzed using paired two-tailed Student’s t tests with _P-_values <0.05 considered as statistically significant.
ChIP-seq and data analysis
ChIP was carried out using HCT116 (p53+/+) cells and healthy donor PBMCs treated with 5-FU (50 _μ_g/ml) for 24 h as described.17 In all, 10 ng of ChIP or input DNA was used for library construction and single-end 36 bp sequencing using Illumina Genome Analyzer IIx was performed by Genotypic Technology (Bangalore, India) according to the standard protocol. Raw illumina ChIP-seq fastq files were analyzed at Galaxy (http://main.g2.bx.psu.edu) and Galaxy/Cistrome (http://cistrome.org). Briefly, single-end ChIP-seq reads were mapped to human reference genome assemblies HG19 using an ultrafast and memory-efficient short read aligner Bowtie40 taking into account the maximum of two mismatches permitted in the seed of 28 nt in length. ChIP-seq peak calling from mapped reads via MACS41 empirically models the sequenced ChIP fragments (tag size of 36 nt) with a dynamic Poisson distribution to effectively capture local biases in the genome sequence, and uses it to improve the spatial resolution of predicted binding sites that satisfied a _P_-value cutoff of 0.00001. R script was used for annotation.
RNA isolation and real-time qPCR analysis
Total RNA was isolated from experimental cells using the RNeasy Mini Kit (Qiagen, Hilden, Germany) and cDNA was synthesized using the Maxima First Strand cDNA Synthesis Kit (Thermo Fisher Scientific, Waltham, MA, USA). The mRNA expression of p53 target genes was analyzed by real-time quantitative PCR using the KAPA SYBR FAST qPCR Kit (KAPA Biosystems, Inc., Woburn, MA, USA) according to the manufacturer’s instructions. HPRT was used as a housekeeping gene with primer set HPRT-F: 5′-GTAATGACCAGTCAACAGGGGAC-3′ and HPRT-R: 5′-CCAGCAAGCTTGCGACCTTGACCA-3′. All other primers for real-time qPCR are listed in Supplementary Table 13.
Western blot
Cells were lysed with cell lysis buffer (50 mM Tris-HCl, pH7.8, 150 mM NaCl, 1% Nonidet P-40) on ice, supplemented with the complete protease inhibitor cocktail (Roche Applied Science) for 30 min at 4 °C and the protein concentration determined by the Bradford Protein Assay (Bio-Rad). Approximately 15–20 _μ_g of cell lysate was separated by 10% SDS-polyacrylamide gel electrophoresis, and transferred onto Hybond PVDF membranes (GE Healthcare). Primary antibodies against p53 (DO-1, sc-126), p21 (C-19, sc-397), and STAT4 (C-20, sc-486) (Santa Cruz Biotechnology, Santa Cruz, CA, USA), and appropriate HRP-conjugated secondary antibodies (Agilent Technologies) were used for protein detection. Signals were visualized with enhanced chemiluminescence (ECL) reagents (GE Healthcare). Equal loading of protein samples was verified with an antibody to _β_-actin (Millipore Corporation, Billerica, MA, USA).
Pathway analysis and structural display
Pathway analysis was generated through the use of IPA (Ingenuity Systems; www.ingenuity.com). The structural image indicating the SNP locations was generated using the PyMOL Molecular Graphics System, Version 0.99rc6 (PyMOL, DeLano Scientific LLC, Palo Alto, CA, USA).
Enzyme-linked immunosorbent assay
Fresh PBMCs extracted from a healthy donor were first cultured in the presence of PHA-L (20 ng/ml, Roche) for 72 h. Proliferated T lymphocytes were isolated, counted, and plated into 24-well plates for Nutlin 3 (25 μ_M) treatment for 24 h before IL12 (50 ng/ml, Human Recombinant IL12; R&D Systems Inc., Minneapolis, MN, USA) was added for another 24 h. Supernatant was then collected by centrifugation for detecting IFN_γ production using a Human IFN_γ_ ELISA kit (Thermo Fisher Scientific) according to the manufacturer’s instructions. The concentration of IFN_γ_ released was calculated using an IFN_γ_ standard curve and then normalized to the percentage of living cells measured by LDH assay with the Cytotoxicity Detection Kit Plus (Roche).
Statistical analyses
Experiments were repeated three times with similar results, and representative images or data are shown. Differences between averages and percentages of control and test conditions were statistically analyzed using paired two-tailed Student’s t tests with the Prism GraphPad Software (GraphPad Software Inc., San Diego, CA, USA). _P-_values <0.05 were considered as statistically significant.
Abbreviations
SNP:
single-nucleotide polymorphism
RE:
response element
WT:
wild-type
DBD:
DNA-binding domain
TAD:
transactivating domain
PD:
proline-rich domain
OD:
oligomerization domain
NRD:
negative regulatory domain
FC:
fold change
TAG:
tumor-associated gene
TSG:
tumor suppressor gene
DAG:
disease-associated gene
5-FU:
5-fluorouracil
Dox:
Doxorubicin
UV:
ultraviolet
ChIP-seq:
chromatin immunoprecipitation coupled with high throughput sequencing
IFN_γ_:
interferon gamma
PHA:
phytohemagglutinin
References
- Vogelstein B, Lane D, Levine AJ . Surfing the p53 network. Nature 2000; 408: 307–310.
Article CAS Google Scholar - Menendez D, Inga A, Resnick MA . The expanding universe of p53 targets. Nat Rev Cancer 2009; 9: 724–737.
Article CAS Google Scholar - Vousden KH, Prives C . Blinded by the light: the growing complexity of p53. Cell 2009; 137: 413–431.
Article CAS Google Scholar - Bensaad K, Tsuruta A, Selak MA, Vidal MN, Nakano K, Bartrons R et al. TIGAR, a p53-inducible regulator of glycolysis and apoptosis. Cell 2006; 126: 107–120.
Article CAS Google Scholar - Lefort K, Mandinova A, Ostano P, Kolev V, Calpini V, Kolfschoten I et al. Notch1 is a p53 target gene involved in human keratinocyte tumor suppression through negative regulation of ROCK1/2 and MRCKalpha kinases. Genes Dev 2007; 21: 562–577.
Article CAS Google Scholar - Brady CA, Attardi LD . p53 at a glance. J Cell Sci 2010; 123: 2527–2532.
Article CAS Google Scholar - Ma B, Pan Y, Zheng J, Levine AJ, Nussinov R . Sequence analysis of p53 response-elements suggests multiple binding modes of the p53 tetramer to DNA targets. Nucleic Acids Res 2007; 35: 2986–3001.
Article CAS Google Scholar - Riley T, Sontag E, Chen P, Levine A . Transcriptional control of human p53-regulated genes. Nat Rev Mol Cell Biol 2008; 9: 402–412.
Article CAS Google Scholar - Wang B, Xiao Z, Ren EC . Redefining the p53 response element. Proc Natl Acad Sci USA 2009; 106: 14373–14378.
Article CAS Google Scholar - Whibley C, Pharoah PD, Hollstein M . p53 polymorphisms: cancer implications. Nat Rev Cancer 2009; 9: 95–107.
Article CAS Google Scholar - NCBI SNP database [http://www.ncbi.nlm.nih.gov/projects/SNP/].
- Cho Y, Gorina S, Jeffrey PD, Pavletich NP . Crystal structure of a p53 tumor suppressor-DNA complex: understanding tumorigenic mutations. Science 1994; 265: 346–355.
Article CAS Google Scholar - Saramaki A, Banwell CM, Campbell MJ, Carlberg C . Regulation of the human p21 (waf1/cip1) gene promoter via multiple binding sites for p53 and the vitamin D3 receptor. Nucleic Acids Res 2006; 34: 543–554.
Article Google Scholar - Jen KY, Cheung VG . Identification of novel p53 target genes in ionizing radiation response. Cancer Res 2005; 65: 7666–7673.
Article CAS Google Scholar - Ng CC, Arakawa H, Fukuda S, Kondoh H, Nakamura Y . p53RFP, a p53-inducible RING-finger protein, regulates the stability of p21WAF1. Oncogene 2003; 22: 4449–4458.
Article CAS Google Scholar - Benchimol S . p53-dependent pathways of apoptosis. Cell Death Differ 2001; 8: 1049–1051.
Article CAS Google Scholar - Wei CL, Wu Q, Vega VB, Chiu KP, Ng P, Zhang T . A global map of p53 transcription-factor binding sites in the human genome. Cell 2006; 124: 207–219.
Article CAS Google Scholar - Nikulenkov F, Spinnler C, Li H, Tonelli C, Shi Y, Turunen M et al. Insights into p53 transcriptional function via genome-wide chromatin occupancy and gene expression analysis. Cell Death Differ 2012; 19: 1992–2002.
Article CAS Google Scholar - Norremolle A, Riess O, Epplen JT, Fenger K, Hasholt L, Sørensen SA . Trinucleotide repeat elongation in the Huntingtin gene in Huntington disease patients from 71 Danish families. Hum Mol Genet 1993; 2: 1475–1476.
Article CAS Google Scholar - Shiels A, Bennett TM, Knopf HL, Maraini G, Li A, Jiao X et al. The EPHA2 gene is associated with cataracts linked to chromosome 1p. Mol Vis 2008; 14: 2042–2055.
CAS PubMed PubMed Central Google Scholar - Kim CA, Delepine M, Boutet E, El Mourabit H, Le Lay S, Meier M et al. Association of a homozygous nonsense caveolin-1 mutation with Berardinelli-Seip congenital lipodystrophy. J Clin Endocrinol Metab 2008; 93: 1129–1134.
Article CAS Google Scholar - Milunsky JM, Maher TA, Zhao G, Roberts AE, Stalker HJ, Zori RT et al. TFAP2A mutations result in branchio-oculo-facial syndrome. Am J Hum Genet 2008; 82: 1171–1177.
Article CAS Google Scholar - Vassilev LT, Vu BT, Graves B, Carvajal D, Podlaski F, Filipovic Z et al. In vivo activation of the p53 pathway by small-molecule antagonists of MDM2. Science 2004; 303: 844–848.
Article CAS Google Scholar - Morinobu A, Gadina M, Strober W, Visconti R, Fornace A, Montagna C et al. STAT4 serine phosphorylation is critical for IL-12-induced IFN-gamma production but not for cell proliferation. Proc Natl Acad Sci USA 2002; 99: 12281–12286.
Article CAS Google Scholar - Thierfelder WE, van Deursen JM, Yamamoto K, Tripp RA, Sarawar SR, Carson RT et al. Requirement for Stat4 in interleukin-12-mediated responses of natural killer and T cells. Nature 1996; 382: 171–174.
Article CAS Google Scholar - el-Deiry WS, Kern SE, Pietenpol JA, Kinzler KW, Vogelstein B . Definition of a consensus binding site for p53. Nat Genet 1992; 1: 45–49.
Article CAS Google Scholar - Miled C, Pontoglio M, Garbay S, Yaniv M, Weitzman JB . A genomic map of p53 binding sites identifies novel p53 targets involved in an apoptotic network. Cancer Res 2005; 65: 5096–5104.
Article CAS Google Scholar - Wang L, Wu Q, Qiu P, Mirza A, McGuirk M, Kirschmeier P et al. Analyses of p53 target genes in the human genome by bioinformatic and microarray approaches. J Biol Chem 2001; 276: 43604–43610.
Article CAS Google Scholar - Petitjean A, Mathe E, Kato S, Ishioka C, Tavtigian SV, Hainaut P et al. Impact of mutant p53 functional properties on TP53 mutation patterns and tumor phenotype: lessons from recent developments in the IARC TP53 database. Hum Mutat 2007; 28: 622–629.
Article CAS Google Scholar - Lee ML, Kuo FC, Whitmore GA, Sklar J . Importance of replication in microarray gene expression studies: statistical methods and evidence from repetitive cDNA hybridizations. Proc Natl Acad Sci USA 2000; 97: 9834–9839.
Article CAS Google Scholar - Brady CA, Jiang D, Mello SS, Johnson TM, Jarvis LA, Kozak MM et al. Distinct p53 transcriptional programs dictate acute DNA-damage responses and tumor suppression. Cell 2011; 145: 571–583.
Article CAS Google Scholar - O'Farrell TJ, Ghosh P, Dobashi N, Sasaki CY, Longo DL . Comparison of the effect of mutant and wild-type p53 on global gene expression. Cancer Res 2004; 64: 8199–8207.
Article CAS Google Scholar - Scian MJ, Stagliano KE, Ellis MA, Hassan S, Bowman M, Miles MF et al. Modulation of gene expression by tumor-derived p53 mutants. Cancer Res 2004; 64: 7447–7454.
Article CAS Google Scholar - Pise-Masison CA, Radonovich M, Dohoney K, Morris JC, O'Mahony D, Lee MJ et al. Gene expression profiling of ATL patients: compilation of disease-related genes and evidence for TCF4 involvement in BIRC5 gene expression and cell viability. Blood 2009; 113: 4016–4026.
Article CAS Google Scholar - Dunn GP, Koebel CM, Schreiber RD . Interferons, immunity and cancer immunoediting. Nat Rev Immunol 2006; 6: 836–848.
Article CAS Google Scholar - Kim KS, Kang KW, Seu YB, Baek SH, Kim JR . Interferon-gamma induces cellular senescence through p53-dependent DNA damage signaling in human endothelial cells. Mech Ageing Dev 2009; 130: 179–188.
Article CAS Google Scholar - Munoz-Fontela C, Macip S, Martinez-Sobrido L, Brown L, Ashour J, García-Sastre A et al. Transcriptional role of p53 in interferon-mediated antiviral immunity. J Exp Med 2008; 205: 1929–1938.
Article CAS Google Scholar - Takaoka A, Hayakawa S, Yanai H, Stoiber D, Negishi H, Kikuchi H et al. Integration of interferon-alpha/beta signalling to p53 responses in tumour suppression and antiviral defence. Nature 2003; 424: 516–523.
Article CAS Google Scholar - Wang B, Feng P, Xiao Z, LIM Ren EC . and SH3 protein 1 (Lasp1) is a novel p53 transcriptional target involved in hepatocellular carcinoma. J Hepatol 2009; 50: 528–537.
Article CAS Google Scholar - Langmead B, Trapnell C, Pop M, Salzberg SL . Ultrafast and memory-efficient alignment of short DNA sequences to the human genome. Genome Biol 2009; 10: R25.
Article Google Scholar - Zhang Y, Liu T, Meyer CA, Eeckhoute J, Johnson DS, Bernstein BE et al. Model-based analysis of ChIP-Seq (MACS). Genome Biol 2008; 9: R137.
Article Google Scholar
Acknowledgements
This work is funded by the Agency for Science, Technology and Research (A*STAR), Singapore. We thank Ms. Wei Ping Tien, Ms. Liyun Lai, and Ms. Yun Rui Ng for technical assistance, Dr. Stanley Ng for help in analyzing microarray and ChIP-seq data, Dr. Bert Vogelstein for providing p53+/+ and p53−/− HCT116 cells, pCMV-p53 and pCMV-p53-R175H vectors, and Dr. Qiang Yu for providing U2OS and Saos-2 cell lines. We also thank Dr. Lucy Robinson of Insight Editing London for manuscript editing. THL is supported by a Research Scholarship, National University of Singapore.
Author information
Authors and Affiliations
- Singapore Immunology Network, A*STAR, 8A Biomedical Grove, 138648, Singapore
B Wang, D Niu, T H Lam, Z Xiao & E C Ren - Department of Microbiology, Yong Loo Lin School of Medicine, National University of Singapore, 117597, Singapore
T H Lam & E C Ren
Authors
- B Wang
- D Niu
- T H Lam
- Z Xiao
- E C Ren
Corresponding author
Correspondence toE C Ren.
Ethics declarations
Competing interests
The authors declare no conflict of interest.
Additional information
Edited by H Steller
Supplementary Information accompanies this paper on Cell Death and Differentiation website
Supplementary information
Rights and permissions
About this article
Cite this article
Wang, B., Niu, D., Lam, T. et al. Mapping the p53 transcriptome universe using p53 natural polymorphs.Cell Death Differ 21, 521–532 (2014). https://doi.org/10.1038/cdd.2013.132
- Received: 20 May 2013
- Revised: 02 August 2013
- Accepted: 14 August 2013
- Published: 27 September 2013
- Issue Date: April 2014
- DOI: https://doi.org/10.1038/cdd.2013.132