Minocycline selectively inhibits M1 polarization of microglia (original) (raw)
Main
Amyotrophic lateral sclerosis (ALS) is an adult onset neurodegenerative disease specific to motor neurons. Both cell-autonomous and non-cell-autonomous mechanisms significantly contribute to the progression and the onset of disease according to the previous studies using ALS model mice.1, 2, 3, 4, 5, 6 Thus, not only motor neurons but also glial cells, including astrocytes and microglia, are involved in the pathogenesis. Although some agents have been proven effective for combating the pathogenesis of ALS in mice, the clinical trials have shown negative results, and no therapeutic agents of ALS have yet been developed.7
Microglia polarization is sometimes categorized into classical (M1) and alternative (M2) activation. Although this categorization might be an oversimplification, microglia can be polarized into an activation state that is intermediate between a neuro-harmful and a protective state. Lipopolysaccharide (LPS) is known as a representative M1 polarization inducer, and M1 microglia express proinflammatory molecules that include tumor necrosis factor-α (TNF-α), interleukin-1_β_ (IL-1_β_), interferon-γ (IFN-γ), and nitric oxide (NO) as well as cell surface markers, CD86 and CD68. On the other hand, IL-4 induces M2 polarization.8, 9, 10 M2 microglia express different molecules, such as IL-4, arignase1, Ym1, CD206, and IL-10, and show neuroprotective effects.8, 9, 11, 12 It has recently been reported that M2 microglia markers are transiently enhanced at the presymptomatic phase of ALS, whereas M1 microglia markers are gradually increased during the disease progression.13 However, the mechanisms regulating microglial polarity remain elusive.
Minocycline is one of the tetracycline antibiotics and can penetrate into the central nervous system. Presymptomatic administration of minocycline delays disease onset and progression in a mouse model of ALS via the inhibition of inflammation and glial activation.14, 15, 16, 17, 18 But, treatment with minocycline after the disease onset does not prolong the survival of individuals with ALS in either a mouse model or human clinical cases.19, 20 Nevertheless, minocycline is a commonly used, strong inhibitor of microglial activation. Thus, this drug is a useful tool to investigate the mechanisms underlying microglial polarization and the pathogeneses of many diseases accompanied by microglial activation.
Here, we demonstrate the selectivity of minocycline in the inhibition of microglial polarization in an ALS mouse model. Minocycline selectively inhibited the microglial polarization into M1, but not M2, both in vivo and in vitro.
Results
Minocycline administration delays the pathogenesis of ALS in a mouse model
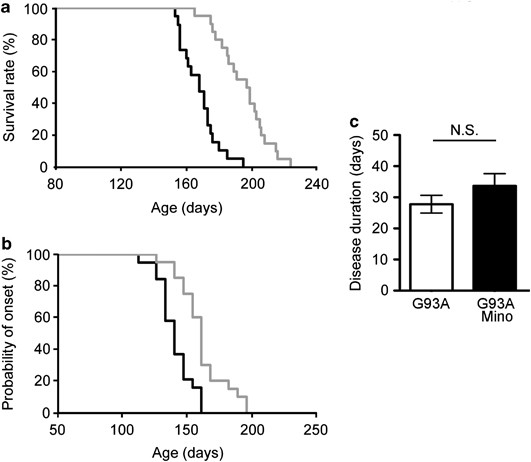
As it was previously reported that minocycline delayed the pathogenesis of ALS in a mouse model,15 we first examined the effect of minocycline in SOD1G93A mice, a mouse ALS model. Minocycline (33 mg/kg) was intraperitoneally administered five times a week from 8 weeks of age to the end stage. Lifespan was significantly prolonged by 26.9 days in mice receiving minocycline (control, 168.2±11.3 days versus minocycline, 195.1±15.5 days; Figure 1a). Disease onset determined by a decrease in rotarod performance at 15r.p.m. was delayed by 20.6 days (control, 140.4±13.1 days versus minocycline, 161.0±18.4 days; Figure 1b), whereas disease duration did not differ between the control and minocycline-treated groups (Figure 1c).
Figure 1
Minocycline treatment suppressed the disease in SOD1G93A mice. (a) The lifespan of SOD1G93A mice was 168.2±11.3 days (_n_=19) and that of minocycline-treated ones was 195.1±15.5 days (_n_=20; P<0.01). (b) The disease onset of SOD1G93A mice, as determined by a decrease in rotarod performance at 15 r.p.m., was 140.4±13.1 days. The disease onset of minocycline-treated mice was delayed to 161.0±18.4 days (P<0.01). (c) The disease duration of SOD1G93A mice, as determined by 15 r.p.m. rotarod performance, was 27.8±2.9 days. That of minocycline-treated SOD1G93A mice was 33.7±3.9 days. Black line, SOD1G93A mice; gray line, minocycline-treated SOD1G93A mice. Open column, SOD1G93A mice; closed column, minocycline-treated SOD1G93A mice. Error bars, S.E. NS, not significant
Minocycline attenuates microglial activation in the spinal cord
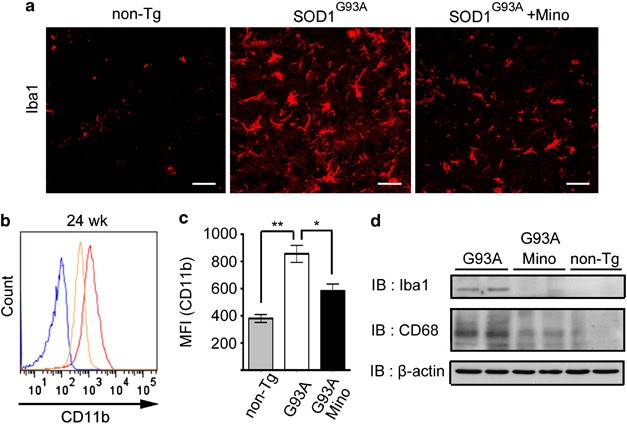
Immunohistochemical analysis was performed to examine the morphological changes of microglia at 24 weeks of age. Microglia showed ameboid shapes and increased in number in the spinal cord of SOD1G93A mice (Figure 2a). The size of microglial soma also became larger. Minocycline treatment reduced the number and soma size of microglia (Figure 2a). These data indicate that microglia were activated in SOD1G93A mice, and minocycline suppressed this activation. Microglial activation and deactivation in the spinal cord were confirmed by flow cytometry and western blotting. Thus, flow cytometry showed that the expression level of CD11b in individual microglia was increased in SOD1G93A mice, and was suppressed by minocycline administration (Figures 2b and c). Western blotting analysis demonstrated that the protein expressions of Iba1 and CD68 were increased in SOD1G93A mice, and diminished by minocycline administration (Figure 2d).
Figure 2
Minocycline inhibited microglial activation in SOD1G93A mice. (a) The spinal cords of non-Tg, SOD1G93A, and minocycline-treated SOD1G93A mice at 24 weeks (wk) were stained with anti-Iba1 antibody. Bars, 20 _μ_m. (b) A representative profile of CD11b expression at 24 wks. Blue line: non-Tg mice; red line: SOD1G93A mice; orange line: minocycline-treated SOD1G93A mice. (c) Quantitative data on the mean fluorescence intensity (MFI) of CD11b (_n_=3). Error bars, S.E. **P<0.01, *P<0.05. (d) Lumbar spinal cord lysates from non-Tg, SOD1G93A, and minocycline-treated SOD1G93A mice at 24 wks were subjected to western blotting against Iba1 and CD68 (_n_=2). _β_-Actin was used as the internal control
Minocycline diminishes the expression of M1, but not M2, markers
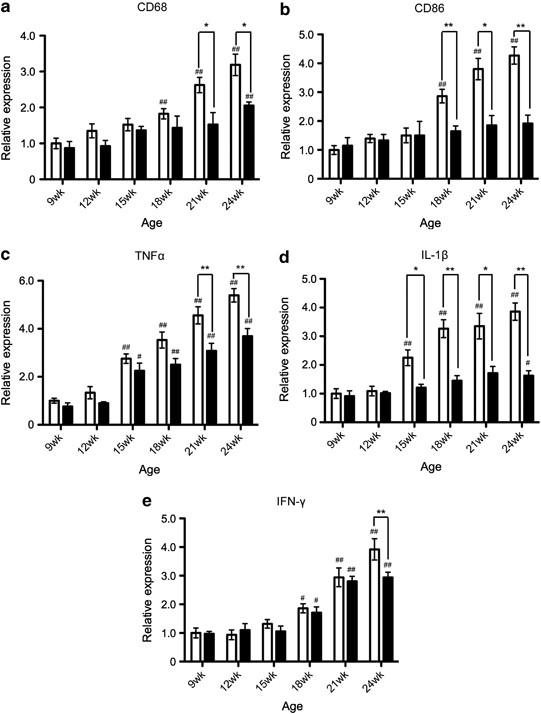
The expression of M1 markers was gradually increased as the disease progressed; significant differences compared with the values at 9 weeks of age were observed at 18 weeks to the end stage (24 weeks) in the expressions of CD68, CD86, and IFN-γ, and 15 weeks to the end stage in the expressions of TNF-α and IL-1_β_ in untreated SOD1G93A mice (Figures 3a–e). These increases were significantly attenuated by the treatment with minocycline (Figures 3a–e). Interestingly, the significant differences observed between the control and minocycline groups differed temporally depending on the markers; for example, IL-1_β_ showed a difference from 15 weeks to the end stage, whereas IFN-γ showed a difference at the end stage (Figures 3a–e). In contrast, the expression of M2 markers (CD206, arginase1, IL-4, IL-10, and Ym1) was transiently enhanced at the early phase (12–15 weeks), and this expression was not changed between the control and minocycline-treated groups (Figures 4a–e).
Figure 3
Minocycline inhibited the expression of M1 markers in the progressive disease phase. RNA was extracted from the lumbar spinal cords. The temporal mRNA expression profiles of M1 markers ((a) CD68, (b) CD86, (c) TNF-α, (d) IL-1_β_, and (e) IFN-γ) were examined by quantitative RT-PCR. Open columns, SOD1G93A mice (_n_=4); closed columns, minocycline-treated SOD1G93A mice (_n_=3). Error bars, S.E. **P<0.01, *P<0.05. #P<0.05, ##P<0.01 compared with 9 weeks mice
Figure 4
Minocycline did not affect the transient enhancement of M2 markers in early phase pathogenesis. RNA was extracted from the lumbar spinal cords. The temporal mRNA expression profiles of M2 markers ((a) CD206, (b) arginase1, (c) IL-4, (d) IL-10, and (e) Ym1) were examined by quantitative RT-PCR. Open columns, SOD1G93A mice (_n_=4); closed columns, minocycline-treated SOD1G93A mice (_n_=3). Error bars, S.E. All expression profiles were not significant in two-way ANOVA. #P<0.05, ##P<0.01 compared with 9 weeks mice
M1 marker CD86 is expressed in Iba1-positive microglia
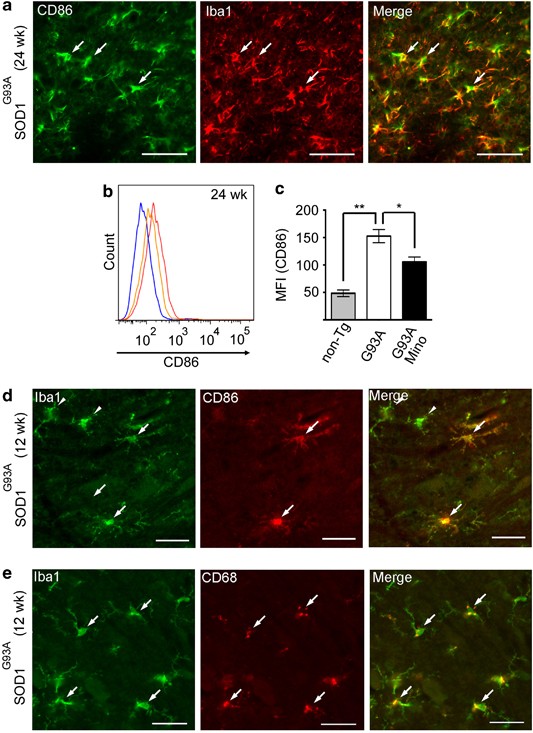
The selective effect of minocycline on M1 polarization prompted us to examine M1 marker expression in microglia during the pathogenesis of ALS in SOD1G93A mice. CD86 was expressed in a subpopulation of Iba1-positive cells in the lumbar spinal cord of SOD1G93A mice at 24 weeks (Figure 5a). Flow cytometric analysis for CD86 expression demonstrated that the fluorescence intensity was significantly increased in microglia in SOD1G93A mice, and that the augmented fluorescence intensity was decreased after the minocycline administration (Figures 5b and c). Furthermore, CD86 or CD68 expression was detected in a subpopulation of microglia in SOD1G93A mice as early as 12 weeks of age (Figures 5d and e).
Figure 5
CD86 and CD68 were expressed in a subpopulation of microglia. (a) The SOD1G93A mouse lumbar spinal cords at 24 weeks were stained with anti-CD86 (M1 marker) and anti-Iba1 (microglia marker). Bars, 50 _μ_m. Arrows indicate the co-localized cells. (b) A representative profile of CD86 expression in CD11b-positive cells at 24 weeks. Blue line: non-Tg mice; red line: SOD1G93A mice; orange line: minocycline-treated SOD1G93A mice. (c) Quantitative data of MFI of CD86 (_n_=3). Error bars, S.E. **P<0.01, *P<0.05. (d and e) The SOD1G93A mouse lumbar spinal cords at 12 weeks were stained with anti-CD86 or anti-CD68 and anti-Iba1. Bars, 50 _μ_m. Arrows indicate the co-localized cells, and arrow heads indicate the Iba1 single positive cells
In vitro expression of M1 markers induced by LPS is selectively inhibited by minocycline
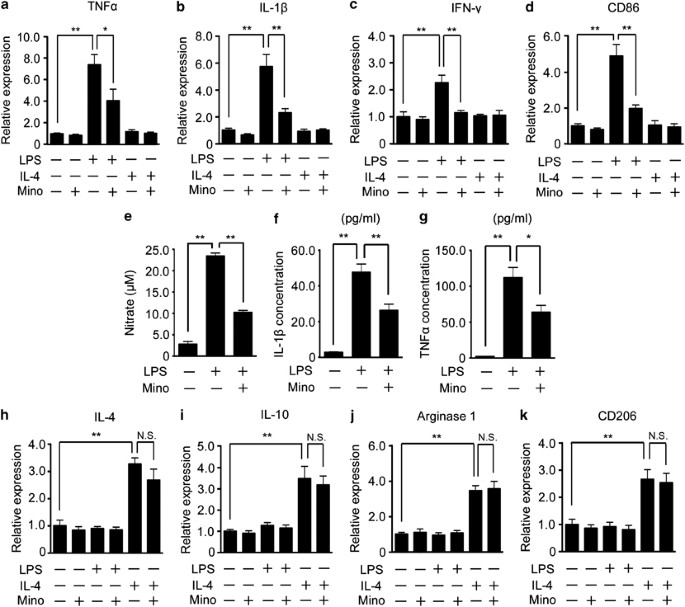
According to the temporal expression profile of M1 and M2 markers in vivo, we speculated that minocycline affected M1 polarization, but not M2 polarization. To address this hypothesis, we examined whether or not the expression of M1 markers induced by LPS was inhibited by the treatment with minocycline using the primary cultured microglia. The expression of M1 markers (TNF-α, IL-1_β_, IFN-γ, and CD86) was significantly upregulated by LPS, and attenuated by the co-treatment with minocycline (Figures 6a–d, third and fourth columns). The expression of M1 markers was not increased by the treatment with IL-4 (Figures 6a–d, fifth columns). Consistent with these mRNA expressions, the production of NO and the protein expression of the inflammatory cytokines (TNF-α and IL-β) were also upregulated by LPS, and these effects were significantly inhibited by minocycline (Figures 6e–g). In contrast, the expression of M2 markers (IL-4, IL-10, arginase1 and CD206) was significantly increased by IL-4 treatment, but the expression was not attenuated by the co-treatment with minocycline (Figures 6h–k, fifth and sixth columns).
Figure 6
Minocycline selectively inhibited the LPS-induced M1 polarization of microglia. Primary cultured microglia were treated with LPS, IL-4, minocycline, or a combination of these agents. The expressions of M1 (TNF-α (a), IL-1_β_ (b), IFN-γ (c), CD86 (d)) were examined by quantitative RT-PCR. (e) The concentration of nitric oxide induced by LPS in the culture medium was measured after the treatment with minocycline. The concentration of inflammatory cytokines (IL-1_β_ (f) and TNF-α (g)) induced by LPS was measured by ELISA and M2 (IL-4 (h), IL-10 (i), arginase1 (j), and CD206 (k)) markers were examined by quantitative RT-PCR. **P<0.01,*P<0.05. NS, not significant (_n_=5).
Minocycline inhibits the upregulation of NF-_κ_B expression in vivo and in vitro
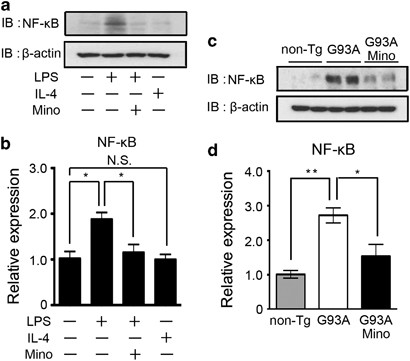
LPS stimulates the NF-_κ_B pathway.21, 22, 23 Activated NF-_κ_B upregulates the expression of inflammatory genes. To investigate the mechanism of minocycline action, we examined the LPS–NF-_κ_B axis. The NF-_κ_B expression was upregulated by LPS and inhibited by the co-treatment of minocycline in vitro (Figure 7a). The mRNA expression of NF-_κ_B in primary cultured microglia was also induced by LPS, and diminished by minocycline (Figure 7b). The NF-_κ_B protein and mRNA expressions were induced in the spinal cord of SOD1G93A mice, and were inhibited by minocycline treatment (Figure 7c and d).
Figure 7
The LPS-induced upregulation of NF-_κ_B was inhibited by the treatment with minocycline. (a) A representative image of western blotting. Primary cultured microglia were treated by LPS, IL-4, minocycline, or a combination of these agents. Whole-cell lysates were subjected to western blotting. _β_-Actin was used as the internal loading control. (b) The mRNA expression of NF-_κ_B was analyzed by quantitative RT-PCR in primary cultured microglia. The protein (c) and mRNA (d) expression of NF-_κ_B in the spinal cords of non-Tg, SOD1G93A, and minocycline-treated SOD1G93A mice at 24 weeks were analyzed by western blotting and quantitative RT-PCR, respectively
Discussion
We found that minocycline inhibited the expression of cell surface markers of M1-polarized microglia (CD86 and CD68) as well as the production of inflammatory cytokines (IL-1_β_, TNF-α, and IFN-γ) in vivo and in vitro (Figures 3 and 6). However, M2 marker expression was not affected. This is the first study to demonstrate the selectivity of the action of minocycline in a subpopulation of microglia.
Minocycline administration after disease onset does not prolong the survival of ALS mice, although presymptomatic treatment with minocycline is effective.19 As it is known that the M2 microglial response starts from 8-week-old of SOD1G93A mice,13 we wanted to see whether the antibiotic has any effects on M2 polarization in SOD1G93A mice. However, we found that minocycline administered after 8 weeks did not affect M2 marker expression (Figure 4), and exerted a potent suppressive effect on M1 marker expression, which began around 15–18 weeks (Figure 3). These data collectively suggest that the dormant M1 polarization may precede the enhanced expression of known M1 markers, which were used in this study, and minocycline may inhibit this polarization. Future analyses of the precise mechanism of minocycline action will reveal and distinguish mechanisms underlying two types of polarization, M1 and M2.
Our data suggest that minocycline may work in the early disease phase by suppressing the microglia activation polarized to M1, leading to the suppression of the pathogenesis of disease. However, minocycline could not completely inhibit the expression of M1 markers in vivo and in vitro (Figures 3 and 6). This insufficient inhibition may have caused the progression of ALS in a mouse model and human patients. On the other hand, we also found that minocycline did not affect the transient enhancement of M2 markers (IL-4, IL-10, arginase1, CD206, and Ym1) in vivo (Figure 4). Therefore, the combination of an M1 suppressor and an agent that could enhance or sustain M2 polarization after the disease onset could have potential for improving the survival of ALS patients.
It has been reported that minocycline partially suppresses the production of inflammatory molecules (IL-6, TNF-α, and IL-1_β_) induced by LPS in peripheral monocytes through inhibition of the nuclear translocation of NF-_κ_B.24 We found that the protein and mRNA expression of NF-_κ_B were affected by minocycline in microglia (Figure 7). The data were reproducible in LPS-induced microglia activation and in the ALS mouse model, suggesting that minocycline may inhibit not only the nuclear translocation but also transcription of NF-_κ_B. Interestingly, IL-4 treatment did not induce the upregulation of NF-_κ_B expression. These differences might have caused the different expression profiles of M1 and M2 markers by the treatment of minocycline in vivo and in vitro.
The G93A-mutated SOD1 protein activates microglia that mediate toxicity for motor neurons.25, 26 This activation can be blocked by neutralizing antibodies against CD14, TLR2, and TLR4.26 Thus, the G93A-mutated SOD1 protein induces microglial activation for toxicity via CD14 and TLR pathways in ALS pathogenesis. NF-_κ_B is downstream these pathways. Furthermore, the NF-_κ_B pathway is activated in ALS, and NF-_κ_B is a key transcription factor affected in spinal cord microglia in SOD1 mutant mice.27, 28 How minocyline is effective on M1 polarization in SOD1G93A spinal cords could be explained by its inhibitory effects on activation of TLR pathways induced by the mutated SOD1 in microglia.
Materials and Methods
Mice and minocycline administration
The animal experiments described in this article were performed in accordance with protocols approved by the institutional animal committee. All animals were treated and cared for in accordance with the Nagoya University School of Medicine Guidelines pertaining to the treatment of experimental animals. SOD1G93A transgenic mice, which carry the G93A mutant form of the human SOD1 (B6.Cg-Tg [SOD1-G93A] 1Gur/J line), were purchased from the Jackson Laboratory (Bar Harbor, ME, USA). The protocols for the maintenance and genotyping of these mice were described previously.29 **The transgenic mice were randomly divided into minocycline hydrochloride (Nichi-iko Pharmacceutical Co. Ltd., Toyama, Japan)-treated and untreated groups. Minocycline (33 mg/kg) was administered intraperitoneally five times a week from 8 weeks after birth to end stage.
Disease onset and lifespan experiments
Mice were observed daily for survival. An investigator who was blinded to the genotype of mice measured the body weight and motor performance. Both measurements were started at the age of 63 days, and the body weight of mice was measured for every 5 days. Testing of motor function using a Rotarod Treadmill for mice (MK-610A; Muromachi, Tokyo, Japan) was performed once a week. Each weekly session consisted of three trials on the constantly rotating setting at a speed of 15 r.p.m. The time remaining on the rotor during a 3-min period was recorded. Mice were judged to have failed the test when, on average in three separate trials, they fell off the rotarod before 2 min. The time of disease onset was determined by the time when mice began to fail the rotarod test. Lifespan was defined by the duration between birth and the end stage. Disease duration was defined by the duration between the onset and the end stage.
Immunohistochemistry
Mice were deeply anesthetized with diethylether and transcardially perfused with phosphate-buffered saline (PBS) followed by 4% paraformaldehyde in 0.1 M phosphate buffer (Wako,Osaka,Japan). Isolated lumbar spinal cords were fixed with 4% paraformaldehyde overnight, and cryoprotected by 20% sucrose in 0.1 M PBS at 4 °C over the subsequent night. The tissue samples were embedded in Tissue-Tek O.C.T. compound (Sakura Finetek, Torrance, CA, USA) and quickly frozen by liquid nitrogen. Frozen tissues were cut into 20 _μ_m sections on a cryostat (CM1800; Leica Instruments, Heidelberg, Germany) and collected on MAS-coated glass slides (Superfrost; Matsunami Glass, Osaka, Japan). The sections were washed in PBS. After blocking with 3% bovine serum albumin in PBS containing 0.1% Triton X-100 for 30 min at room temperature, the sections were incubated at 4 °C overnight with the following primary antibodies: rabbit anti-Iba1 (1 : 500; WAKO), rat anti-mouse CD86 (1 : 200; BD Biosciences, San Jose, CA, USA), and rat anti-mouse CD68 (1 : 100; AbD Serotec, Oxford, UK). After three rinses with PBS, the sections were incubated for 60 min at room temperature with the following secondary antibodies: Alexa Fluor 594-conjugated donkey anti-rat IgG (Invitrogen, Carlsbad, CA, USA) and Alexa Fluor 647-conjugated donkey anti-rabbit IgG (Invitrogen). Subsequently, the sections were rinsed in PBS, mounted with Fluorsave (Calbiochem, San Diego, CA, USA), and observed under a BZ-9000 fluorescence microscope (Keyence, Osaka, Japan).
Western blotting
Mice were deeply anesthetized with diethylether and perfused transcardially with PBS. Isolated lumbar spinal cords were lysed with lysis buffer (1% Triton X-100 and 1% protease inhibitor cocktail (Nacalai Tesque, Kyoto, Japan) in PBS) by sonication for 30 s at 4 °C. The homogenates were centrifuged at 20 000 × g for 10 min, and the concentration of the soluble proteins was measured by Bradford protein assay using a Protein Quantification Kit (Dojindo, Kumamoto, Japan). The soluble protein solutions were mixed with 4 × sample buffer (0.25 M Tris-HCl, 20% mercaptoethanol, 8% SDS, 20% sucrose, 0.008% bromophenol blue; pH 6.8) and boiled for 5 min. SDS-PAGE was performed in 6, 10, and 15% gels. After transferring the proteins to a polyvinylidene difluoride membrane (Hybond-P; GE Healthcare, Uppsala, Sweden) and blocking it with PBS-T containing 5% skim milk for 1 h at room temperature, the membranes were incubated with rabbit anti-Iba1 (1 : 1000; WAKO), rat anti-mouse CD68 (1 : 500; AbD Serotec), mouse anti-NF-_κ_B (1 : 1000; Cell Signaling Technology, Beverly, MA, USA), and mouse anti-_β_-actin (1 : 10 000; Sigma, St Louis, MO, USA). After wishing with 5% skim milk in PBS-T, the membranes were incubated with the HRP-conjugated secondary antibodies for 60 min at room temperature. Binding antibodies were visualized by using ECL and ECL Plus kits (GE Healthcare).
Flow cytometry
The spinal cords obtained from non-Tg, SOD1G93A, and minocycline-treated SOD1G93A mice at 24 weeks were dissociated with 5 mg/ml collagenase in HBSS at 37 °C for 45 min, and filtered by 70 μ_m cell strainers (Becton Dickinson, San Jose, CA, USA). Immune cells were separated by centrifugation using 38% Percoll in PBS at 2000 × g for 20 min. The immune cells were suspended with PBS containing 0.5% bovine serum albumin and 2 mM EDTA and incubated with CD11b affinity beads (Milteny Biotech GmbH, Bergisch Gladbach, Germany) at 4 °C for 15 min. Fc_γ receptors on CD11b-enriched cells were blocked by incubation with anti-CD16/CD32 antibody (1 : 400; BD Biosciences) at 4 °C for 15 min. Then, the cells were stained with Alexa 488-conjugated rat anti-mouse CD11b and PE-Cy 7 conjugated rat anti-mouse CD86 (2 _μ_g/sample; BD Biosciences) antibodies at 4 °C for 30 min. Data analysis was performed with FACS Canto II, FACSDiva (Becton Dickinson) and FlowJo (Tree Star, Ashland, OR, USA).
Quantitative RT-PCR
Total RNA was extracted from the lumbar spinal cords using an RNeasy Lipid Tissue kit (Qiagen, Valencia, CA, USA) according to the manufacturer’s recommendations. The cDNA was prepared from 1 _μ_g of total RNA by using a Transcriptor First Strand cDNA Synthesis Kit (Roche Diagnostics, Mannheim, Germany) following the standard protocols. Quantitative PCR was performed on a M × 3000P (Agilent Technologies, Santa Clara, CA, USA) using the synthetic primers and SYBR Green (Agilent Technologies). Samples were subjected to 40 cycles of amplification at 95 °C for 15 s and 60 °C for 1 min, after holding at 50 °C for 2 min and 95 °C for 10 min. Relative expression was calculated using the 2-(Ct experimental sample – Ct internal control sample (GAPDH)) method. The sequences of primers used are listed in Table 1.
Table 1 The primer sequences using quantitative RT-PCR of M1 and M2 markers
Primary culture
Primary cultured glial cells were prepared from the cortexes of postnatal day 1 wild-type mice. The brain cortexes were removed aseptically from the skulls and the meninges were excised carefully under a dissecting microscope. The cortexes were fully dissociated by pipetting and the small pieces of tissues were cultured in poly-L-lysine-coated flasks in Dulbecco’s modified Eagle medium (DMEM) supplemented with 10% fetal bovine serum and 1% Zell Shield (Minerva Biolabs, Berlin, Germany), then incubated at 37 °C in a humidified atmosphere containing 5% CO2. The culture media were changed every 7 days. The mixed glia cultured for 2 weeks was shaken at 120 r.p.m. on a gyratory shaker for 15 min at 37 °C. The floating cells were reseeded in the fresh PLL-coated dishes and cultured for the subsequent night. More than 95% of the attached cells were found to be Iba1-positive. The culture media were replaced with serum-free DMEM and stimulated with 100 ng/ml LPS (Sigma), 20 ng/ml IL-4 (Peprotech, Rocky Hill, NJ, USA), and 20 _μ_M minocycline for 24 h.
NO and cytokine assay
The NO assay was performed using the previously reported protocols. Briefly, 100 _μ_l of culture supernatants was mixed with the same volume of Griess assay regent (1% sulfanilamide (Sigma), 0.1% naphthylethylenediamine dihydrochloride, and 2.5% phosphoric acid). Ten minutes later, the 560-nm absorbance was measured by Multiskan JX (Thermo Labsystems, Helsinki, Finland). Sodium nitrate solution was used as the standard. The cytokines were measured using Quantkine ELISA kits (R&D Systems, Minneapolis, MN, USA) according to the manufacturer’s protocols.
Statistical analysis
The Kaplan–Meier method (log-rank test) was used for comparing the lifespan and disease onset of mice of each genotype. Mann–Whitney’s _U_-test was used for analyzing disease duration. Two-way ANOVA was used to evaluate the difference in the temporal expression profile of M1 and M2 markers between two groups. We subsequently performed an unpaired Student’s two-tailed _t_-test at each week. In all statistical analyses, a value of P<0.05 was considered to indicate significance. The statistical analysis was performed using SAS 9.3 (SAS Institute Inc., Cary, NS, USA) and SPSS (SPSS Inc., Chicago, IL, USA) software. The investigators performing the statistical analyses were blinded to the group assignments in all procedures.
Abbreviations
ALS:
Amyotrophic lateral sclerosis
DMEM:
Dulbecco’s modified Eagle medium
IL:
interleukin
LPS:
lipopolysaccharide
NO:
nitric oxide
PBS:
phosphate-buffered saline
SOD1:
superoxide dismutase 1
References
- Ince PG, Highley JR, Kirby J, Wharton SB, Takahashi H, Strong MJ et al. Molecular pathology and genetic advances in amyotrophic lateral sclerosis: an emerging molecular pathway and the significance of glial pathology. Acta Neuropathol 2011; 122: 657–671.
Article CAS PubMed Google Scholar - Clement AM, Nguyen MD, Roberts EA, Garcia ML, Boillée S, Rule M et al. Wild-type nonneuronal cells extend survival of SOD1 mutant motor neurons in ALS mice. Science 2003; 302: 113–117.
Article CAS Google Scholar - Di Giorgio FP, Carrasco MA, Siao MC, Maniatis T, Eggan K . Non-cell autonomous effect of glia on motor neurons in an embryonic stem cell-based ALS model. Nat Neurosci 2007; 10: 608–614.
Article CAS PubMed PubMed Central Google Scholar - Nagai M, Re DB, Nagata T, Chalazonitis A, Jessell TM, Wichterle H et al. Astrocytes expressing ALS-linked mutated SOD1 release factors selectively toxic to motor neurons. Nat Neurosci 2007; 10: 615–622.
Article CAS PubMed PubMed Central Google Scholar - Vargas MR, Pehar M, Cassina P, Martínez-Palma L, Thompson JA, Beckman JS et al. Fibroblast growth factor-1 induces heme oxygenase-1 via nuclear factor erythroid 2-related factor 2 (Nrf2) in spinal cord astrocytes: consequences for motor neuron survival. J Biol Chem 2005; 280: 25571–25579.
Article CAS PubMed Google Scholar - Boillée S, Vande Velde C, Cleveland DW . ALS: a disease of motor neurons and their nonneuronal neighbors. Neuron 2006; 52: 39–59.
Article PubMed Google Scholar - McGeer EG, McGeer PL . Pharmacologic approaches to the treatment of amyotrophic lateral sclerosis. BioDrugs 2005; 19: 31–37.
Article CAS PubMed Google Scholar - Liao B, Zhao W, Beers DR, Henkel JS, Appel SH . Transformation from a neuroprotective to a neurotoxic microglial phenotype in a mouse model of ALS. Exp Neurol 2012; 237: 147–152.
Article CAS PubMed PubMed Central Google Scholar - Kigerl KA, Gensel JC, Ankeny DP, Alexander JK, Donnelly DJ, Popovich PG et al. Identification of two distinct macrophage subsets with divergent effects causing either neurotoxicity or regeneration in the injured mouse spinal cord. J Neurosci 2009; 29: 13435–13444.
Article CAS PubMed PubMed Central Google Scholar - Meissner F, Molawi K, Zychlinsky A . Mutant superoxide dismutase 1-induced IL-1beta accelerates ALS pathogenesis. Proc Natl Acad Sci USA 2010; 107: 13046–13050.
Article CAS PubMed Google Scholar - David S, Kroner A . Repertoire of microglial and macrophage responses after spinal cord injury. Nat Rev Neurosci 2011; 12: 388–399.
Article CAS PubMed Google Scholar - Ponomarev ED, Maresz K, Tan Y, Dittel BN . CNS-derived interleukin-4 is essential for the regulation of autoimmune inflammation and induces a state of alternative activation in microglial cells. J Neurosci 2007; 27: 10714–10721.
Article CAS PubMed Google Scholar - Beers DR, Henkel JS, Zhao W, Wang J, Huang A, Wen S et al. Endogenous regulatory T lymphocytes ameliorate amyotrophic lateral sclerosis in mice and correlate with disease progression in patients with amyotrophic lateral sclerosis. Brain 2011; 134: 1293–1314.
Article PubMed PubMed Central Google Scholar - Kriz J, Nguyen MD, Julien JP . Minocycline slows disease progression in a mouse model of amyotrophic lateral sclerosis. Neurobiol Dis 2002; 10: 268–378.
Article CAS PubMed Google Scholar - Van Den Bosch L, Tilkin P, Lemmens G, Robberecht W . Minocycline delays disease onset and mortality in a transgenic model of ALS. Neuroreport 2002; 13: 1067–1070.
Article CAS PubMed Google Scholar - Zhu S, Stavrovskaya IG, Drozda M, Kim BY, Ona V, Li M et al. Minocycline inhibits cytochrome c release and delays progression of amyotrophic lateral sclerosis in mice. Nature 2002; 417: 74–78.
Article CAS PubMed Google Scholar - Kriz J, Gowing G, Julien JP . Efficient three-drug cocktail for disease induced by mutant superoxide dismutase. Ann Neurol 2003; 53: 429–436.
Article CAS PubMed Google Scholar - Zhang W, Narayanan M, Friedlander RM . Additive neuroprotective effects of minocycline with creatine in a mouse model of ALS. Ann Neurol 2003; 53: 267–270.
Article CAS PubMed Google Scholar - Keller AF, Gravel M, Kriz J . Treatment with minocycline after disease onset alters astrocyte reactivity and increases microgliosis in SOD1 mutant mice. Exp Neurol 2011; 228: 69–79.
Article CAS PubMed Google Scholar - Gordon PH, Moore DH, Miller RG, Florence JM, Verheijde JL, Doorish C et al. Efficacy of minocycline in patients with amyotrophic lateral sclerosis: a phase III randomised trial. Lancet Neurol 2007; 6: 1045–1053.
Article CAS PubMed Google Scholar - Li Q, Verma IM . NF-kappa B regulation in the immune system. Nat Rev Immunol 2002; 2: 725–734.
Article CAS PubMed Google Scholar - Kennedy MN, Mullen GE, Leifer CA, Lee C, Mazzoni A, Dileepan KN et al. A complex of soluble MD-2 and lipopolysaccharide serves as an activating ligand for Toll-like receptor 4. J Biol Chem 2004; 279: 34698–34704.
Article CAS PubMed Google Scholar - Akira S, Takeda K . Toll-like receptor signalling. Nat Rev Immunol 2004; 4: 499–511.
Article CAS PubMed Google Scholar - Pang T, Wang J, Benicky J, Saavedra JM . Minocycline ameliorates LPS-induced inflammation in human monocytes by novel mechanisms including LOX-1, Nur77 and LITAF inhibition. Biochim Biophys Acta 2012; 1820: 503–510.
Article CAS PubMed PubMed Central Google Scholar - Liu Y, Hao W, Dawson A, Liu S, Fassbender K . Expression of amyotrophic lateral sclerosis-linked SOD1 mutant increases the neurotoxic potential of microglia via TLR2. J Biol Chem 2009; 284: 3691–3699.
Article CAS PubMed Google Scholar - Zhao W, Beers DR, Henkel JS, Zhang W, Urushitani M, Julien JP et al. Extracellular mutant SOD1 induces microglial-mediated motoneuron injury. Glia 2010; 58: 231–243.
Article PubMed PubMed Central Google Scholar - Swarup V, Phaneuf D, Dupré N, Petri S, Strong M, Kriz J et al. Deregulation of TDP-43 in amyotrophic lateral sclerosis triggers nuclear factor _κ_B-mediated pathogenic pathways. J Exp Med 2011; 208: 2429–2447.
Article CAS PubMed PubMed Central Google Scholar - Butovsky O, Siddiqui S, Gabriely G, Lanser AJ, Dake B, Murugaiyan G et al. Modulating inflammatory monocytes with a unique microRNA gene signature ameliorates murine ALS. J Clin Invest 2012; 122: 3063–3087.
Article CAS PubMed PubMed Central Google Scholar - Takeuchi H, Mizoguchi H, Doi Y, Jin S, Noda M, Liang J et al. Blockade of gap junction hemichannel suppresses disease progression in mouse models of amyotrophic lateral sclerosis and Alzheimer’s disease. PLoS ONE 2011; 6: e21108.
Article CAS PubMed PubMed Central Google Scholar
Acknowledgements
This work was supported in part by Grants-in-Aid (Nos. 23110002 and 20390092 to KK; No. 22791370 to SI; and No. 23790360 to TO) from the Ministry of Education, Culture, Sports, Science, and Technology of Japan; by a Grant-in-Aid from the Ministry of Health, Labor, and Welfare of Japan (Health Science Research Grant on Comprehensive Research on Disability Health and Welfare, H21-012 to KK); and by funds from the Global COE program, MEXT, to Nagoya University.
Author contributions
KK, SI, TO, KH, KU, and KS performed the experiments. HT and AS provided animals and supervised the animal experiments. KK, SI, TO, KH, KU, KS, and AH performed the data analysis. KK, SI, TO, KH, NI, and KK designed the study. KK, SI, TO, and KK wrote the manuscript. All authors read and approved the final manuscript.
Author information
Author notes
- S Imagama and T Ohgomori: These authors contributed equally to this work.
Authors and Affiliations
- Department of Biochemistry, Nagoya University Graduate School of Medicine, Nagoya 466-8550, Japan,
K Kobayashi, T Ohgomori, K Uchimura, K Sakamoto & K Kadomatsu - Department of Orthopedics, Nagoya University Graduate School of Medicine, Nagoya 466-8550, Japan,
K Kobayashi, S Imagama, K Hirano & N Ishiguro - Center for Advanced Medicine and Clinical Research, Nagoya University Graduate School of Medicine, Nagoya 466-8550, Japan,
A Hirakawa - Department of Neuroimmunology, Research Institute of Environmental Medicine, Nagoya University, Nagoya 464-8601, Japan,
H Takeuchi & A Suzumura
Authors
- K Kobayashi
You can also search for this author inPubMed Google Scholar - S Imagama
You can also search for this author inPubMed Google Scholar - T Ohgomori
You can also search for this author inPubMed Google Scholar - K Hirano
You can also search for this author inPubMed Google Scholar - K Uchimura
You can also search for this author inPubMed Google Scholar - K Sakamoto
You can also search for this author inPubMed Google Scholar - A Hirakawa
You can also search for this author inPubMed Google Scholar - H Takeuchi
You can also search for this author inPubMed Google Scholar - A Suzumura
You can also search for this author inPubMed Google Scholar - N Ishiguro
You can also search for this author inPubMed Google Scholar - K Kadomatsu
You can also search for this author inPubMed Google Scholar
Corresponding author
Correspondence toK Kadomatsu.
Ethics declarations
Competing interests
The authors declare no conflict of interest.
Additional information
Edited by A Verkhratsky
Rights and permissions
This work is licensed under the Creative Commons Attribution-NonCommercial-Share Alike 3.0 Unported License. To view a copy of this license, visit http://creativecommons.org/licenses/by-nc-sa/3.0/
About this article
Cite this article
Kobayashi, K., Imagama, S., Ohgomori, T. et al. Minocycline selectively inhibits M1 polarization of microglia.Cell Death Dis 4, e525 (2013). https://doi.org/10.1038/cddis.2013.54
- Received: 07 December 2012
- Revised: 09 January 2013
- Accepted: 01 February 2013
- Published: 07 March 2013
- Issue Date: March 2013
- DOI: https://doi.org/10.1038/cddis.2013.54
