Galectin-1 stimulates motility of human umbilical cord blood-derived mesenchymal stem cells by downregulation of smad2/3-dependent collagen 3/5 and upregulation of NF-κB-dependent fibronectin/laminin 5 expression (original) (raw)
Main
Cell motility is regulated by a complex network of microenvironments and extracellular factors including carbohydrate-binding proteins.1 One of these carbohydrate-binding proteins is galectin (Gal) that has affinity for _β_-galactoside-containing glycoconjugates.2, 3 To date, 10 of the 15 mammalian members have been identified in humans,4 and all can be classified according to their carbohydrate recognition domains.2 Among them, Gal-1 is expressed by various stem cells, including embryonic, hematopoietic, neural, and keratinocyte stem cells3, 5, 6 and regulates various stem cell functions such as tumor promotion and differentiation.7 We and others have reported that Gal-1 is expressed on mouse embryonic stem cells (ESCs)/adult neural stem cells (NSC) and promotes their proliferation through its carbohydrate-binding ability.3, 8 In addition, Gal-1 is a critical factor in the function of mouse mesenchymal stromal cell-mediated tumor promotion and invasion.7 Until now, little research has been conducted on the function of Gal-1 in umbilical cord blood-derived mesenchymal stem cells (UCB-MSCs), although UCB-MSCs have reportedly more abundant expression of the Gal-1 gene (LGALS1) than the bone marrow-derived hMSCs.9
Recent studies clearly implicate the functional relevance of Gal-1 and extracellular matrix (ECM) proteins in mediating wound healing, motility, and adhesion.10 Interestingly, alterations in ECM protein expression play a contrasting role in stem cell function. Treating ESCs and MSCs with collagen-1 (COL-1), fibronectin (FN), and laminin-111 (LM-111) stimulates proliferation and migration.11, 12, 13, 14 In contrast, decreased COL-1 and LM-5 expression stimulates motility and differentiation and/or leads to programmed cell death through upregulation of matrix metalloproteinase (MMP) expression in fibroblasts and mammary epithelial cells.15, 16 In this regard, it is possible that Gal-1 stimulates UCB-MSC motility through up- or down-regulation of ECM protein expression. Yet, despite the absence of the role of Gal-1-related ECM proteins during stem cell functions for the current molecular cell biology paradigm, a number of independent experiments link ECM proteins to normal growth control, differentiation, and motility.10, 13, 16 In addition, ECM proteins are a downstream target of the key transcription factors NF-_κ_B (nuclear factor _κ_-light-chain-enhancer of activated B cells) and smad.17, 18 However, no evidence indicates a direct correlation between Gal-1-related ECM protein expression and motility alterations in human UCB-MSCs, although the function and regulation of ECM proteins has been investigated in various cell types including stem cells. Thus, it was considered important to clarify the Gal-1-related ECM protein responses when considering UCB-MSCs for regeneration strategies, and in particular we aimed to understand the molecular mechanisms involved in galactosidase-binding lectin-mediated MSC motility.
Human UCB-MSCs derived from cord blood after birth have self-renewal capacity and can differentiate into multiple cell types.19 Thus, human UCB-MSCs might be regarded as a versatile biological system, and their use has led to major advances in cell therapy and regeneration strategies in bone regeneration and spinal cord injury.20, 21 Gal-1 and ECM proteins have relevance to stabilize stem cell transplantation, regulate motility, and control differentiation.22, 23, 24 Although several clinical studies have detailed stem cell transplantation and/or therapeutic methods using Gal-1 and ECM proteins,23, 24 serious problems such as degeneration of scaffold protein, destruction of stem cell constituents, and alterations in stem cell functions may arise during transplantation and cell therapy.25 A prerequisite for effective clinical application is selecting high-quality input materials, as well as understanding the regulatory mechanisms mediating various processes such as motility. If we assume that exogenous Gal-1 regulates ECM proteins and improves subsequent motility, the downstream signaling mechanisms involved may present promising targets for stem cell therapy. Thus, determining how Gal-1 and signal transduction proteins function as an ensemble to regulate motility remains a major challenge. Therefore, we examined the involvement of ECM proteins in Gal-1-induced human UCB-MSC motility and its related signal pathways.
Results
Effect of Gal-1 on human UCB-MSC motility and ECM protein expression
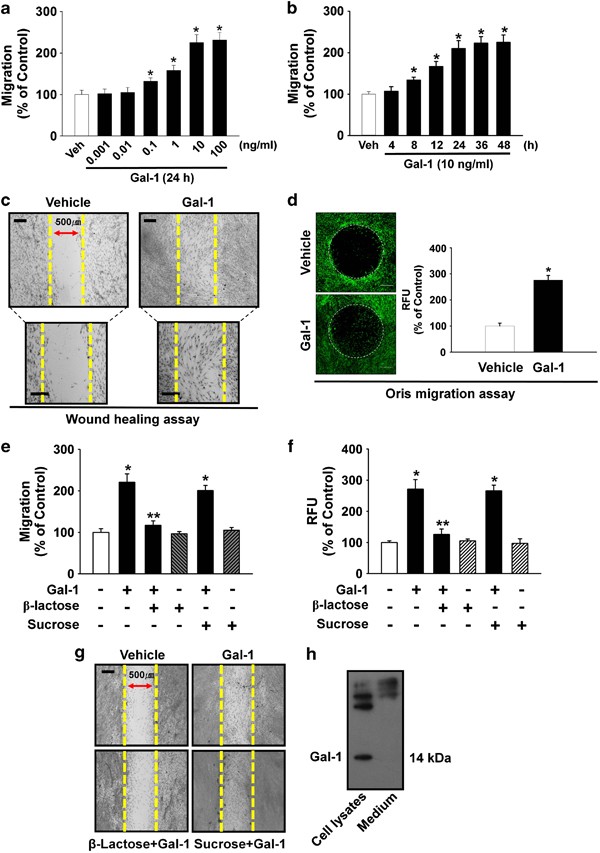
The cells were incubated with various concentrations (0–100 ng/ml) of Gal-1. As shown in Figure 1a, increasing the concentration of Gal-1 from 0.1 to 100 ng/ml induced cell motility in a dose-dependent manner. In addition, an increase in cell motility was observed after an 8-h incubation with 10 ng/ml Gal-1 (Figure 1b). We further explored the ability of 10 ng/ml Gal-1 to induce cell motility for 24 h using an in vitro wound healing migration assay and the Oris cell migration assay (Platypus Technologies, Madison, WI, USA). In contrast to the control, Gal-1 evoked substantial migration of cells into the denuded area (Figure 1c). These results were confirmed by increased motility of Gal-1-stimulated cells directly in the Oris cell migration assay (Figure 1d). In addition, Gal-1 (10 ng/ml) significantly induced the motility of human adipose-derived mesenchymal stem cells (AD-MSCs) (32% increase compared with the control; _P<_0.01), although the effect of Gal-1 in AD-MSC motility was lower than in UCB-MSCs (125% increase compared with the control; P<0.01) (Supplementary Data 1). These results suggest that the functional role of Gal-1 to induce the motility is reproducible in other types of MSCs.
Figure 1
The alternative text for this image may have been generated using AI.
Effects of Gal-1 on human UCB-MSC motility. Dose (a) and time (b) response of Gal-1 in a Boyden chamber motility assay. Cells were treated with different doses of Gal-1 (0–100 ng/ml) for 24 h or with 10 ng/ml Gal-1 for various times (0–48 h), and cells that had migrated to the lower surface of the filter were enumerated. A minimum of 100 cells was counted per sample. Values represent the mean±S.E. of five independent experiments with triplicate dishes. *P<0.05 versus vehicle. (c) In vitro human UCB-MSC wound healing migration assay in the absence and presence 10 ng/ml of Gal-1. Ten fields per plate were examined. Scale bars represent 100 _μ_m (magnification × 100) in top panel. Scale bars represent 100 _μ_m (magnification × 200) in bottom panel. (d) Oris cell motility assay. Cells were treated with Gal-1 (10 ng/ml) for 24 h and stained with calcein AM (green, left panel). Dot circles indicate analytical zone of a plate reader for quantification of fluorescence (_n_=3). Scale bars represent 200 _μ_m (magnification × 40). Fluorescence in the analytical zone was quantified with a plate reader (right panel). Data represent means±S.E. of five independent experiments with triplicate dishes. *P<0.05 versus vehicle. (e) The cells were pretreated with _β_-lactose (10 mM) or sucrose (10 mM; used as an osmolarity control) for 30 min before 10 ng/ml Gal-1 treatment for 24 h. Cells that had migrated to the lower surface of the filter were enumerated. A minimum of 100 cells were counted per sample. The values represent the mean±S.E. of four independent experiments with triplicate dishes. *P<0.05 versus control, **P<0.05 versus Gal-1 alone. (f) Oris cell motility assay. Cells were pretreated with _β_-lactose or sucrose for 30 min before 10 ng/ml Gal-1 treatment for 24 h and stained with calcein AM (5 _μ_M). Fluorescence in the analytical zone was quantified with a plate reader. Data represent means±S.E. of five independent experiments with triplicate dishes. *P<0.05 versus control, **P<0.05 versus Gal-1 alone. (g) In vitro human UCB-MSC wound healing motility assay. Ten fields per plate were examined. Scale bars represent 100 _μ_m (magnification × 100). (h) The cells were cultured in serum-free medium for 24 h, and then Gal-1 was detected from total cell lysates or cell culture medium by TCA precipitation and western blot analysis as described in the ‘Materials and Methods’. Each example shown is representative of five experiments. Gal-1, galectin-1; UCB-MSC, umbilical cord blood-derived mesenchymal stem cells; Veh, vehicle
To examine the specificity of Gal-1 in UCB-MSC motility, we tested whether Gal-3 could induce motility in UCB-MSCs. We found that Gal-3 also stimulated cell migration (48.3% above control; P<0.01), but it was less potent compared with Gal-1 (125% above control; P<0.01) (Supplementary Data 2). The cells were treated with Gal-1 either in the presence or absence of _β_-lactose (10 mM) or sucrose (10 mM; used as an osmolarity control) for 24 h to determine Gal-1 involvement in carbohydrate-binding activity. The Gal-1-induced increase in cell motility was attenuated by _β_-lactose (Figures 1e–g). In addition, the effect of intrinsic Gal-1 on cell motility was examined. As shown in Figure 1h, Gal-1 was expressed in human UCB-MSCs but was not detected in culture media. Knockdown of intrinsic Gal-1 with Gal-1 small interfering RNA (siRNA) significantly attenuated the motility of UCB-MSCs induced by Gal-1 treatment (59.7% decrease compared with the Gal-1 treatment; P<0.05) (Supplementary Data 3a and b). However, Gal-1 treatment did not enhance the level of intrinsic Gal-1 expression (Supplementary Data 3c). In addition, mitomycin C (1 _μ_g/ml), a cell cycle arrest compound, partially inhibited Gal-1-induced cell motility (Supplementary Data 4).
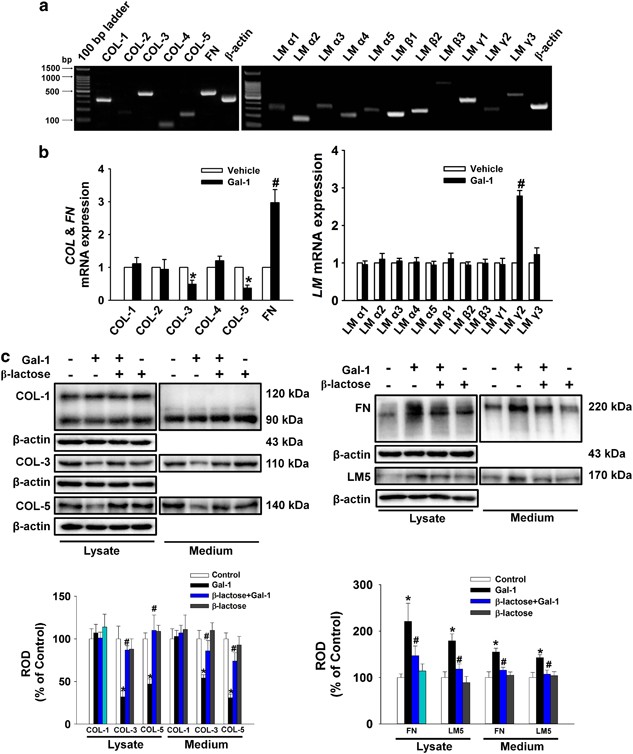
In experiments to determine the existence of ECM component types in human UCB-MSCs, we detected signals for amplicons of COL, FN, and LM mRNAs (Figure 2a). Gal-1 reduced COL3A1 (COL-3) and COL5A1 (COL-5) mRNA expression levels but increased FN1 (FN) and LAMC2 (LM-γ2) mRNA expression levels (Figure 2b). Consistent with these results, Gal-1 decreased the protein expression of COL-3 and COL-5 but increased FN and LM-5 in total lysates and medium, and this was reversed by _β_-lactose (Figure 2c). These results suggest that Gal-1 stimulation of human UCB-MSC motility may be mediated via regulation of ECM protein expression.
Figure 2
The alternative text for this image may have been generated using AI.
Effects of Gal-1 on ECM protein expression. (a) Total RNA from cells was reverse transcribed, and ECM cDNAs were amplified by PCR as described in the Materials and Methods. The example shown is representative of five independent experiments. (b) Cells were treated with 10 ng/ml Gal-1 for 12 h. The mRNA expression of ECM components was measured in cells using real-time PCR as described in the Materials and Methods. The data are reported as the mean±S.E. of four independent experiments, each conducted in triplicate. *P<0.05 versus vehicle. (c) The cells were pretreated with _β_-lactose (10 mM) for 30 min before 10 ng/ml Gal-1 treatment for 24 h. Total protein was extracted and blotted with COL-1, COL-3, COL-5, FN, and LM-5 antibody. Each example shown is representative of five independent experiments. The lower or right part of (c) depicting the bars denotes the mean±S.E. of five independent experiments for each condition determined by densitometry relative to _β_-actin. *P<0.05 versus control, #P<0.05 versus Gal-1 alone. COL, collagen; ECM, extracellular matrix; FN, fibronectin; LM, laminin; ROD, relative optical density
Effect of Gal-1 on protein kinase C (PKC) activation and c-Src dependent caveolin-1 (Cav-1) activation
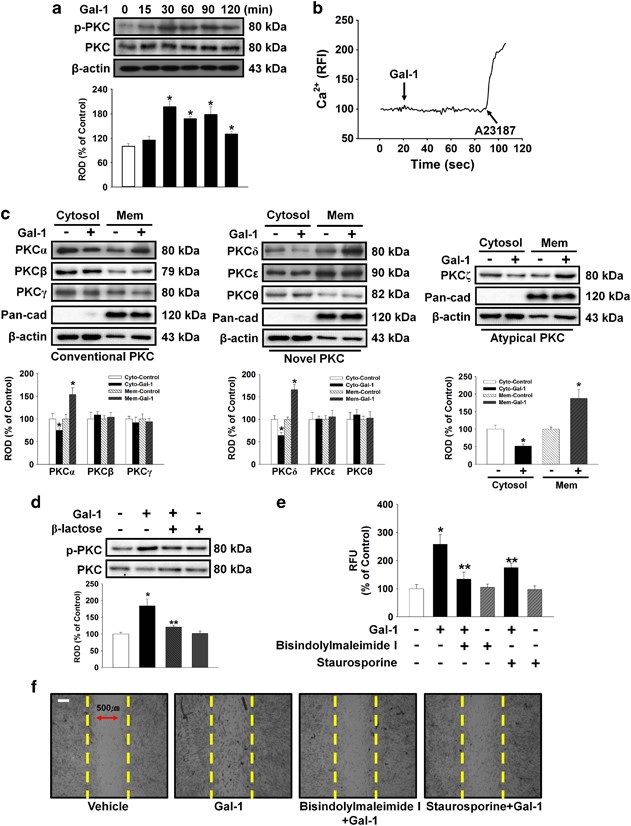
This experiment assessed whether Gal-1 induced phosphorylation and translocation of PKC in human UCB-MSCs to examine involvement of the PKC pathway in Gal-1-induced cell motility. Gal-1 increased PKC phosphorylation from 15 to 120 min (Figure 3a), but did not affect calcium influx (Figure 3b). In addition, translocation of PKC_α_, PKC_δ_, and PKC_ζ_ from the cytosol to the membrane compartment was observed after cells were treated with 10 ng/ml Gal-1 for 90 min (Figure 3c). _β_-Lactose reduced Gal-1-induced PKC phosphorylation (Figure 3d). To further elucidate the involvement of PKC in Gal-1-induced cell motility, the cells were pretreated with bisindolylmaleimide I and staurosporine before Gal-1 treatment. As shown in Figures 3e and f, bisindolylmaleimide I and staurosporine reduced the Gal-1-induced increase in cell motility.
Figure 3
The alternative text for this image may have been generated using AI.
Involvement of PKC phosphorylation and translocation. (a) The cells were incubated in the presence of Gal-1 (10 ng/ml) for varying periods of time (0–120 min) and then harvested. Total protein was extracted and blotted with phospho-PKC and total-PKC antibody. (b) The cells were incubated with 2 _μ_M Fluo-3/AM in serum-free medium for 40 min and treated with Gal-1 (10 ng/ml) and were then treated with A23187 (10 μ_M, Ca2+ ionophore). Gal-1 and A23187-induced Ca2+ influx was measured. Changes in [Ca2+]i were monitored by confocal microscopy, and data are expressed as relative fluorescence intensity (F/F0%, arbitrary unit). (c) The cells were stimulated with Gal-1 (10 ng/ml) for 90 min, and extracted cytosolic and membrane proteins were then detected with PKC translocation of PKC isoforms. Western blot analysis showed that Gal-1 induced the membrane translocation of PKC_α, δ, and ζ. (d) The cells were pretreated with _β_-lactose (10 mM) for 30 min before 10 ng/ml Gal-1 treatment for 90 min. Total protein was extracted and blotted with phospho- and total PKC antibody. (a, c, and d) Each example shown is representative of four independent experiments. The lower or right part of (a, c, and d) depicting the bars denote the mean±S.E. of four independent experiments for each condition determined by densitometry relative to _β_-actin or total-PKC. *P<0.05 versus control, **P<0.05 versus Gal-1 alone. (e) Oris cell motility assay. Cells were pretreated with 10 _μ_M bisindolylmaleimide I and 10 _μ_M staurosporine (PKC inhibitors) for 30 min before 10 ng/ml Gal-1 treatment for 24 h and stained with calcein AM (5 _μ_M). Fluorescence in the analytical zone was quantified with a plate reader. Data represent means±S.E. of five independent experiments with triplicate dishes. *P<0.05 versus control, **P<0.05 versus Gal-1 alone. (f) In vitro UCB-MSC wound healing motility assay. Ten fields per plate were examined. Scale bars represent 100 _μ_m (magnification × 100). Cytosol, cytosolic; Mem, membrane; PKC, protein kinase C; ROD, relative optical density
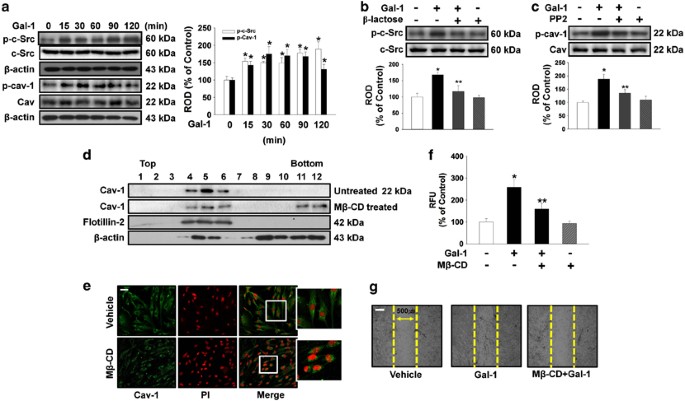
The effect of Gal-1 on phosphorylation of c-Src proteins, which are believed to be essential factors in Cav-1 activation, was examined to confirm the effect of Gal-1 on cell motility. Gal-1 increased phosphorylation of c-Src and Cav-1 from 15 to 120 min (Figure 4a) that was inhibited by _β_-lactose (Figure 4b). In addition, the c-Src inhibitor PP2 reduced Gal-1-induced phosphorylation of Cav-1 (Figure 4c). These results establish Gal-1 as an inducer of Cav-1 phosphorylation in human UCB-MSCs. As Cav-1 directly binds to cholesterol, the most important cofactor in caveolar morphogenesis, we first examined the effect of methyl-_β_-cyclodextrin (M_β_-CD, lipid raft disruptor) on caveolar structure to confirm the structural importance of membrane rafts in Cav-1-dependent signaling. Using discontinuous sucrose density gradient fractionation, we confirmed that the Cav-enriched membrane fraction (Figure 4d, fractions 4–6) decreased after treatment with 10 mM M_β_-CD for 1 h (Figure 4d). In addition, caveolar organization was disrupted when cholesterol was depleted from the membrane by means of M_β_-CD (Figure 4e). In addition, pretreatment with M_β_-CD significantly blocked the Gal-1-induced increase in cell motility (Figures 4f and g).
Figure 4
The alternative text for this image may have been generated using AI.
Involvement of c-Src and Cav-1 in effect of Gal-1. (a) The cells were incubated in the presence of Gal-1 (10 ng/ml) for varying periods of time (0–120 min) and the phosphorylation of c-Src and Cav-1 was detected by western blot analysis. (b) The cells were pretreated with _β_-lactose (10 mM) for 30 min before 10 ng/ml Gal-1 treatment for 90 min. Total protein was extracted and blotted with phospho-c-Src antibody. (c) The cells were pretreated with PP2 (10 _μ_M) for 30 min before 10 ng/ml Gal-1 treatment for 90 min. Total protein was extracted and blotted with phospho-Cav-1 antibody. (d) Lysates of untreated (control) or lipid raft disruptor 10 mM M_β_-CD-treated cells were subjected to discontinuous sucrose density gradient fractionation. Each fraction was assessed by western blot analysis. (a–d) Each example shown is representative of four independent experiments. The lower and right part of (a–c) depicting the bars denote the mean±S.E. of four independent experiments for each condition determined by densitometry relative to _β_-actin, c-Src, or Cav. *P<0.05 versus control, **P<0.05 versus Gal-1 alone. (e) Control and 10 mM M_β_-CD-treated cells were immunostained for Cav-1 (green), and each nucleus was stained with propidium iodide (red). Each example shown is representative of three experiments. Scale bars represent 100 _μ_m (magnification × 100). (f) Oris cell motility assay. Cells were pretreated with M_β_-CD (10 mM) for 30 min before 10 ng/ml Gal-1 treatment for 24 h and stained with calcein AM (5 _μ_M). Fluorescence in the analytical zone was quantified with a plate reader. Data represent means±S.E. of five independent experiments with triplicate dishes. *P<0.05 versus control or vehicle, **P<0.05 versus Gal-1 alone. (g) In vitro UCB-MSC wound healing motility assay. Ten fields per plate were examined. Scale bars represent 100 _μ_m (magnification × 100). Cav-1, caveolin-1; M_β_-CD, methyl-_β_-cyclodextrin; ROD, relative optical density
Effect of Gal-1 on smad2/3 and NF-_κ_B phosphorylation
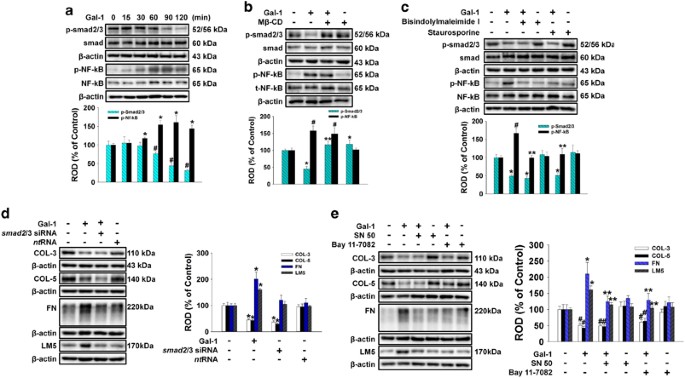
To examine the role of smad2/3 and NF-_κ_B in Gal-1-regulated ECM protein expression, we determined whether Gal-1 affected phosphorylation of smad2/3 and NF-_κ_B in human UCB-MSCs. As shown in Figure 5a, smad2/3 phosphorylation decreased from 60 to 120 min after 10 ng/ml Gal-1 treatment, but NF-_κ_B phosphorylation increased from 30 to 120 min. In addition, pretreatment with M_β_-CD significantly blocked Gal-1-reduced phosphorylation of smad2/3, but no effect was observed on NF-_κ_B phosphorylation (Figure 5b). In contrast, the PKC inhibitors bisindolylmaleimide and staurosporine inhibited Gal-1-induced phosphorylation of NF-_κ_B but did not affect smad2/3 phosphorylation (Figure 5c). To further elucidate the involvement of smad2/3 in Gal-1-related ECM component protein expression, cells were transfected with smad2/3 siRNA or nontargeting siRNA before Gal-1 treatment. Consistent with the effect of Gal-1, only Smad2/3 siRNA inhibited the expression of COL-3 and COL-5 (Figure 5d). In addition, the NF-_κ_B inhibitors SN 50 and bay 11-7082 inhibited Gal-1-induced FN and LM-5 expression but did not affect COL-3 or COL-5 expression (Figure 5e).
Figure 5
The alternative text for this image may have been generated using AI.
The smad2/3 and NF-_κ_B activation by Gal-1 regulated ECM protein expression. (a) The cells were incubated in the presence of Gal-1 (10 ng/ml) for varying periods of time (0–120 min) and phosphorylation of smad2/3 and NF-_κ_B was detected by western blot analysis. (b) The cells were pretreated with M_β_-CD (10 mM) for 30 min before 10 ng/ml Gal-1 treatment for 120 min. Total protein was extracted and blotted with phospho-smad2/3 and phospho-NF-_κ_B antibody. (c) The cells were pretreated with bisindolylmaleimide I (10 _μ_M) and staurosporine (10 _μ_M) for 30 min before 10 ng/ml Gal-1 treatment for 120 min. Total protein was extracted and blotted with phospho-smad2/3 and phospho-NF-_κ_B antibody. (d) The cells were pretreated with NF-_κ_B inhibitors SN 50 (500 ng/ml) and bay 11-7082 (10 _μ_M) for 30 min before 10 ng/ml Gal-1 treatment for 24 h. Total protein was extracted and blotted with COL-3, COL-5, FN, and LM-5 antibody. (e) Cells were transfected for 24 h with either _smad2/3-_specific siRNA (200 pmol/l) or non-targeting control siRNA (200 pmol/l) using Hyperfectamine or Gal-1 single treatment. Total protein was extracted and blotted with COL-3, COL-5, FN, and LM-5 antibody. (a–e) Each example shown is representative of five independent experiments. The lower and right part of (a–e) depicting the bars denote the mean±S.E. of five independent experiments for each condition determined by densitometry relative to _β_-actin. *,#P<0.05 versus control, **P<0.05 versus Gal-1 alone. NF-_κ_B, nuclear factor _κ_-light-chain-enhancer of activated B cells; ROD, relative optical density
Role of Gal-1-related COL-3, COL-5, FN, and LM-5 in human UCM-MSC motility
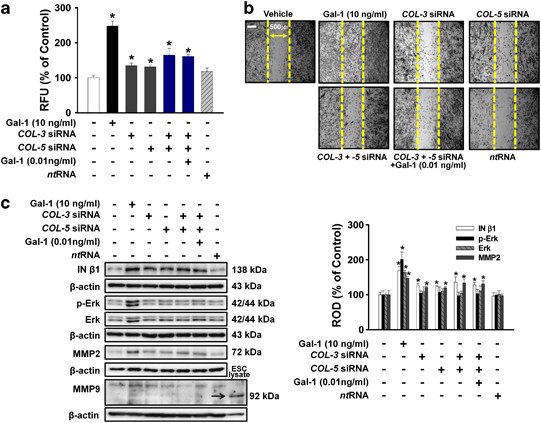
To investigate the involvement of COLs in Gal-1-mediated UCB-MSC motility, the cells were treated with Gal-1 (10 ng/ml), COL-3 siRNA_, COL-5_ siRNA, the combination of COL-3 and COL-5 siRNA, and the combination of COL-3, COL-5 siRNA, and Gal-1 (0.01 ng/ml). As shown in Figures 6a and b, all treatments increased cell motility. Notably, the combination of COL-3- and _COL-5-_specific siRNAs (65% increase compared with the control; P<0.05) increased cell motility more than COL-3 (34% increase compared with the control; P<0.05) or COL-5 (30% increase compared with the control; P<0.05) single siRNA treatment, and the combination of COL-3 and COL-5 siRNAs had a synergistic effect on cell motility (Figures 6a and b). In addition, treatment with Gal-1 (10 ng/ml), COL-3 siRNA, COL-5 siRNA, the combination of COL-3 and COL-5 siRNA, and the combination of COL-3, COL-5 siRNA, and Gal-1 (0.01 ng/ml) increased phosphorylation and/or expression of MMP2, and integrin (IN)-_β_1, but Gal-1 only increased Erk phosphorylation and expression. We could not detect MMP9 in human UCB-MSCs (Figure 6c).
Figure 6
The alternative text for this image may have been generated using AI.
Effects of Gal-1-reduced COL-3 and COL-5 on UCB-MSC motility. Cells were pretreated with COL-3 siRNA, COL-5 siRNA, combination of COL-3 and COL-5 siRNA, combination of COL-3, COL-5 siRNA, and Gal-1 (0.01 ng/ml), and nontargeting control siRNA for 30 min or 6 h before with or without Gal-1 (10 ng/ml) exposure for 24 h. (a) Oris cell motility assay. Fluorescence in the analytical zone was quantified with a plate reader. Data represent means±S.E. of five independent experiments with triplicate dishes. *P<0.05 versus control. (b) In vitro UCB-MSC wound healing motility assay. Ten fields per plate were examined. Scale bars represent 100 _μ_m (magnification × 100). (c) Cells were pretreated with COL-3 siRNA, COL-5 siRNA, combination of COL-3 and COL-5 siRNA, combination of COL-3 siRNA, COL-5 siRNA, and Gal-1 (0.01 ng/ml), and nontargeting control siRNA for 30 min or 6 h before with or without Gal-1 (10 ng/ml) for 24 h. Total protein was extracted and blotted with MMP2, MMP9, phospho-Erk, total-Erk, and IN-_β_1 antibody. ESC lysate is positive control of MMP9.59 The right part of (c) depicting the bars denotes the mean±S.E. of five independent experiments for each condition determined by densitometry relative to _β_-actin. *P<0.05 versus control. COL, collagen; MMP, matrix metalloproteinase; ROD, relative optical density
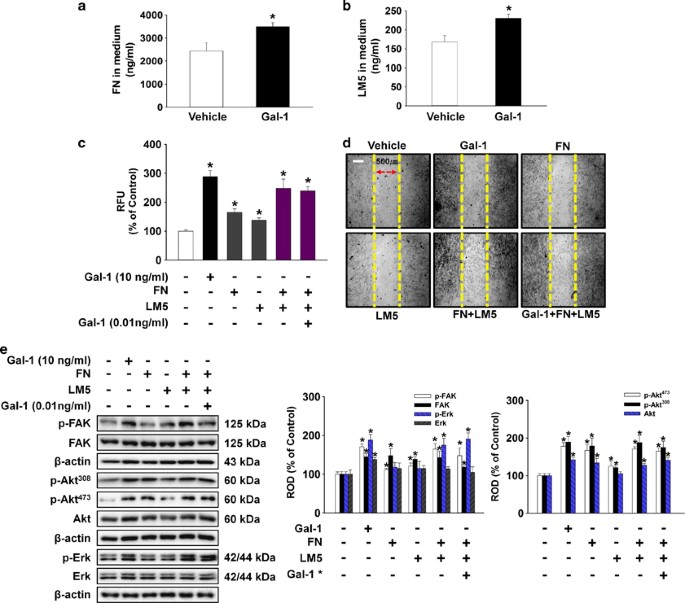
To examine the role of Gal-1-induced FN and LM-5 in cell motility, we assessed whether Gal-1-related FN and LM-5 was secreted into the medium. As shown in Figures 7a and b, Gal-1 stimulated FN (700 ng/ml increase compared with the control; P<0.05) and LM-5 (62.5 ng/ml increase compared with the control; P<0.05) production in medium. In addition, UCB-MSCs were treated with Gal-1 (10 ng/ml), FN (700 ng/ml), LM-5 (62.5 ng/ml), the combination of FN and LM-5, and the combination of FN, LM-5, and Gal-1 (0.01 ng/ml). As shown in Figures 7c and d, all treatment increased cell motility. One of the notable points was that the combination of FN and LM-5 (148% increase compared with the control; P<0.05) increased cell motility more than that of FN (65% increase compared with the control; P<0.05) or LM-5 (38% increase compared with the control; P<0.05) single treatment, and the combination of FN and LM-5 had synergistic effects on cell motility (Figures 7c and d). In addition, treatment with Gal-1 (10 ng/ml), FN (700 ng/ml), LM-5 (62.5 ng/ml), the combination of FN and LM-5, and the combination of FN, LM-5, and Gal-1 (0.01 ng/ml) increased phosphorylation and expression of FAK, Akt, and Erk (Figure 7e).
Figure 7
The alternative text for this image may have been generated using AI.
Effects of Gal-1-induced release of FN and LM-5 on UCB-MSC motility. (a and b) The cells were treated with 10 ng/ml Gal-1 for 24 h; FN and LM-5 production was then detected. Values represent means±S.E. of three independent experiments with triplicate dishes. *P<0.05 versus control. (c–e) Cells were treated with Gal-1 (10 ng/ml), FN (700 ng/ml), LM-5 (62.5 ng/ml), combination of FN and LM-5, and combination of FN, LM-5, and Gal-1 (0.01 ng/ml) for 24 h. (c) Oris cell motility assay. Fluorescence in the analytical zone was quantified with a plate reader. Data represent means±S.E. of five independent experiments with triplicate dishes. *P<0.05 versus control. (d) In vitro UCB-MSC wound healing motility assay. Ten fields per plate were examined. Scale bars represent 100 _μ_m (magnification × 100). (e) Total protein was extracted and blotted with phospho-FAK, FAK, phospho-Aktthr308, phospho-Aktser473, Akt, phospho-Erk, and Erk antibody. The right part of (e) depicting the bars denotes the mean±S.E. of five independent experiments for each condition determined by densitometry relative to _β_-actin. *P<0.05 versus control. Gal-1* indicates the 0.01 ng/ml concentration of Gal-1
Discussion
Our data demonstrate that Gal-1 stimulated motility that was mediated by downregulation of smad2/3-dependent COL-3/-5, and upregulation of NF-_κ_B-dependent FN/LM-5 expression via c-Src/Cav-1 and PKC in human UCB-MSCs. Thus, our findings suggest that Gal-1 may be considered a candidate agent for inducing cell motility in cell transplantation and cell therapy. Gal-1 has a broad variety of functions and regulates biological processes, including tumorigenesis, apoptosis, immune response, and determination of cell fate in stem cells.3, 8, 24, 26 In addition, Gal-1 has been shown to have an important role in enhancing expression of a more vasculogenic phenotype in MSCs.27 Similarly, the contributions of Gal-1 to the biologic behavior of stem cells are initiated by its binding specificity for _β_-galactoside-containing glycoconjugates2, 28 that in turn transduce the extracellular signals into intracellular molecules that perform physiological functions. We first showed that Gal-1 at ≥0.1 ng/ml significantly increased cell motility. In addition, 10 ng/ml Gal-1 maximally increased cell motility during a 24 h incubation period. Our previous report showed that Gal-1-induced motility was inhibited by _β_-lactose that blocks the interaction between Gal and glycans.3, 26 These findings strongly suggest that Gal-1 plays a pivotal role in stimulating cell motility via the _β_-galactoside carbohydrate structure.
In addition, Gal-1 was not detected in human UCB-MSC culture media, although human UCB-MSCs endogenously express Gal-1. Regarding the role of intrinsic intracellular Gal-1 in UCB-MSCs, the present results showed that cell motility was decreased by siRNA silencing of Gal-1 expression. Nonetheless, endogenous Gal-1 mRNA expression was not influenced by Gal-1 treatment, suggesting that intrinsic Gal-1 may independently contribute to UCB-MSCs motility at a post-translational level. These results are further supported by a previous study in which intracellular Gal-1 induced migration and invasion of glioblastoma multiforme cells.29 However, given that intrinsic Gal-1 can bind to a number of ECM components, such as laminin and fibronectin,28 it remains possible that in the present study, preferential binding of Gal-1 to ECM components interfered with our ability to detect the basal levels of any secreted forms of intrinsic Gal-1.
We and others have suggested that multiple signaling pathways such as activation of c-Src, Cav, and PKC are rapidly stimulated in target cells through Gal-1 membrane receptors and that these pathways have been linked to discrete or allied cellular actions of Gal-1.3, 30 Our results shed light on the potential role of c-Src-dependent Cav-1 activation in Gal-1-induced cell motility. Cav-1 has emerged as an important regulatory molecule in signal transduction.11, 31 It has been postulated that tyrosine phosphorylation of Cav-1 at residue 14 could confer subsequent growth-stimulatory or invasive activity that is induced by activated c-Src.3, 32, 33 c-Src is localized on the plasma membrane and is often associated with lipid rafts and SC motility.34, 35 In this study, Gal-1 led to phosphorylation of c-Src and Cav-1 that was decreased by _β_-lactose and PP2. In addition, Gal-1-induced increases in motility decreased by M_β_-CD. PKC phosphorylation and translocation increased in response to Gal-1 but did not affect intracellular Ca2+ concentration ([Ca2+]i), although our and other studies showed that Gal-1 triggers phosphorylation of phospholipase C3, 36 that produces inositol-1,4,5-triphosphate and increases [Ca2+]i in various cell types including stem cells.3, 37 This discrepancy in our results might because of differences in species, cell types, or experimental conditions. Nevertheless, our results indicated that inhibition of PKC pathways caused a decrease in Gal-1-induced motility. These observations suggest that Gal-1 induced c-Src-dependent Cav-1 phosphorylation and activated PKC, and that these signaling pathways played an important role in Gal-1-induced human UCB-MSC motility.
Previous studies have suggested that Gal-related signal molecules influence ECM proteins such as COL, FN, and LM, and regulate cell motility and attachment.38, 39 The present results show that Gal-1 reduced COL-3/-5 mRNA and protein levels but increased FN/LM-γ2 mRNA and FN/LM-5 protein expression that was reversed by _β_-lactose. Interestingly, alteration in Gal-1-related COL-3/-5, fibronectin, and LM-5 expression plays a contrasting role in various cells and tissues. Cancer cells secrete collagenase and then disassemble collagen molecules to induce invasion and metastasis.40 In contrast, collagen can inhibit cancer cells and fibroblast motility by inhibiting MMP secretion and expression in adjacent cells.16, 41 Thus, it is possible that Gal-1-reduced COL-3/-5 stimulates human UCB-MSC motility. Furthermore, Gal-1 increased FN protein, LM-_γ_2 mRNA, and LM-5 protein expression, the results supported by previous studies in which Gal-1-related FN/LM increased phosphorylation of epidermal growth factor receptor (EGFR) and src-dependent fibroblast growth factor receptor-1 (FGFR-1) via interaction of integrins, eventually leading to increased cell motility.42, 43 We observed coincident LM-_γ_2 and LM-5 expression. Processing of the LM-_γ_2 chain to the mature form decreases cell adhesion activity but increases cell migration and invasion activity of LM-5 in human cancer cells.44 These results suggest that the Gal-1-induced LM-_γ_2 may contain a functional domain that regulates cellular adhesion and migration as well as Gal-1-mediated induction of LM-5.
Different temporal patterns of Gal-1-related ECM protein expression are because of different signaling pathways related to transcription factor upstream molecules such as PKC, Cav, and transcription factors including smad2/3 and NF-_κ_B on ECM genes.17, 18, 45, 46, 47 Recent reports have suggested that Cav-dependent signaling inhibited smad2/3 phosphorylation, whereas PKC-dependent signaling stimulated NF-_κ_B phosphorylation involved in the regulation of ECM protein synthesis.45, 47 In the present study, Gal-1 decreased smad2/3 phosphorylation and increased NF-_κ_B phosphorylation that was reversed by inhibiting Cav-1 and PKC. In addition, inhibiting Cav-1 alone did not affect Gal-1-reduced smad2/3 phosphorylation, and inhibiting PKC alone did not influence Gal-1-induced NF-_κ_B phosphorylation. These results indicated that Cav-1 and PKC are parallel Gal-1-dependent signals for smad2/3 and NF-_κ_B. Furthermore, Gal-1 and smad2/3 siRNA inhibited COL-3 and COL-5 expression, and Gal-1-induced stimulation of FN and LM-5 expression was blocked by NF-_κ_B inhibitors. These results are supported by previous studies that activated Cav inhibits smad2/3 phosphorylation that is reduced by COL expression45, 48 and that NF-_κ_B activation has relevance to regulate ECM proteins such as FN and LM as well as motility.18, 45, 46 Therefore, our results strongly suggest that Cav-1-dependent smad2/3 dephosphorylation and PKC-dependent NF-_κ_B phosphorylation play an important role in Gal-1-reduced COL-3/-5 expression and Gal-1-induced FN/LM-5 expression in human UCB-MSCs.
Our results show a role for downregulation of COL-3/-5 and upregulation of FN/LM-5 in Gal-induced cell migration and its related signal molecules, suggesting that alterations in Gal-1-related COL, FN, and LM-5 expression regulate multiple signal transductions such as Erk, focal adhesion kinase (FAK), Akt, integrins, and MMPs, and then induce cell motility.43, 46, 49, 50, 51 We showed here that Gal-1, COL-3, and/or COL-5 siRNA treatment induced motility and increased MMP2 and IN-_β_1 expression in human UCB-MSCs. Interestingly, the combined treatment of COL-3/-5 siRNAs was more effective on motility and related protein expression than a single treatment of siRNAs, although treatment of human UCB-MSC with Gal-1 led to maximum increased motility and related protein expression. These results are supported by a previous study showing that ECM proteins have synergistic effects on cell motility11, 14 and that downregulation of COL-induced invasion in cancer cells through increased MMP and IN-_β_1 expression reduced E-cadherin expression.14, 52 In addition, we observed that treatment with Gal-1, FN, and/or LM-5 stimulated motility and then increased FAK, Akt, and Erk phosphorylation/expression. These results are further supported by other studies using embryonic stem cells and MSCs, suggesting that FN and LM-5 mediate the regulatory effects on various downstream targets via the FAK, Akt, PDGFR-β, and Erk signaling pathways.11, 13, 14
Collectively, our results suggest that Gal-1-reduced COL-3/-5 or Gal-1-induced FN/LM-5 stimulated other multiple signaling molecules that contributed to increase human UCB-MSC motility. Recent emerging evidence shows that neonatal lymphocytes are a major extracellular source of Gal-1 in UCB,53 indicating that UCB-MSC motility could be regulated by extracellular Gal-1 produced by neonatal lymphocytes in in vivo microenvironments. In conclusion, highlighting signaling pathways involved in Gal-1-stimulated human UCB-MSC motility provides potential targets for strategic modulation of stem cell motility in contexts where improved tropism or transmigration could improve therapeutic performance.
Materials and Methods
Materials
Human UCB-MSCs (hUCB-MSCs) were obtained from MEDIPOST Co. Ltd (Seoul, Korea). Mouse ESCs were obtained from American Type Culture Collection (ES-E14TG2a; Manassas, VA, USA). Human AD-MSCs were kindly provided by Professor Kyung-Sun Kang (Seoul National University, Seoul, Korea). Fetal bovine serum (FBS) was purchased from BioWhittaker Inc. (Walkersville, MO, USA). FN and LM-5 was purchased from Abcam (Cambridge, UK). Gal-1 was obtained from the R&D Systems (Minneapolis, MN, USA). A23187, PP2, methyl-β_-cyclodextrin, bisindolylmaleimide I, staurosporine, and mitomycin C were obtained from Sigma Chemical Company (St. Louis, MO, USA). β_-Actin, Akt, caveolin-1, collagen 1, collagen 3, collagen 5, c-Src, Erk, FAK, fibronectin, flotillin-2, galectin-1, integrin-β_1, laminin 5, laminA/C, NF-κ_B, MMP2, MMP9, pan-cadherin, phospho-Aktthr308, phospho-Aktser473, phospho-caveolin-1, phospho-c-Src, phospho-Erk, phospho-FAK, phospho-NF-κ_B (p65), PKC, PKC_α, PKC_β, PKC_γ, PKC_δ, PKC_ɛ, PKC_θ_, PKC_ζ_, and smad antibodies were purchased from Santa Cruz Biotechnology (Santa Cruz, CA, USA). Phospho-PKC and phospho-smad2/3 antibodies were purchased from Cell Signaling (Beverly, MA, USA). Horseradish peroxidase (HRP)-conjugated goat anti-rabbit and goat anti-mouse immunoglobulin G (IgG) were purchased from Jackson Immunoresearch (West Grove, PA, USA). All other reagents were of the highest purity commercially available and were used as received.
Culture of human UCB-MSCs
Human UCB-MSCs were cultured without a feeder layer in _α_-minimum essential medium (_α_-MEM; Thermo, Tewksbury, MA, USA), 1% penicillin, 1% streptomycin, and 10% FBS. For each experiment, cells were grown in 6- and 12-well plates, and in 35, 60, or 100-mm diameter culture dishes in an incubator maintained at 37°C with 5% CO2. The medium was replaced with serum-free _α_-MEM at least 24 h before experiments. Following incubation, the cells were washed twice with phosphate-buffered saline (PBS) and then maintained in a serum-free _α_-MEM including all supplements and indicated agents.
RNA isolation and reverse transcription-PCR (RT-PCR)
Total RNA was extracted from human UCB-MSCs using the RNeasy Plus Mini Kit (Qiagen, Valencia, CA, USA). RT was carried out with 3 _μ_g of RNA using a Maxime RT premix kit (iNtRON Biotechnology, Sungnam, Korea). The complementary DNA (cDNA; 5 _μ_l) for COL isotypes, LM isotypes, and FN cDNAs were amplified using the primers described in Supplementary Table 1.
Real-time PCR
The real-time quantification of COL isotypes, LM isotypes, and FN cDNAs was performed using a Rotor-Gene 6000 real-time thermal cycling system (Corbett Research, Mortlake, NSW, Australia) with a QuantiMix SYBR Kit (PhileKorea Technology, Daejeon, Korea), 20 _μ_l reaction mixture contained 200 ng cDNA, 0.5 _μ_M of each primer, enzymes, and fluorescent dyes. The data were collected during the extension step and analyzed using the manufacturer’s software. To verify the specificity and identity of PCR products, the amplification cycles were followed by a high-resolution melting cycle from 65 to 99°C at a rate of 0.1 °C/2 s. When the melting temperature (Tm) was reached, double-stranded DNA was denatured and the SYBR was released that caused a dramatic decrease in fluorescence intensity. The rate of this change was determined by plotting the derivative of the fluorescence relative to the temperature (dF/dT) versus temperature by data analysis software of the real-time PCR instrument. The temperature at which a peak occurred on the plot corresponded to the Tm of the DNA duplex. _β_-Actin was used as an endogenous control and a normalization control was used as a defined calibrator.
Boyden chamber migration assay
Gal-1-induced migration was measured by a modified Boyden chamber assay, using a 48-well micro-chemotaxis chamber (NeuroProbe, Baltimore, MD, USA) with 8 _μ_m pore size polycarbonate filters (Whatman Biometra, Gottingen, Germany) as described previously.54 The lower wells were filled with serum-free _α_-MEM and covered by the chemotaxis filter. The upper wells received 1 × 10⁴ cells and Gal-1 (0–100 ng/ml) in 50 ml _α_-MEM. After 24 h of incubation, the filter was carefully removed and nonmigrating cells on the upper side were eliminated by rinsing with cold PBS and scraping of the surface with a rubber wiper. Cells that had migrated into the solution on the lower side of the filter were fixed with 4% formaldehyde and stained with Giemsa. The number of migrating cells in control and stimulated wells was counted at × 100 magnification. Results were expressed as a percent of control, determined as the average number of migrated cells in stimulated wells divided by the average number of migrating cells in control wells.
Wound healing migration assay
Human UCB-MSCs were seeded at 4 × 10⁴ cells on low 35-mm dishes with culture inserts (Ibidi, Martinsried, Germany)35, 55 and incubated until the cell reached around 100% confluence in serum-containing medium. After serum starvation for 24 h, inserts were removed with sterile forceps to create a wound field of ∼500 _μ_m. The cells were incubated for an additional 24 h in Gal-1 (10 ng/ml) and visualized with an Olympus FluoView 300 confocal microscope (Melville, NY, USA) with × 400 objective.
Oirs cell migration assay
Human UCB-MSCs were seeded at 3 × 10² cells/100 _μ_l in Oirs well (Platypus Technologies) and incubated for 24 h to permit cell adhesion. Inserts were carefully removed when the cell reached around 70% confluence, and the wells were gently washed with culture medium. Cells were then incubated with gal-1 (10 ng/ml) and serum-free medium. Cell motility was observed microscopically after 24 h. Cell populations in end point assays were stained with 5 _μ_M calcein AM for 30 min. Migrated cells were quantified through measurement of fluorescence signals by using a microplate reader at excitation and emission wavelengths of 485 and 515 nm, respectively.56
Immunofluorescence microscopy
Human UCB-MSCs were plated onto coverslips (thickness: no 1, size: 18 mm) (Thermo Fisher Scientific, Rockford, IL, USA), serum starved for 24 h, and then treated for 1 h with lipid raft disruptor M_β_-CD (10 mM). Cells were fixed with 3.5% paraformaldehyde in PBS, permeabilized for 10 min with 0.1% (vol/vol) Triton X-100, and washed three times for 10 min each with PBS. Cells preincubated with 10% bovine serum albumin (BSA; Sigma-Aldrich, St. Louis, MO, USA) in PBS for 20 min to decrease nonspecific antibody binding were incubated for 60 min with a 1 : 100 dilution of primary antibody (anti-Cav-1 antibody) in a solution containing 1% (v/v) BSA in PBS, and washed three times for 10 min each with PBS. Cells were then incubated with 1% (v/v) BSA for 5 min, incubated for 60 min with anti-rabbit IgM-FITC (green) antibody, counterstained with propidium iodide (PI) in PBS containing 1% (v/v) BSA, and washed three times for 10 min each with PBS. Samples were mounted on slides and visualized with an Olympus FluoView 300 confocal microscope with × 400 objective.
siRNA transfection
Human UCB-MSCs were grown until 75% of the surface of the plate was covered, after which they were transfected for 24 h with either a siRNA specific for COL-3, COL-5, smad2/3 (200 pmol/l; GenePharma, Shanghai, China) or a non-targeting siRNA as a negative control (200 pmol/l; GenePharma) with Hyperfectamine (Qiagen) according to the manufacturer’s instructions. The sequences used are described in Supplementary Table 2, and determined each siRNA efficacy and effect of basal level, respectively (Supplementary Data 5).
Western blot analysis
Cells were harvested, washed twice with PBS, and lysed with buffer (20 mM Tris (pH 7.5), 1 mM ethylenediaminetetraacetic acid (EDTA), 1 mM ethylene glycol tetraacetic acid (EGTA), 1% Triton X-100, 1 mg/ml aprotinin, and 1 mM phenylmethylsulfonylfluoride (PMSF)) for 30 min on ice. The lysates were then cleared by centrifugation (22 250 × g at 4°C for 30 min). Protein concentration was determined by the Bradford method.57 Equal amounts of protein (20 _μ_g) were resolved by 10% sodium dodecyl sulfate polyacrylamide gel electrophoresis (SDS-PAGE) and transferred to a polyvinylidene fluoride (PVDF) membrane. The membranes were washed with Tris-buffered saline with Tween-20 (TBST) solution (10 mM Tris-HCl (pH 7.6), 150 mM NaCl, and 0.05% Tween-20), and blocked with 5% skimmed milk for 1 h. An appropriate primary antibody was incubated at 4°C overnight. The membrane was then washed and detected with a HRP-conjugated secondary antibody. The bands were visualized by enhanced chemiluminescence (Amersham Pharmacia Biotech Inc., Buckinghamshire, UK).
Enzyme-linked immunosorbent assay (ELISA) for FN and LM-5
Concentrations of FN and LM secreted in cell culture media were quantified by competitive inhibition ELISA using QuantiMatrix Human Fibronectin ELISA Kit and QuantiMatrix Human Laminin ELISA Kit (Chemicon International Inc., Temecula, CA, USA) according to the manufacturer’s instructions. The human UCB-MSC culture media were replaced with serum-free α-MEM at least 24 h before the assays, and the media supernatants were collected by centrifugation. A 100 _μ_l supernatant was loaded into a 96-well plate and read at 450 nm using spectrophotometer (Victor3; Perkin-Elmer, Waltham, MA, USA). Results were expressed as the mean concentration of triplicate cultures. Values were converted from absolute counts to a percentage of the control to allow for comparison between experimental groups.
TCA precipitation
Filtered culture supernatants were mixed with trichloroacetic acid (TCA) to a final concentration of 30% (w/v) and were incubated on ice for 30 min or stirred overnight at 4°C. Samples were centrifuged at 10 000 × g for 20 min. Pellets were washed with ice-cold 96% ethanol (v/v) and acetone and were air-dried.
Measurement of calcium influx
Changes in intracellular calcium concentrations were monitored using Fluo-3-AM that had initially been dissolved in dimethylsulfoxide (DMSO). Cells in 35 mm-diameter culture dished were rinsed with a Bath Solution (140 mM NaCl, 5 mM KCl, 1 mM CaCl2, 0.5 mM MgCl2, 10 mM glucose, 5.5 mM 4-(2-hydroxyethyl)-1-piperazineethanesulfonic acid (HEPES; pH 7.4)) and were then incubated in a Bath Solution containing 3 _μ_M Fluo-3-AM for 40 min, rinsed, mounted on a perfusion chamber, and scanned at 1 s intervals using Olympus FluoView 300 confocal microscope with × 300 objective. The fluorescence was produced by excitation at 488 nm and the emitted light was observed at 515 nm. All analyses of calcium influx were processed in a single cell, and the results were expressed as the fluorescent intensity (F/F0%, arbitrary unit, where F is fluorescence captured at a particular time and F0 is initial fluorescence image captured).
Subcellular fractionation
Harvested cell pellets were mixed with buffer 1 (250 mM sucrose, 50 mM Tris-HCl, 5 mM MgCl2) in the presence of protease inhibitor cocktail (PIERCE, Rockford, IL, USA) and incubated for 10 min on an end-over-end shaker and centrifuged at 1000 × g for 10 min. The supernatants with cytosolic protein were transferred to iced tubes. The pellet was suspended in buffer 2 (1 M sucrose, 50 mM Tris-HCl, 5 mM MgCl2) for 30 min and centrifuged at 6000 × g for 10 min and the supernatants containing membrane proteins were transferred to new tubes. The remaining pellet was suspended in buffer 3 (20 mM Tris-HCl, 0.4 M NaCl, 15% glycerol, 1.5% Triton X-100) with protease inhibitor cocktail and incubated for 10 min on an end-over-end shaker. After centrifugation at 6800 × g for 10 min, the supernatants was collected and designed as the nuclear proteins.
Detergent-free purification of caveolin-rich membrane fraction
Cav-enriched membrane fractions were prepared as described previously.58 Cells were washed twice with ice-cold PBS, scraped into 2 ml of 500 mM sodium carbonate (pH 11.0), transferred to a plastic tube, and homogenized with a Sonicator 250 apparatus (Branson Ultrasonic, Danbury, CT, USA) using three 20-s bursts. The homogenate was adjusted to 45% sucrose by the addition of 2 ml 90% sucrose prepared in 2-(N-morpholino) ethanesulfonic acid (MES)-buffered solution consisting of 25 mM MES-buffer solution (pH 6.5) and 0.15 M NaCl and placed at the bottom of an ultracentrifuge tube. A 5–35% discontinuous sucrose gradient was formed (4 ml each of 5 and 35% sucrose, both in MES-buffer solution containing 250 mM sodium carbonate) and centrifuged at 40 000 × g for 20 h in a Beckman SW41 Rotor (Beckman Coulter, Fullerton, CA, USA). Twelve fractions were collected and analyzed by 12% SDS-PAGE.
Statistical analysis
Results are expressed as means±S.E. All experiments were analyzed by ANOVA, followed in some cases by a comparison of treatment means with the control using the Bonferroni–Dunn test. Differences were considered statistically significant at P<0.05.
Abbreviations
Cav:
caveolin
cDNA:
complementary DNA
COL:
collagen
ECM:
extracellular matrix
EDTA:
ethylenediaminetetraacetic acid
EGFR:
epidermal growth factor receptor
EGTA:
ethylene glycol tetraacetic acid
ESC:
embryonic stem cell
FAK:
focal adhesion kinase
FBS:
fetal bovine serum
FGFR:
fibroblast growth factor receptor
FITC:
fluorescein isothiocyanate
FN:
fibronectin
Gal:
galectin
HEPES:
4-(2-hydroxyethyl)-1-piperazineethanesulfonic acid
Ig:
immunoglobulin
IN:
integrin
LM:
laminin
_α_-MEM:
_α_-minimum essential medium
M_β_-CD:
methyl-_β_-cyclodextrin
MMP:
matrix metalloproteinase
NF-_κ_B:
nuclear factor _κ_-light-chain-enhancer of activated B cells
NSC:
neural stem cell
Pan-cad:
pan-cadherin
PBS:
phosphate-buffered saline
PDGFR:
platelet-derived growth factor receptor
PI:
propidium iodide
PKC:
protein kinase C
PVDF:
polyvinylidene fluoride
RT-PCR:
reverse transcription-PCR
SDS-PAGE:
sodium dodecyl sulfate-polyacrylamide gel electrophoresis
siRNA:
small interfering RNA
TBST:
Tris-buffered saline with Tween-20
TCA:
trichloroacetic acid
Tm:
melting temperature
UCB-MSC:
umbilical cord blood-derived mesenchymal stem cell
References
- Comte I, Kim Y, Young CC, van der Harg JM, Hockberger P, Bolam PJ et al. Galectin-3 maintains cell motility from the subventricular zone to the olfactory bulb. J Cell Sci 2011; 124: 2438–2447.
Article CAS Google Scholar - Barondes SH, Castronovo V, Cooper DN, Cummings RD, Drickamer K, Feizi T et al. Galectins: a family of animal beta-galactoside-binding lectins. Cell 1994; 76: 597–598.
Article CAS Google Scholar - Lee MY, Lee SH, Park JH, Han HJ . Interaction of galectin-1 with caveolae induces mouse embryonic stem cell proliferation through the Src, ERas, Akt and mTOR signaling pathways. Cell Mol Life Sci 2009; 66: 1467–1478.
Article CAS Google Scholar - Liu FT, Rabinovich GA . Galectins as modulators of tumour progression. Nat Rev Cancer 2005; 5: 29–41.
Article CAS Google Scholar - Chovanec M, Smetana K Jr, Dvorankova B, Plzakova Z, Andre S, Gabius HJ . Decrease of nuclear reactivity to growth-regulatory galectin-1 in senescent human keratinocytes and detection of non-uniform staining profile alterations upon prolonged culture for galectin-1 and -3. Anat Histol Embryol 2004; 33: 348–354.
Article CAS Google Scholar - Silva WA Jr, Covas DT, Panepucci RA, Proto-Siqueira R, Siufi JL, Zanette DL et al. The profile of gene expression of human marrow mesenchymal stem cells. Stem Cells 2003; 21: 661–669.
Article CAS Google Scholar - Szebeni GJ, Kriston-Pal E, Blazso P, Katona RL, Novak J, Szabo E et al. Identification of galectin-1 as a critical factor in function of mouse mesenchymal stromal cell-mediated tumor promotion. PLoS One 2012; 7: e41372.
Article CAS Google Scholar - Sakaguchi M, Shingo T, Shimazaki T, Okano HJ, Shiwa M, Ishibashi S et al. A carbohydrate-binding protein, Galectin-1, promotes proliferation of adult neural stem cells. Proc Natl Acad Sci USA 2006; 103: 7112–7117.
Article CAS Google Scholar - Panepucci RA, Siufi JL, Silva WA Jr, Proto-Siquiera R, Neder L, Orellana M et al. Comparison of gene expression of umbilical cord vein and bone marrow-derived mesenchymal stem cells. Stem Cells 2004; 22: 1263–1278.
Article CAS Google Scholar - Dvorankova B, Szabo P, Lacina L, Gal P, Uhrova J, Zima T et al. Human galectins induce conversion of dermal fibroblasts into myofibroblasts and production of extracellular matrix: potential application in tissue engineering and wound repair. Cells Tissues Organs 2011; 194: 469–480.
Article CAS Google Scholar - Park JH, Ryu JM, Yun SP, Kim MO, Han HJ . Fibronectin stimulates migration through lipid raft dependent NHE-1 activation in mouse embryonic stem cells: involvement of RhoA, Ca2+/CaM, and ERK. Biochim Biophys Acta 2012; 1820: 1618–1627.
Article CAS Google Scholar - Suh HN, Han HJ . Collagen I regulates the self-renewal of mouse embryonic stem cells through alpha2beta1 integrin- and DDR1-dependent Bmi-1. J Cell Physiol 2011; 226: 3422–3432.
Article CAS Google Scholar - Suh HN, Kim MO, Han HJ . Laminin-111 stimulates proliferation of mouse embryonic stem cells through a reduction of gap junctional intercellular communication via RhoA-mediated Cx43 phosphorylation and dissociation of Cx43/ZO-1/drebrin complex. Stem Cells Dev 2012; 21: 2058–2070.
Article CAS Google Scholar - Veevers-Lowe J, Ball SG, Shuttleworth A, Kielty CM . Mesenchymal stem cell migration is regulated by fibronectin through α5β1-integrin-mediated activation of PDGFR-β and potentiation of growth factor signals. J Cell Sci 2011; 124: 1288–1300.
Article CAS Google Scholar - Gilles C, Polette M, Coraux C, Tournier JM, Meneguzzi G, Munaut C et al. Contribution of MT1-MMP and of human laminin-5 γ2 chain degradation to mammary epithelial cell migration. J Cell Sci 2001; 114: 2967–2976.
CAS PubMed PubMed Central Google Scholar - Siwik DA, Chang DL, Colucci WS . Interleukin-1β and tumor necrosis factor-α decrease collagen synthesis and increase matrix metalloproteinase activity in cardiac fibroblasts in vitro. Circ Res 2000; 86: 1259–1265.
Article CAS Google Scholar - Ghosh AK, Yuan W, Mori Y, Varga J . Smad-dependent stimulation of type I collagen gene expression in human skin fibroblasts by TGF-β involves functional cooperation with p300/CBP transcriptional coactivators. Oncogene 2000; 19: 3546–3555.
Article CAS Google Scholar - Lee BH, Park SY, Kang KB, Park RW, Kim IS . NF-κB activates fibronectin gene expression in rat hepatocytes. Biochem Biophys Res Commun 2002; 297: 1218–1224.
Article CAS Google Scholar - Zeddou M, Briquet A, Relic B, Josse C, Malaise MG, Gothot A et al. The umbilical cord matrix is a better source of mesenchymal stem cells (MSC) than the umbilical cord blood. Cell Biol Int 2010; 34: 693–701.
Article Google Scholar - Sensebe L, Krampera M, Schrezenmeier H, Bourin P, Giordano R . Mesenchymal stem cells for clinical application. Vox Sang 2010; 98: 93–107.
Article CAS Google Scholar - Wakitani S, Nawata M, Tensho K, Okabe T, Machida H, Ohgushi H . Repair of articular cartilage defects in the patello-femoral joint with autologous bone marrow mesenchymal cell transplantation: three case reports involving nine defects in five knees. J Tissue Eng Regen Med 2007; 1: 74–79.
Article Google Scholar - Chai C, Leong KW . Biomaterials approach to expand and direct differentiation of stem cells. Mol Ther 2007; 15: 467–480.
Article CAS Google Scholar - Guan J, Zhu Z, Zhao RC, Xiao Z, Wu C, Han Q et al. Transplantation of human mesenchymal stem cells loaded on collagen scaffolds for the treatment of traumatic brain injury in rats. Biomaterials 2013; 34: 5937–5946.
Article CAS Google Scholar - Yamane J, Ishibashi S, Sakaguchi M, Kuroiwa T, Kanemura Y, Nakamura M et al. Transplantation of human neural stem/progenitor cells overexpressing galectin-1 improves functional recovery from focal brain ischemia in the Mongolian gerbil. Mol Brain 2011; 4: 35.
Article CAS Google Scholar - Tate CC, Shear DA, Tate MC, Archer DR, Stein DG, LaPlaca MC . Laminin and fibronectin scaffolds enhance neural stem cell transplantation into the injured brain. J Tissue Eng Regen Med 2009; 3: 208–217.
Article CAS Google Scholar - Lee MY, Han HJ . Galectin-1 upregulates glucose transporter-1 expression level via protein kinase C, phosphoinositol-3 kinase, and mammalian target of rapamycin pathways in mouse embryonic stem cells. Int J Biochem Cell Biol 2008; 40: 2421–2430.
Article CAS Google Scholar - Burns JS, Kristiansen M, Kristensen LP, Larsen KH, Nielsen MO, Christiansen H et al. Decellularized matrix from tumorigenic human mesenchymal stem cells promotes neovascularization with galectin-1 dependent endothelial interaction. PLoS One 2011; 6: e21888.
Article CAS Google Scholar - Camby I, Le Mercier M, Lefranc F, Kiss R . Galectin-1: a small protein with major functions. Glycobiology 2006; 16: 137R–157R.
Article CAS Google Scholar - Jung TY, Jung S, Ryu HH, Jeong YI, Jin YH, Jin SG et al. Role of galectin-1 in migration and invasion of human glioblastoma multiforme cell lines. J Neurosurg 2008; 109: 273–284.
Article CAS Google Scholar - Elola MT, Chiesa ME, Alberti AF, Mordoh J, Fink NE . Galectin-1 receptors in different cell types. J Biomed Sci 2005; 12: 13–29.
Article CAS Google Scholar - Meyer C, Liu Y, Kaul A, Peipe I, Dooley S . Caveolin-1 abrogates TGF-β mediated hepatocyte apoptosis. Cell Death Dis 2013; 4: e466.
Article CAS Google Scholar - Chen Z, Bakhshi FR, Shajahan AN, Sharma T, Mao M, Trane A et al. Nitric oxide-dependent Src activation and resultant caveolin-1 phosphorylation promote eNOS/caveolin-1 binding and eNOS inhibition. Mol Biol Cell 2012; 23: 1388–1398.
Article CAS Google Scholar - Lee H, Volonte D, Galbiati F, Iyengar P, Lublin DM, Bregman DB et al. Constitutive and growth factor-regulated phosphorylation of caveolin-1 occurs at the same site (Tyr-14) in vivo: identification of a c-Src/Cav-1/Grb7 signaling cassette. Mol Endocrinol 2000; 14: 1750–1775.
Article CAS Google Scholar - Su B, Gao L, Meng F, Guo LW, Rothschild J, Gelman IH . Adhesion-mediated cytoskeletal remodeling is controlled by the direct scaffolding of Src from FAK complexes to lipid rafts by SSeCKS/AKAP12. Oncogene 2013; 32: 2016–2026.
Article CAS Google Scholar - Yun SP, Ryu JM, Kim MO, Park JH, Han HJ . Rapid actions of plasma membrane estrogen receptors regulate motility of mouse embryonic stem cells through a profilin-1/cofilin-1-directed kinase signaling pathway. Mol Endocrinol 2012; 26: 1291–1303.
Article CAS Google Scholar - Walzel H, Schulz U, Neels P, Brock J . Galectin-1, a natural ligand for the receptor-type protein tyrosine phosphatase CD45. Immunol Lett 1999; 67: 193–202.
Article CAS Google Scholar - Vespa GN, Lewis LA, Kozak KR, Moran M, Nguyen JT, Baum LG et al. Galectin-1 specifically modulates TCR signals to enhance TCR apoptosis but inhibit IL-2 production and proliferation. J Immunol 1999; 162: 799–806.
CAS PubMed Google Scholar - Margadant C, van den Bout I, van Boxtel AL, Thijssen VL, Sonnenberg A . Epigenetic regulation of galectin-3 expression by beta1 integrins promotes cell adhesion and migration. J Biol Chem 2012; 287: 44684–44693.
Article CAS Google Scholar - Horiguchi N, Arimoto K, Mizutani A, Endo-Ichikawa Y, Nakada H, Taketani S . Galectin-1 induces cell adhesion to the extracellular matrix and apoptosis of non-adherent human colon cancer Colo201 cells. J Biochem 2003; 134: 869–874.
Article CAS Google Scholar - Turpeenniemi-Hujanen T, Thorgeirsson UP, Hart IR, Grant SS, Liotta LA . Expression of collagenase IV (basement membrane collagenase) activity in murine tumor cell hybrids that differ in metastatic potential. J Natl Cancer Inst 1985; 75: 99–103.
CAS PubMed Google Scholar - Pasco S, Brassart B, Ramont L, Maquart FX, Monboisse JC . Control of melanoma cell invasion by type IV collagen. Cancer Detect Prev 2005; 29: 260–266.
Article CAS Google Scholar - D'Alessio S, Gerasi L, Blasi F . uPAR-deficient mouse keratinocytes fail to produce EGFR-dependent laminin-5, affecting migration in vivo and in vitro. J Cell Sci 2008; 121: 3922–3932.
Article CAS Google Scholar - Zou L, Cao S, Kang N, Huebert RC, Shah VH . Fibronectin induces endothelial cell migration through β-1 integrin and Src-dependent phosphorylation of fibroblast growth factor receptor-1 at tyrosines 653/654 and 766. J Biol Chem 2012; 287: 7190–7202.
Article CAS Google Scholar - Koshikawa N, Moriyama K, Takamura H, Mizushima H, Nagashima Y, Yanoma S et al. Overexpression of laminin γ2 chain monomer in invading gastric carcinoma cells. Cancer Res 1999; 59: 5596–5601.
CAS PubMed Google Scholar - Carrero R, Cerrada I, Lledo E, Dopazo J, Garcia-Garcia F, Rubio MP et al. IL-1β induces mesenchymal stem cells migration and leucocyte chemotaxis through NF-κB. Stem Cell Rev 2012; 8: 905–916.
Article CAS Google Scholar - Huang K, Liu W, Lan T, Xie X, Peng J, Huang J et al. Berberine reduces fibronectin expression by suppressing the S1P-S1P2 receptor pathway in experimental diabetic nephropathy models. PLoS One 2012; 7: e43874.
Article CAS Google Scholar - Inai K, Norris RA, Hoffman S, Markwald RR, Sugi Y . BMP-2 induces cell migration and periostin expression during atrioventricular valvulogenesis. Dev Biol 2008; 315: 383–396.
Article CAS Google Scholar - Zhang GY, He B, Liao T, Luan Q, Tao C, Nie CL et al. Caveolin 1 inhibits transforming growth factor-beta1 activity via inhibition of Smad signaling by hypertrophic scar derived fibroblasts in vitro. J Dermatol Sci 2011; 62: 128–131.
Article CAS Google Scholar - Maity G, Sen T, Chatterjee A . Laminin induces matrix metalloproteinase-9 expression and activation in human cervical cancer cell line (SiHa). J Cancer Res Clin Oncol 2011; 137: 347–357.
Article CAS Google Scholar - Santamato A, Fransvea E, Dituri F, Caligiuri A, Quaranta M, Niimi T et al. Hepatic stellate cells stimulate HCC cell migration via laminin-5 production. Clin Sci (Lond) 2011; 121: 159–168.
Article CAS Google Scholar - Shi ZD, Wang H, Tarbell JM . Heparan sulfate proteoglycans mediate interstitial flow mechanotransduction regulating MMP-13 expression and cell motility via FAK-ERK in 3D collagen. PLoS One 2011; 6: e15956.
Article CAS Google Scholar - Suh HN, Han HJ . Laminin regulates mouse embryonic stem cell migration: involvement of Epac1/Rap1 and Rac1/cdc42. Am J Physiol Cell Physiol 2010; 298: C1159–C1169.
Article CAS Google Scholar - Kollar S, Sandor N, Molvarec A, Stenczer B, Rigo J Jr, Tulassay T et al. Prevalence of intracellular galectin-1-expressing lymphocytes in umbilical cord blood in comparison with adult peripheral blood. Biol Blood Marrow Transplant 2012; 18: 1608–1613.
Article CAS Google Scholar - Lamote I, Meyer E, Duchateau L, Burvenich C . Influence of 17β-estradiol, progesterone, and dexamethasone on diapedesis and viability of bovine blood polymorphonuclear leukocytes. J Dairy Sci 2004; 87: 3340–3349.
Article CAS Google Scholar - Chieng-Yane P, Bocquet A, Letienne R, Bourbon T, Sablayrolles S, Perez M et al. Protease-activated receptor-1 antagonist F 16618 reduces arterial restenosis by down-regulation of tumor necrosis factor α and matrix metalloproteinase 7 expression, migration, and proliferation of vascular smooth muscle cells. J Pharmacol Exp Ther 2011; 336: 643–651.
Article CAS Google Scholar - Park JH, Han HJ . Caveolin-1 plays important role in EGF-induced migration and proliferation of mouse embryonic stem cells: involvement of PI3K/Akt and ERK. Am J Physiol Cell Physiol 2009; 297: C935–C944.
Article CAS Google Scholar - Bradford MM . A rapid and sensitive method for the quantitation of microgram quantities of protein utilizing the principle of protein-dye binding. Anal Biochem 1976; 72: 248–254.
Article CAS Google Scholar - Song KS, Li S, Okamoto T, Quilliam LA, Sargiacomo M, Lisanti MP . Co-purification and direct interaction of Ras with caveolin, an integral membrane protein of caveolae microdomains. Detergent-free purification of caveolae microdomains. J Biol Chem 1996; 271: 9690–9697.
Article CAS Google Scholar - Lee SH, Lee YJ, Han HJ . Effect of arachidonic acid on hypoxia-induced IL-6 production in mouse ES cells: Involvement of MAPKs, NF-κB, and HIF-1α. J Cell Physiol 2010; 222: 574–585.
CAS PubMed Google Scholar
Acknowledgements
This study was supported by a National R&D Program through the National Research Foundation of Korea (NRF) funded by the Ministry of Science, ICT & Future Planning (NRF-2013M3A9B4076520).
Author information
Authors and Affiliations
- Department of Veterinary Physiology, College of Veterinary Medicine, Research Institute for Veterinary Science, Seoul National University, Seoul, Korea
S P Yun, S-J Lee, Y H Jung & H J Han - BK21 PLUS Creative Veterinary Research Center, Seoul National University, Seoul, Korea
S P Yun, S-J Lee, Y H Jung & H J Han
Authors
- S P Yun
- S-J Lee
- Y H Jung
- H J Han
Corresponding author
Correspondence toH J Han.
Ethics declarations
Competing interests
The authors declare no conflict of interest.
Additional information
Edited by Y Shi
Supplementary Information accompanies this paper on Cell Death and Disease website
Supplementary information
Rights and permissions
This work is licensed under a Creative Commons Attribution 3.0 Unported License. To view a copy of this license, visit http://creativecommons.org/licenses/by/3.0/
About this article
Cite this article
Yun, S., Lee, SJ., Jung, Y. et al. Galectin-1 stimulates motility of human umbilical cord blood-derived mesenchymal stem cells by downregulation of smad2/3-dependent collagen 3/5 and upregulation of NF-_κ_B-dependent fibronectin/laminin 5 expression.Cell Death Dis 5, e1049 (2014). https://doi.org/10.1038/cddis.2014.3
- Received: 25 July 2013
- Revised: 19 December 2013
- Accepted: 23 December 2013
- Published: 06 February 2014
- Issue date: February 2014
- DOI: https://doi.org/10.1038/cddis.2014.3