Snail1, Snail2, and E47 promote mammary epithelial branching morphogenesis (original) (raw)
While the roles of Snail transcription factors in epithelial‐mesenchymal transition (EMT) are well established, their functions in other morphogenetic processes are less understood. Here, Snail, Snail2, and E47 are shown to promote mammary gland branching morphogenesis, via activation of an EMT‐like gene expression program.
Introduction
The development of the mammary gland and other tree‐like organs takes place through branching morphogenesis, a reiterative process in which a rudimentary epithelial bud extends, bifurcates, and differentiates to form the mature tubular organ (Nelson and Bissell, 2005; Sternlicht, 2006). During epithelial branching, cells retain contacts with their neighbours and translocate as a cohesive group to extend the growing bud or duct through the surrounding stroma (Khalil and Friedl, 2010). Branching morphogenesis can thus be considered a form of collective migration, in which a population of cells uses actomyosin contractility to propel itself forward (Friedl and Gilmour, 2009; Ilina and Friedl, 2009; Gray et al., 2010).
Time‐lapse imaging of organ explants and three‐dimensional (3D) organotypic culture models has revealed that new branches of mammary, salivary, and ureteric buds consist of multilayered epithelial cells that lack apical‐basal polarity and actively rearrange through E‐cadherin‐mediated adhesions (Larsen et al., 2006; Ewald et al., 2008; Chi et al., 2009). Although the epithelial cells remain connected to each other, the reduction in polarity and dynamic reorganization of epithelial structure has led to suggestions that an epithelial‐mesenchymal transition (EMT) or EMT‐like phenotype may be involved in the branching process (O'Brien et al., 2002; Gumbiner, 2005; Revenu and Gilmour, 2009; Micalizzi et al., 2010). EMT is a phenotypic change driven by alterations in gene expression that control epithelial plasticity during embryonic development, organogenesis, wound healing, and tumour progression (Barrallo‐Gimeno and Nieto, 2005; Kalluri and Weinberg, 2009). During EMT, polarized epithelial cells lose apical‐basal polarity, reduce expression of E‐cadherin, increase expression of mesenchymal markers, and become motile and invasive (Kalluri and Neilson, 2003; Peinado et al., 2007). Although mammary epithelial cells do not scatter or initiate actin‐rich protrusions when induced to undergo branching morphogenesis in culture (Ewald et al., 2008), mammary epithelial tissues do show increased expression of the mesenchymal marker vimentin at the leading edge of growing branches (Nelson et al., 2006), suggesting activation of an EMT‐like program. In other organs, E‐cadherin is repressed at nascent clefts of branching murine salivary epithelium (Onodera et al., 2010) and redistributed away from the membrane in emerging buds of branching prostatic epithelium (Xue et al., 2001). The extent to which tissue reorganization and invasion during branching involves activation of the EMT program requires precise definition of the gene expression changes that drive branching.
E‐cadherin expression is regulated in part by a subset of E‐box‐binding transcription factors, including the zinc‐finger transcription factors Snail1 (Snai1/Snail), Snail2 (Snai2/Slug), ZEB1 (TCF8/δEF1) and ZEB2 (SIP1) (Comijn et al., 2001; Côme et al., 2004) and the basic helix‐loop‐helix (bHLH) transcription factors E47 (TCF3), E2‐2 (TCF4), and Twist1 (Perez‐Moreno et al., 2001; Yang et al., 2004). These transcription factors bind specifically to the consensus E‐box elements in the proximal promoter region and repress transcription of E‐cadherin (Cano et al., 2000). In addition to regulating E‐cadherin, these transcription factors are well‐characterized regulators of the EMT proteome (Moreno‐Bueno et al., 2008), and are involved in diverse cellular processes during normal and pathological development, including programmed cell death (Kajita et al., 2004) and cell proliferation (Barrallo‐Gimeno and Nieto, 2005). Although members of the Snail and Twist families are enriched at the leading edge of growing mammary buds (Kouros‐Mehr and Werb, 2006) and in nascent salivary clefts (Onodera et al., 2010), it is unclear whether and how these transcription factors regulate branching.
Here, we characterized the mesenchymal gene expression changes associated with mammary epithelial branching morphogenesis and elucidated the role of EMT‐related E‐box‐binding transcription factors during branch initiation. We found that Snail1, Snail2, and E47 were increased at branch sites, and that interrupting their expression inhibited branching morphogenesis. Furthermore, ectopic expression of Snail1, Snail2, and E47 promoted branching in the absence of exogenous stimuli. These changes correlated with repression of E‐cadherin, disruption of which abrogated branching. Moreover, Snail1 and Snail2 promoted cell survival by preventing apoptosis at branch sites, but blocking cell death itself did not induce branching. Our findings implicate the E‐box‐binding transcription factors Snail1, Snail2, and E47 as key promoters of mammary epithelial branching through repression of E‐cadherin.
Results
Snail1, Snail2, E47, and Twist1 are upregulated during branching morphogenesis of mammary epithelial cells
Aspects of mammary epithelial branching can be replicated in culture using organotypic models (Fata et al., 2007; Ewald et al., 2008; Nelson et al., 2008). When embedded within 3D extracellular matrix (ECM) gels of type I collagen or Matrigel®, clusters of mammary epithelial cells undergo branching morphogenesis in the presence of growth factors (Hirai et al., 1998; Simian et al., 2001; Chen et al., 2009). In the absence of growth factors, background levels of branching are very low, with ∼10% of the clusters extending short branches after 24 h. Significant and robust branching occurs after the addition of epidermal growth factor (EGF) or hepatocyte growth factor (HGF), with branch induction evident after 3 h and large multicellular branches prominent after 9 h (Figure 1A and B).
Figure 1
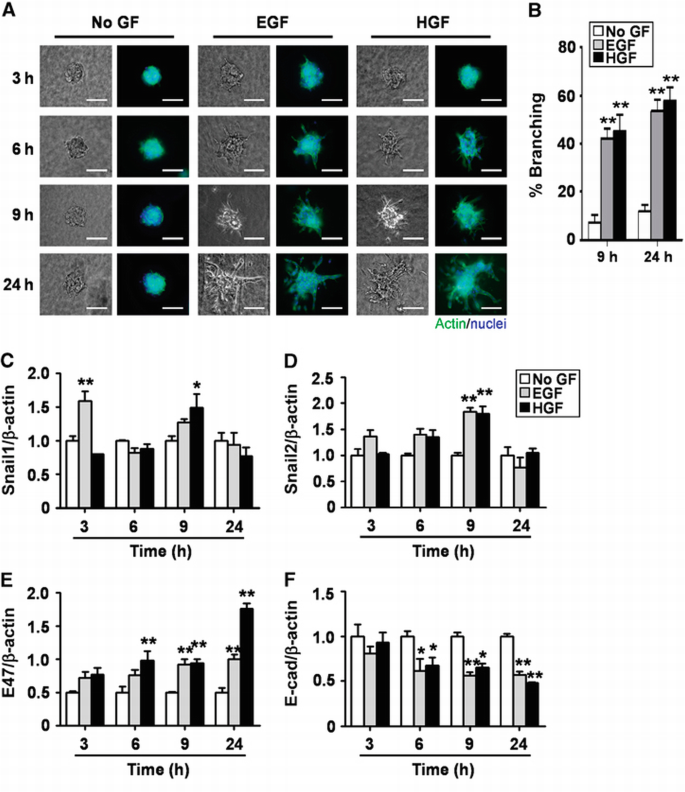
Snail1, Snail2, and E47 mRNA levels are transiently increased during EGF‐ or HGF‐induced branching morphogenesis. (A) Clusters of mammary epithelial cells were embedded in collagen gel and treated with no growth factor (No GF), EGF, or HGF and monitored for branching at 3, 6, 9, and 24 h. Shown are nuclei (blue) and actin (green). Scale bars, 100 μm. (B) Quantification of the percentage of branching from 20 clusters for No GF, EGF, or HGF treatment; shown are mean±s.e.m. (_n_=3 independent experiments). **P<0.01 versus No GF (two‐way ANOVA with Bonferroni comparison). (C–F) Total RNA was isolated at indicated times and used to determine the mRNA levels of (C) Snail1, (D) Snail2, (E) E47, and (F) E‐cadherin by qRT–PCR. The mRNA levels were normalized to the levels of β‐actin in each sample and each value was expressed relative to the levels in No GF; shown are mean±s.e.m. (_n_=3). *P<0.05; **P<0.01 versus 3 h No GF (two‐way ANOVA with Bonferroni comparison).
To investigate whether EMT‐like processes are associated with mammary branching, we used the 3D organotypic model to characterize the expression levels of genes within the EMT proteome (Kalluri and Neilson, 2003; Zeisberg and Neilson, 2009) during branching morphogenesis. Genes whose expression levels change during EMT include transcription factors (Snail1, Snail2, E47, and Twist1), intercellular adhesion molecules (E‐cadherin, N‐cadherin, and ZO‐1), ECM‐degrading enzymes (matrix metalloproteinases (MMPs)), and cytoskeletal proteins (keratins and vimentin). We found that the mRNA levels of several E‐box‐binding transcription factors were upregulated during growth factor‐induced mammary epithelial branching (Figure 1C–E; Supplementary Figure S1A). Snail1 expression significantly increased after 3 or 9 h of treatment with EGF or HGF, respectively (Figure 1C); this upregulation was transient and decreased to basal levels by 24 h. Similarly, Snail2 expression was transiently upregulated by EGF or HGF after 9 h and then decreased to the levels of untreated controls (Figure 1D). E47 expression significantly and stably increased by 6 h (Figure 1E), and Twist1 significantly increased after 9 h of treatment with growth factors (Supplementary Figure S1A). We also examined the expression levels of Snail1, Snail2, and E47 in 3D cultures of primary mammary epithelial organoids (Supplementary Figure S1B). Consistent with the transcript results, we observed increased protein expression of Snail1, Snail2, and E47, all of which localized to the nuclei during branching of primary organoids.
The repression of E‐cadherin by Snail1, Snail2, E47, and Twist1 is a well‐established hallmark of both developmental and pathological EMTs (Kalluri and Neilson, 2003; Peinado et al., 2003). We found that E‐cadherin mRNA levels decreased during EGF or HGF‐induced mammary epithelial branching by 6 h, and that this decrease was sustained over the duration of the experiment (Figure 1F). Consistently, E‐cadherin protein expression decreased within the clusters and redistributed away from the membrane (Supplementary Figure S1C). Similarly, the epithelial markers syndecan‐1 (SDC1) and mucin‐1 (Muc1) were downregulated during growth factor‐induced branching (Supplementary Figure S1D). Conversely, we found a significant increase in the expression levels of mesenchymal markers, including vimentin, fibroblast‐specific protein‐1 (FSP1), MMP3, and MMP9 (Supplementary Figure S1D). These results suggest that E‐cadherin is downregulated and that mesenchymal markers are upregulated in mammary epithelial cells during branching morphogenesis.
To determine whether the gene expression changes were specifically associated with the branching process itself, we took advantage of a microfabricated tissue assay in which branching occurs predictably and reproducibly at precise locations (Nelson et al., 2006, 2008). Mammary epithelial tubules of defined shape and size were generated by embedding mammary epithelial cells in cavities micromoulded within collagen gels. The tubules remained quiescent in the absence of growth factors, and branched specifically from the ends when treated with EGF or HGF (Figure 2A and B). To determine the localization of EMT markers during branching, we performed immunofluorescence staining after treating tubules with growth factors. Consistent with the results in 3D clusters and primary organoids, the transcription factors Snail1, Snail2, and E47 significantly increased after treatment with EGF or HGF, compared with untreated controls (Figure 2C and D). Moreover, these transcription factors were expressed specifically and stably in cells located at future branch sites (Figure 2C and D). These data are consistent with our previous findings that the vimentin gene promoter was activated at branch sites (Nelson et al., 2006). Here, immunofluorescence staining revealed that vimentin protein levels increased at future branch sites after treatment with EGF or HGF (Figure 2D). Conversely, E‐cadherin was diminished at future branch sites after 8 h of EGF treatment and was significantly delocalized within nascent branches after 24 h (Figure 2E). These results indicate that the alterations in the EMT proteome occurred specifically in the areas that later branched. These localized changes were observed before branch extension, suggesting that alterations in expression of EMT‐related genes may be involved in the branching process.
Figure 2
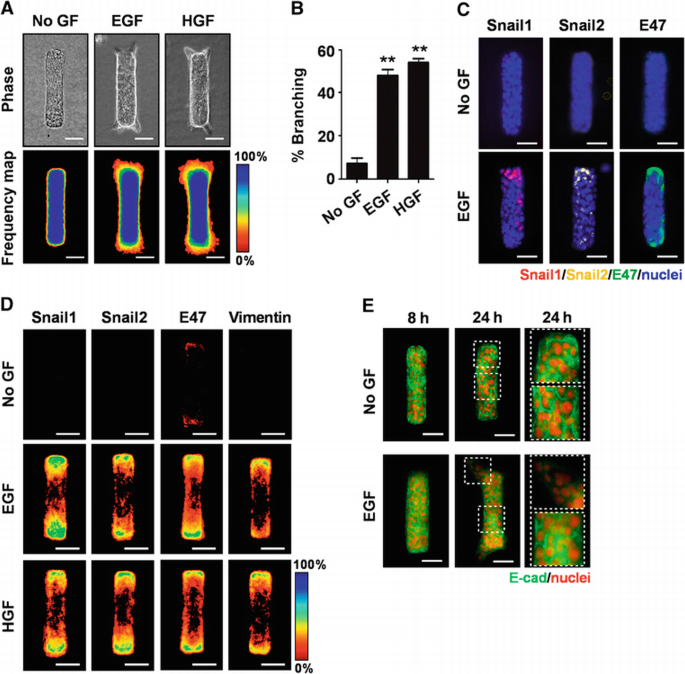
Snail1, Snail2, and E47 are increased at branch sites. (A) Microfabricated mammary epithelial tubules were treated with no growth factor (No GF), EGF, or HGF for 24 h. Phase contrast images and frequency maps of 60 tubules stained for nuclei are shown. Scale bars, 50 μm. Colour bars indicate frequency. (B) Branching was quantified by measuring the pixel intensity 12 μm away from the tip of tubules; shown are mean±s.e.m. (_n_=5). **P<0.01 versus No GF (one‐way ANOVA with Bonferroni comparison). (C) Microfabricated mammary epithelial tubules were treated with No GF or EGF for 8 h and stained for Snail1, Snail2, or E47. Scale bars, 50 μm. (D) Frequency maps of 50 tubules stained for Snail1, Snail2, E47, or vimentin. Scale bars, 50 μm. Colour bars indicate frequency. (E) Microfabricated mammary epithelial tubules were treated with No GF or EGF for 8 or 24 h and stained for E‐cadherin. Scale bars, 50 μm.
Snail1, Snail2, and E47 are necessary and sufficient for branching morphogenesis of mammary epithelial cells
Our results suggest a correlation between mammary epithelial branching morphogenesis and the expression of the E‐box‐binding transcription factors Snail1, Snail2, E47, and Twist1. To determine whether these transcription factors regulated branching, we modulated their levels using RNA interference and ectopic expression.
Specific silencing of Snail1, Snail2, and E47 was confirmed by quantitative real‐time PCR (qRT–PCR), immunofluorescence staining, and immunoblot analysis using mammary epithelial cells transfected with small hairpin RNA (shRNA) targeting Snail1 (shSnail1), Snail2 (shSnail2), or E47 (shE47) (Figure 3A–C and data not shown). Growth factor‐mediated repression of E‐cadherin was inhibited by shSnail1 and shE47, whereas shSnail2 had no significant effect (Figure 3D–F; Supplementary Figure S2). This observation is consistent with previous studies showing that Snail2 increases during branching of salivary epithelium and partial EMT of kidney epithelial cells but does not repress E‐cadherin (Leroy and Mostov, 2007; Onodera et al., 2010). We next examined whether the expression of Snail1, Snail2, or E47 was required for growth factor‐induced mammary epithelial branching. Tubules expressing shRNAs were treated with growth factors and monitored for branching morphogenesis (Figure 3G and H). As expected, control tubules branched significantly upon treatment with EGF or HGF. In contrast, tubules lacking Snail1, Snail2, or E47 were all prevented from branching. Silencing of these transcription factors also blocked branching morphogenesis of primary mammary epithelial organoids (Supplementary Figure S3). Using a similar approach, we found that Twist1 did not affect mammary branching or E‐cadherin expression (Supplementary Figure S4). These results obtained from a variety of branching assays indicate that upregulation of Snail1, Snail2, and E47, but not Twist1, is necessary for mammary epithelial branching morphogenesis. These results also suggest that Snail1 and E47 may function in part by regulating E‐cadherin expression, whereas Snail2 may have a different role.
Figure 3
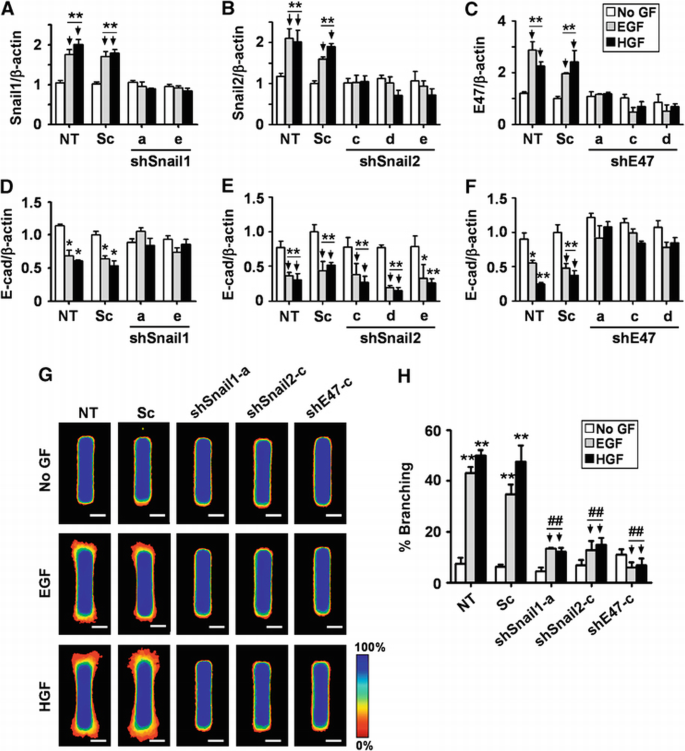
Loss of Snail1, Snail2, or E47 represses branching morphogenesis. (A–F) Mammary epithelial cells were transfected with two independent shSnail1, three independent shSnail2, three independent shE47, scrambled shRNA (Sc), or no shRNA cassette (NT). After 48 h, transfected cells were treated with no growth factor (No GF), EGF, or HGF for 9 h. Total RNA was isolated for determination of (A) Snail1, (B) Snail2, (C) E47, or (D–F) E‐cadherin mRNA levels by qRT–PCR. The mRNA levels were normalized to the levels of β‐actin in each sample and each value was expressed relative to the levels in No GF of scrambled shRNA transfected cells (Sc); plotted are mean±s.e.m. (_n_=3). *P<0.05; **P<0.01 versus Sc (No GF) (two‐way ANOVA with Bonferroni comparison). (G) Mammary epithelial cells were transfected with shSnail1, shSnail2, shE47, Sc, or NT and used to generate microfabricated mammary epithelial tubules. Tubules were treated with No GF, EGF, or HGF for 24 h. Frequency maps of branching from 50 tubules are shown. Scale bars, 50 μm. Colour bar indicates frequency. (H) Branching was quantified as described above; shown are mean±s.e.m. (_n_=5). All results were confirmed with at least two independent shRNA constructs for each gene. **P<0.01 versus NT (No GF); ##P<0.01 versus Sc (EGF) (two‐way ANOVA with Bonferroni comparison).
To determine whether these transcription factors are sufficient to induce branching morphogenesis, we engineered tubules that ectopically expressed Flag‐tagged Snail1, Snail2, E47, or YFP control. When treated with EGF or HGF, both non‐transfected tubules and those transfected with YFP increased expression of all three transcription factors and decreased expression of E‐cadherin as determined by immunoblotting (Figure 4A), consistent with the qRT–PCR analysis. Ectopic expression of the Flag‐tagged transcription factors decreased E‐cadherin expression at the protein and mRNA levels (Figure 4A and B). Conversely, levels of mesenchymal markers including N‐cadherin (Figure 4C) and MMP3, MMP9, FSP1, and vimentin (Supplementary Figure S5) increased with expression of Snail1, Snail2, or E47. Furthermore, ectopic expression of each transcription factor induced branching morphogenesis of engineered tubules (Figure 4D and E) and primary mammary organoids (Supplementary Figure S3). These data suggest that the E‐box‐binding transcription factors Snail1, Snail2, and E47 are necessary and sufficient for branching morphogenesis of mammary epithelial cells in collagen gels.
Figure 4
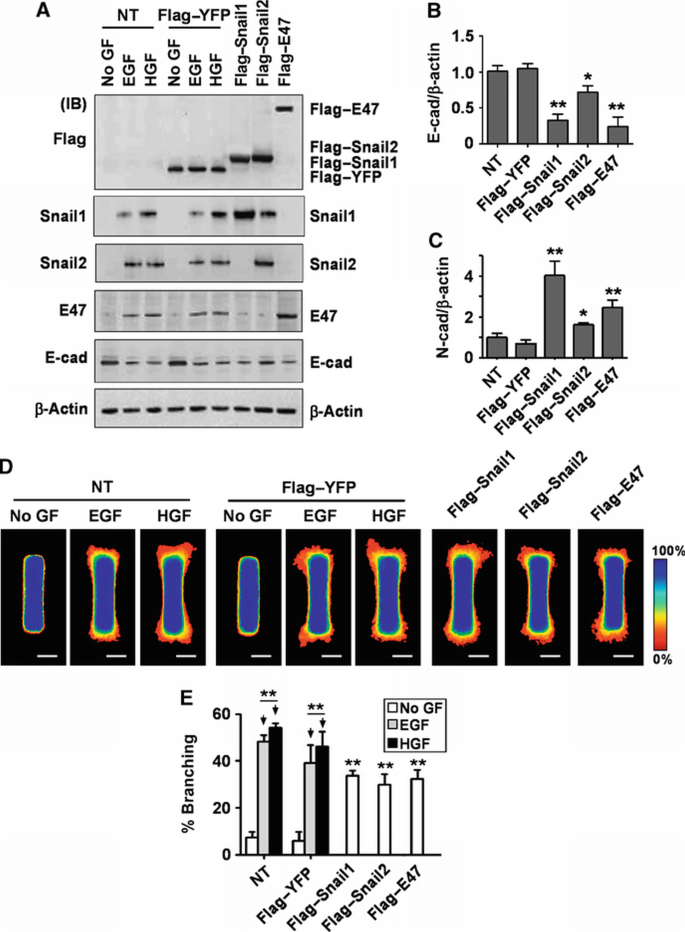
Snail1, Snail2, and E47 induce mammary epithelial branching morphogenesis. (A–C) Mammary epithelial cells were transfected with Flag‐tagged Snail1, Snail2, E47, YFP, or nothing (NT). (A) Total protein was assayed by immunoblot to determine the expression levels of Snail1, Snail2, E47, or E‐cadherin. Total RNA was isolated for determination of (B) E‐cadherin or (C) N‐cadherin mRNA levels by qRT–PCR. The mRNA levels were normalized to the levels of β‐actin in each sample and each value was expressed relative to the levels in Flag‐tagged YFP transfected cells; shown are mean±s.e.m. (_n_=4). *P<0.05; **P<0.01 versus Flag‐tagged YFP (one‐way ANOVA with Bonferroni comparison). (D) Mammary epithelial cells were transfected with Flag‐tagged Snail1, Snail2, E47, YFP, or NT and used to generate microfabricated mammary epithelial tubules. Frequency maps of branching from 50 tubules are shown. Scale bars, 50 μm. Colour bar indicates frequency. (E) Branching was quantified as described above; shown are mean±s.e.m. (_n_=5). **P<0.01 versus NT (No GF) (two‐way ANOVA with Bonferroni comparison).
Ectopic expression of Snail2 promotes mammary epithelial branching through Snail1
Treating tubules with EGF or HGF consistently reduced the expression of E‐cadherin at the mRNA and protein levels. Although shRNA‐mediated depletion of Snail2 had no effect on growth factor‐mediated repression of E‐cadherin, we observed that ectopic expression of Snail2 slightly reduced E‐cadherin levels as compared with vector control (Figure 4A and B). However, ectopic expression of Snail2 also increased Snail1 levels (Figure 4A), suggesting that ectopic Snail2 might mediate its effects on branching through Snail1. To test this hypothesis, we created tubules that co‐expressed Flag‐tagged Snail2 and shSnail1. Expression of shSnail1 prevented the Snail2‐induced decrease in E‐cadherin (Supplementary Figure S6A and B) and increase in N‐cadherin and vimentin (Supplementary Figure S6C and D). Furthermore, shSnail1 inhibited Snail2‐induced branching morphogenesis (Supplementary Figure S6E and F). Conversely, ectopic expression of Snail1 rescued the branching defect in Snail2‐silenced tubules (Supplementary Figure S7A). These data suggest that ectopic expression of Snail2 promotes branching of mammary epithelial cells through Snail1.
Snail1 and Snail2 prevent apoptosis at branch sites during mammary epithelial branching
During branching morphogenesis of kidney epithelial cells in culture, protection from apoptosis is required to permit cells to extend branches into the surrounding ECM (Leroy and Mostov, 2007). Some E‐box‐binding transcription factors have been implicated in cell survival by blocking the expression of pro‐apoptotic factors including p53 and Bcl2‐interacting domain protein (BID) (Kajita et al., 2004; Vega et al., 2004; Leroy and Mostov, 2007). Indeed, we found that treating tubules with EGF or HGF reduced the expression of p53 and BID (Figure 5A and B). Growth factor treatment also suppressed cell death at the future branch sites, as determined by staining of cleaved caspase‐3 (Figure 5C). To determine whether these transcription factors are necessary for survival of cells during mammary epithelial branching morphogenesis, we depleted Snail1, Snail2, and E47 from tubules and treated with EGF or HGF. Tubules expressing shSnail1 or shSnail2, but not shE47, failed to downregulate p53 or BID (Figure 5A and B) and showed significant caspase‐3 activity and p53 expression at branch sites when treated with growth factors (Figure 5C–F); the onset of caspase‐3 activation mirrored the time course of Snail1 and Snail2 expression (Figure 5G). Ectopic expression of either Flag‐tagged Snail1 or Snail2, but not E47, significantly reduced p53, BID, and caspase‐3 activity at branch sites in the absence of stimuli (Figure 6A–D). These results indicate that Snail1 and Snail2 block apoptosis at branch sites in mammary epithelial tubules during growth factor‐induced branching.
Figure 5
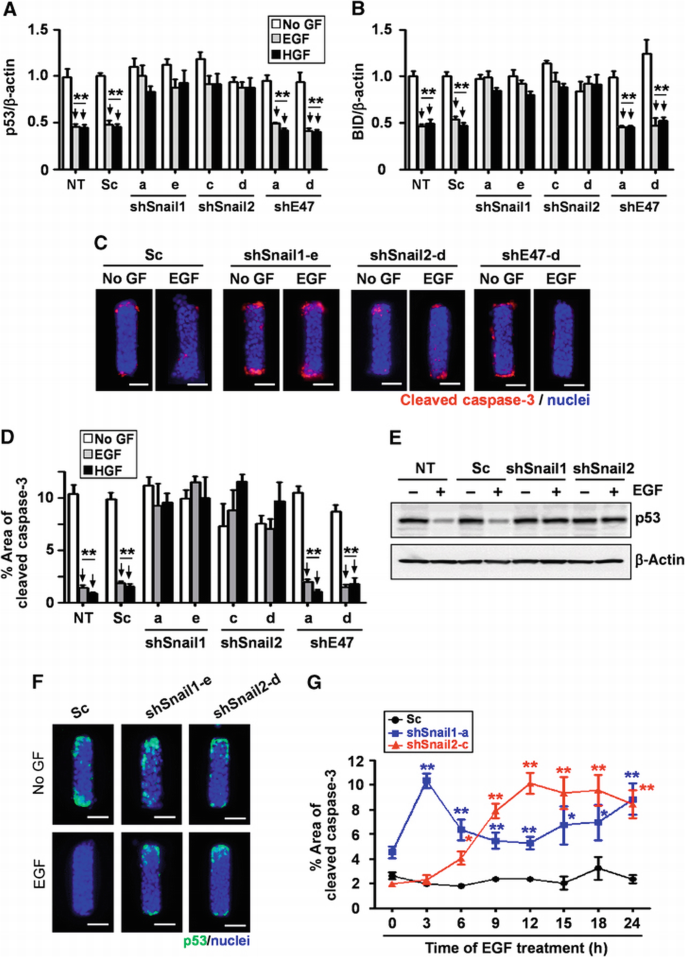
Loss of Snail1 or Snail2 leads to apoptotic cell death at branch sites during mammary epithelial branching morphogenesis. (A, B) Mammary epithelial cells were transfected with shSnail1, shSnail2, shE47, or scrambled shRNA (Sc). After 48 h, transfected cells were treated with no growth factor (No GF), EGF, or HGF for 9 h. Total RNA was isolated for determination of (A) p53 and (B) BID mRNA levels using qRT–PCR. The mRNA levels were normalized to the levels of β‐actin in each sample and each value was expressed relative to the levels in No GF of scrambled shRNA transfected cells; shown are mean±s.e.m. (_n_=3). **P<0.01 versus SC (No GF) (two‐way ANOVA with Bonferroni comparison). (C) Mammary epithelial cells were transfected with shSnail1, shSnail2, shE47, or scrambled shRNA (Sc) and used to generate microfabricated mammary epithelial tubules. Tubules were treated with No GF, EGF, or HGF for 20 h and fixed and stained for cleaved caspase‐3 and nuclei. Scale bars, 50 μm. (D) Percent area of active caspase‐3 was quantified by measuring cleaved caspase‐3‐positive areas in 25 tubules from at least three independent experiments; shown are mean±s.e.m. **P<0.01 versus NT (No GF) (two‐way ANOVA with Bonferroni comparison). (E) Mammary epithelial cells were transfected with shSnail1, shSnail2, scrambled RNA (Sc), or nothing (NT). After 24 h, cells were treated with or without EGF. Total protein was analysed by immunoblot to determine the expression levels of p53 or β‐actin. (F) Microfabricated mammary epithelial tubules were generated and treated with or without EGF and stained for p53. Scale bars, 50 μm. (G) Microfabricated mammary epithelial tubules were generated and treated with EGF for the indicated time. Percent area of cleaved caspase‐3 in scrambled RNA (Sc), shSnail1, or shSnail2‐transfected samples was quantified as described above; shown are mean±s.e.m. (_n_=30). *P<0.05; **P<0.01 versus Sc (0 h) (two‐way ANOVA with Bonferroni comparison).
Figure 6
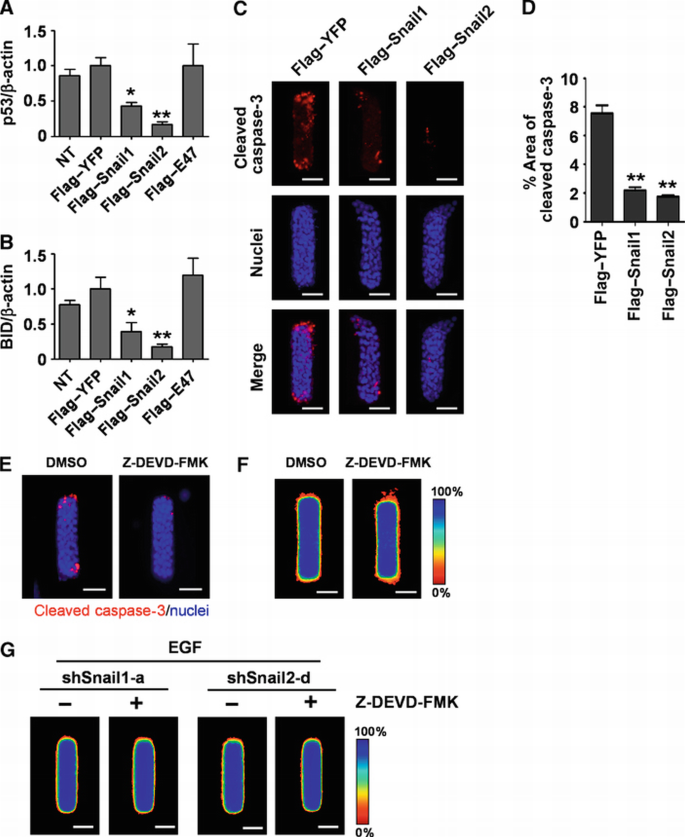
Inhibition of apoptosis by Snail1 or Snail2 is not sufficient to induce mammary branching morphogenesis. (A, B) Mammary epithelial cells were transfected with Flag‐tagged Snail1, Snail2, E47, YFP, or nothing (NT). Total RNA was isolated for determination of (A) p53 and (B) BID mRNA levels using qRT–PCR. The mRNA levels were normalized to the levels of β‐actin in each sample and each value was expressed relative to the levels in Flag‐tagged YFP; shown are mean±s.e.m. (_n_=4). *P<0.05; **P<0.01 versus Flag–YFP (one‐way ANOVA with Bonferroni comparison). (C) Mammary epithelial cells were transfected with Flag‐tagged Snail1, Snail2, or YFP and used to generate microfabricated mammary epithelial tubules. Tubules were cultured for 20 h and stained for cleaved caspase‐3 and nuclei. Scale bars, 50 μm. (D) Percent area of cleaved caspase‐3 was quantified as described above; shown are mean±s.e.m. (_n_=30). **P<0.01 versus Flag‐tagged YFP (one‐way ANOVA with Bonferroni comparison). (E, F) Microfabricated mammary epithelial tubules were treated with caspase‐3 inhibitor (Z‐DEVD‐FMK, 20 μM) or vehicle (DMSO). (E) Tubules stained for cleaved caspase‐3 (red) and nuclei (blue) and (F) frequency maps of 50 tubules are shown. Scale bars, 50 μm. (G) Microfabricated mammary epithelial tubules generated from cells transfected with shSnail1‐a or shSnail2‐d were treated with caspase‐3 inhibitor (Z‐DEVD‐FMK, 20 μM) or vehicle. Frequency maps of branching from 50 tubules are shown. Scale bars, 50 μm. Colour bar indicates frequency.
Previous studies concluded that tissues must be protected from apoptosis through Snail2‐mediated signalling in order to branch (Leroy and Mostov, 2007). However, we found that ectopic expression of E47 was able to induce branching without affecting apoptotic signalling (Figure 6A and B) or caspase‐3 activation (data not shown), suggesting that blocking apoptosis may not be directly involved in branching of mammary epithelial cells. Moreover, tubules expressing both Flag‐tagged Snail2 and shSnail1 were protected from apoptosis (Supplementary Figure S7B–E), but failed to branch (Supplementary Figure S6E and F). To determine whether Snail1 or Snail2 induce branching by virtue of their effects on apoptosis, we combined shRNA‐mediated silencing of these transcription factors with treatment with Z‐DEVD‐FMK, a specific inhibitor of caspase‐3 protease activity and apoptosis (Talanian et al., 1997; Figure 6E). Blocking apoptosis did not induce branching in the absence of growth factor treatment (Figure 6F). Furthermore, blocking apoptosis in tubules depleted of Snail1 or Snail2 failed to rescue the inhibition of branching caused by these shRNA treatments (Figure 6G). These data suggest that inhibiting apoptosis is not sufficient to induce branching, and that Snail1 and Snail2 are required for branching morphogenesis independently of their effects on apoptosis.
Repression of E‐cadherin is necessary for mammary epithelial branching morphogenesis
We consistently observed that E‐cadherin was downregulated during branching morphogenesis of mammary epithelial tubules and clusters. Loss of E‐cadherin has also been observed during cleft formation in the branching of salivary glands and lungs (Sakai et al., 2003; Larsen et al., 2006; Liu et al., 2008; Onodera et al., 2010). Nonetheless, it is unclear whether E‐cadherin repression is required for mammary branching morphogenesis. To determine the role of E‐cadherin in mammary branching, we created tubules that ectopically expressed E‐cadherin (Figure 7A and B). Tubules ectopically expressing E‐cadherin were refractory to growth factor stimulation and failed to branch (Figure 7C and D). To determine whether E‐cadherin repression is required for Snail1‐induced branching, we co‐expressed Flag‐tagged Snail1 and E‐cadherin in the tubules (Figure 7E). Ectopic expression of E‐cadherin blocked Snail1‐mediated induction of branching morphogenesis (Figure 7F and G). Similarly, E‐cadherin repression was also necessary for the induction of branching by E47 (Figure 7H–J). These data suggest that branching morphogenesis requires downregulation of E‐cadherin expression, and that Snail1 and E47 induce branching in part by repressing E‐cadherin.
Figure 7
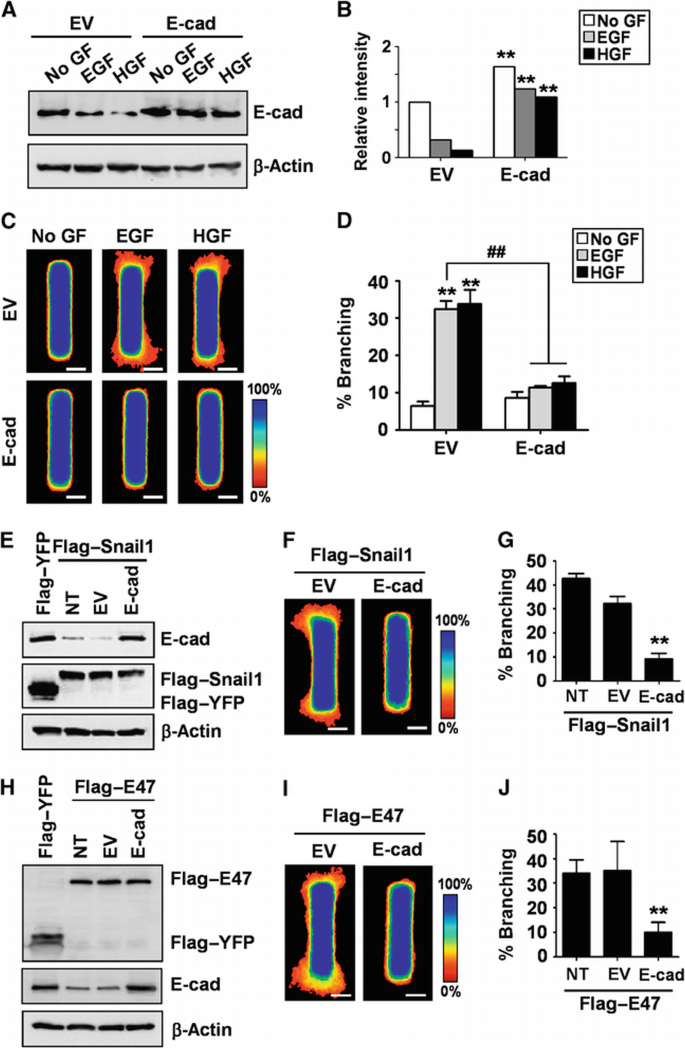
Repressing E‐cadherin expression is required for branching morphogenesis. (A) Mammary epithelial cells were transfected with E‐cadherin or empty vector (EV) and incubated with EGF or HGF for 24 h. Total protein was assayed by immunoblot to determine the expression levels of E‐cadherin. (B) Relative intensity of bands in immunoblots shown in panel (A). **P<0.01 versus EV of each treatment (Student's _t_‐test). (C) Mammary epithelial cells were transfected with E‐cadherin or EV and used to generate microfabricated mammary epithelial tubules. Frequency maps of branching from 50 tubules are shown. Scale bars, 50 μm. Colour bar indicates frequency. (D) Branching was quantified as described above; shown are mean±s.e.m. (_n_=4). **P<0.01 versus EV (No GF); ##P<0.01 versus EV (EGF) (two‐way ANOVA with Bonferroni comparison). (E) Mammary epithelial cells were co‐transfected with Flag‐tagged Snail1 and E‐cadherin or EV. Total protein was assayed by immunoblot to determine the expression levels of Snail1 or E‐cadherin. (F) Mammary epithelial cells were co‐transfected with Flag‐tagged Snail1 and E‐cadherin or EV and used to generate microfabricated mammary epithelial tubules. Frequency maps of branching from 50 tubules are shown. Scale bars, 50 μm. Colour bar indicates frequency. (G) Branching was quantified as described above; shown are mean±s.e.m. (_n_=4). **P<0.01 versus NT (one‐way ANOVA with Bonferroni comparison). (H) Mammary epithelial cells were co‐transfected with Flag‐tagged E47 and E‐cadherin or EV. Total protein was assayed by immunoblot to determine the expression levels of E47 or E‐cadherin. (I) Mammary epithelial cells co‐transfected with Flag‐tagged E47 and E‐cadherin or EV were used to generate microfabricated mammary epithelial tubules. Frequency maps of branching from 50 tubules are shown. Scale bars, 50 μm. Colour bar indicates frequency. (J) Branching was quantified as described above; shown are mean±s.e.m. (_n_=4). **P<0.01 versus NT (one‐way ANOVA with Bonferroni comparison).
Discussion
Collective migration of clusters, sheets, or chains of cells is critical for embryonic development and drives processes as diverse as streaming of craniofacial neural crest cells (Teddy and Kulesa, 2004) and migration of the dorsal mesoderm during Xenopus gastrulation (Winklbauer et al., 1992). Formation of the neural crest and mesoderm are classic developmental EMTs, and both are regulated by a subset of E‐box‐binding transcription factors including Snail1 (Aman and Piotrowski, 2010). Branching morphogenesis is an interesting example of collective migration in which a population of epithelial cells dynamically reorganizes and cohesively invades the surrounding stroma. Various EMT regulators have been implicated in the branching of different organs (Pollack et al., 1998; Kouros‐Mehr and Werb, 2006; Leroy and Mostov, 2007; Onodera et al., 2010), but the field has yet to come to a consensus regarding the role of EMT in branching morphogenesis, in part due to lack of comprehensive data in any single system. To attain greater insight into the possible role of the EMT program during branching, here we characterized the spatiotemporal changes in expression of key EMT effectors during branching morphogenesis of mammary epithelial cells in culture. Although cells within branches remained attached to each other during the branching process, we found significant downregulation of E‐cadherin and other epithelial markers and a concomitant upregulation of mesenchymal markers. The downregulation of E‐cadherin expression was required for branch formation, but this downregulation by itself did not result in detachment of cells from their neighbours. These data suggest an uncoupling between classical morphological EMT (typified by scattering of individual cells) and the gene expression changes used to define the process. These data also point to the possibility that diverse collective migration events (neural crest streaming, mesoderm migration, and branch formation) may be driven by similar genetic programs. To begin to determine the functional roles of these gene expression changes during branching, we focused specifically on the transcription factors that have been defined as ‘master regulators’ of EMT.
A subset of E‐box‐binding transcription factors are well‐characterized inducers of epithelial remodelling and EMT. We found that Snail1, Snail2, and E47 are increased at branch sites of mammary epithelial tissues. The localized expression may result from biochemical or physical signals that determine branch sites, such as transforming growth factor‐β or mechanical stress (Nelson et al., 2006; Gjorevski and Nelson, 2010; Gomez et al., 2010). Our data are consistent with previous reports showing enhanced mRNA expression of Snail1 and Twist1 at terminal end buds in the mammary gland in vivo (Kouros‐Mehr and Werb, 2006). Indeed, that the mammary epithelium expressed these EMT regulators during development was confirmed by immunohistochemical analysis of Snail1, Snail2, and E47 in glands from pubertal mice (Supplementary Figure S1E). These transcription factors are involved in multiple processes during development and mice deficient for Snail1 or Twist1 die during embryogenesis (Chen and Behringer, 1995; Carver et al., 2001). We therefore defined the role played by these transcription factors in mammary epithelial branching using a 3D organotypic culture model (Nelson et al., 2006, 2008). Our results showed that inhibiting the expression of Snail1, Snail2, and E47, but not Twist1, significantly abrogated branch initiation, suggesting that the expression of these transcription factors is required for mammary epithelial branching morphogenesis. Depleting these transcription factors did not significantly affect cell proliferation, which was enhanced at branch sites (Supplementary Figure S8). Consistent with the knock‐down results, ectopic expression of these transcription factors induced branching and led to changes in the expression of epithelial and mesenchymal markers, suggesting that these transcription factors may have overlapping or redundant roles in branching.
In addition to regulating epithelial gene expression, we found that Snail1 and Snail2 regulated the expression of p53 and BID and inhibited apoptosis; a similar regulation has been reported for Snail2 during MDCK tubulogenesis (Leroy and Mostov, 2007). This regulation may be direct or indirect, as previous studies have implicated Snail‐family transcription factors in cell survival (Kajita et al., 2004; Tríbulo et al., 2004) and biochemical analysis has revealed that both Snail1 and Snail2 bind to the promoter regions of pro‐apoptotic genes (Kajita et al., 2004). In the absence of stimuli, engineered mammary epithelial tissues exhibited significant apoptosis at future branch sites. It is as yet unclear what factors result in activation of apoptotic signalling pathways in the cells located at future branch sites, though it seems likely that these signals are both biochemical and physical in nature (Gjorevski and Nelson, 2010). Our results showed that ectopic Snail2 induced branching, altered mesenchymal gene expression, and regulated apoptosis in part through Snail1 (data not shown). The cell death noted here may or may not be dependent on p53, BID, or other pro‐apoptotic genes regulated by Snail1 and Snail2. Regardless, we found that blocking cell death is not directly involved in mammary epithelial branching, as E47 induces branching without affecting apoptotic signalling. Blocking cell death is also not sufficient for branching, as inhibiting apoptosis does not rescue the branching defects of Snail1‐ or Snail2‐depleted tubules. These findings distinguish the branching of mammary epithelial cells from that of MDCK epithelial cells, in which it was concluded that the principal role of Snail2 was to block cell death (Leroy and Mostov, 2007).
Instead, we found that branching required repression of E‐cadherin, a hallmark of the EMT phenotype. E‐cadherin repression and/or relocalization may turn out to be a common requirement for branching morphogenesis of epithelial tissues. Indeed, E‐cadherin mRNA is depleted from salivary cleft epithelial cells, resulting in a decrease in protein at cleft sites during branching (Sakai et al., 2003). Although the levels of E‐cadherin do not decrease during branching of MDCK cells (Leroy and Mostov, 2007), the protein is redistributed away from adherens junctions during the branching process (Pollack et al., 1998). E‐cadherin also localizes away from cell–cell contacts during branching morphogenesis of prostate epithelium in vivo (Xue et al., 2001). Our data show that the repression of E‐cadherin is required, and not merely coincidental, for the branching morphogenesis of mammary epithelial cells. Immature junctional complexes may facilitate the dynamic cellular rearrangements that occur during branching (Larsen et al., 2006). However, it is important to note that E‐cadherin is still present within these tissues. Complete loss of E‐cadherin‐mediated adhesions disrupts cell collectives and promotes individual migration. Furthermore, although repression of E‐cadherin is necessary for branching, it is not sufficient. We found that Snail2‐depleted mammary tubules and clusters decreased E‐cadherin levels but failed to branch, consistent with a requirement for other EMT markers, including MMPs, during branching (Simian et al., 2001; Nelson et al., 2006).
In summary, our experiments using model epithelial tissues provide insight into how a subset of E‐box‐binding transcription factors dynamically orchestrate the EMT proteome to enforce or restrict branching morphogenesis (Figure 8). We suggest that gene expression changes typically associated with EMT may be generally important for collective migration, even though cells do not detach from their neighbours, as in migration of the craniofacial neural crest, dorsal mesoderm, or the mammary epithelial branching described here. Whether the branching process is more akin to a partial EMT (as proposed by Mostov and colleagues (Pollack et al., 1998; Leroy and Mostov, 2007)) or a unique form of collective migration (as proposed by Werb and colleagues (Ewald et al., 2008)) will require further analysis; it is likely that different modes are used for each organ and microenvironmental context. Indeed, the pathways uncovered here using organotypic culture models may be distinct from those that function in the in vivo microenvironment. Exploring how transient expression of each transcription factor is specifically regulated during branching morphogenesis in culture and in vivo will help to elucidate their relative roles in normal and dysmorphic organ development.
Figure 8
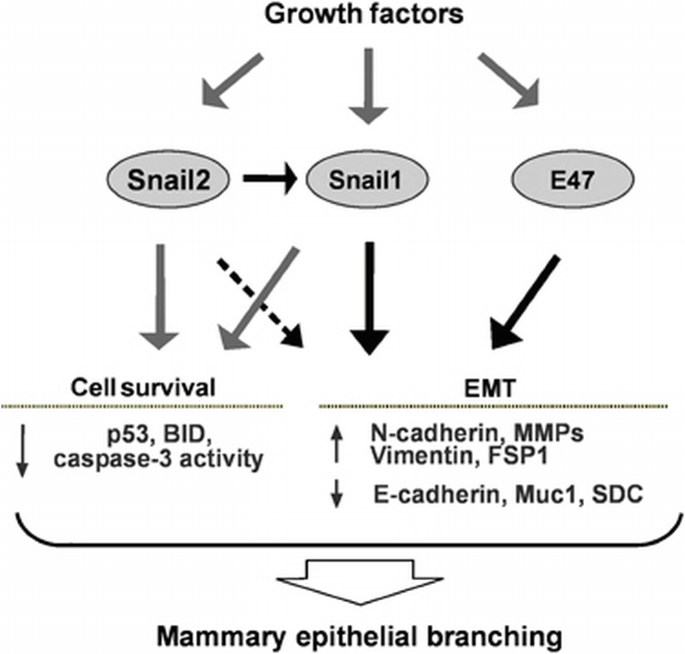
The role of Snail1, Snail2, and E47 in mammary epithelial branching morphogenesis. Mammary epithelial tissues are quiescent in the absence of exogenous stimuli. In response to growth factor stimulation, mammary epithelial cells located at branch sites express Snail1, Snail2, and E47 to induce expression of mesenchymal markers and promote cell survival. Consequently mammary epithelial cells initiate branching.
Materials and methods
Cell culture
Functionally normal EpH4 mouse mammary epithelial cells (Reichmann et al., 1989; Brinkmann et al., 1995) were maintained in growth medium comprising DMEM/F12 (Hyclone) supplemented with 2% heat‐inactivated fetal bovine serum (Atlanta Biologicals), 50 μg/ml gentamicin (Sigma), and 5 μg/ml insulin (Sigma). Cells were grown in a 37°C incubator with 5% CO2.
Preparation and branching of cell clusters
Clusters of mammary epithelial cells were prepared by overnight shaking (180 r.p.m. at 37°C for 15 h) in the presence of 0.083% (w/v) of pluronic F108 (BASF). Cell clusters of ∼100 μm in diameter were collected by centrifugation (200 r.p.m. for 1 min) and embedded within 4 mg/ml of non‐pepsinized native type I collagen (Koken) which was gelled as described previously (Nelson et al., 2006). A cell‐free layer of collagen was placed underneath the layer containing clusters. Growth media including no growth factor, EGF (4.2 nM, Invitrogen), or HGF (4.2 nM, Sigma) was added to the samples. Branching was quantified by counting the percentage of branching clusters, where branching phenotype was defined as a cell cluster having at least two independent extensions longer than 50 μm. Cells were isolated from collagen gels using collagenase (400 units/ml; Sigma) and used for RNA extraction.
Quantitative real‐time PCR
Total RNA was extracted using TRIzol (Invitrogen) according to the manufacturer's protocol. A 1‐μg aliquot of total RNA was reverse transcribed using Verso cDNA kit (Thermo Scientific) and qRT–PCR was performed using iQ SYBR Green Supermix and iCycler Real‐time PCR Detection System (Bio‐Rad). Primers for Snail1, Snail2, E47, vimentin, MMP3, MMP9, FSP1, E‐cadherin, N‐cadherin, Muc‐1, SDC‐1, p53, BID, and β‐actin mRNA (Supplementary Table 1) were designed using Beacon Designer software (Bio‐Rad) and determined to be specific by BLAST and dissociation curve analysis. The expression level of each mRNA was normalized to that of β‐actin in the same sample.
shRNA and expression constructs
shRNA targeting the Mus musculus sequences of Snail1 (NM_011427), Snail2 (NM_011415), E47 (NM_011548), and Twist1 (NM_011658) was purchased from Open Biosystems (Supplementary Table 2). Control scrambled shRNA was obtained from AddGene (plasmid 1864; Sarbassov et al., 2005). Mouse Snail1, Snail2, E47, and YFP open reading frames were amplified using specific primers (Supplementary Table 3) and cloned into p3xFlag‐CMV‐7.1 vector (Sigma) using _Bam_HI and _Eco_RI restriction sites.
Immunoblot analysis
Whole cell lysates were prepared from EpH4 mammary epithelial cells transfected with p3xFlag‐YFP, ‐Snail1, ‐Snail2, or ‐E47 or untransfected control using RIPA buffer (50 mM Tris–Cl (pH 7.5), 150 mM NaCl, 1 mM EDTA, 1 mM EGTA, 0.1% SDS, 1% NP‐40, 1% sodium deoxycholate, 1 mM DTT, 1 mM Na3VO4, 10 mM NaF, 1 mM PMSF, and protease inhibitor cocktail). Immunoblot analysis was performed using antibodies against Flag (Sigma), Snail1 (Cell Signaling), Snail2 (Cell Signaling), E47 (Abcam), E‐cadherin (Cell Signaling), p53 (Cell Signaling), and β‐actin (Cell Signaling).
Microfabricated mammary epithelial tubules
Elastomeric stamps of poly(dimethylsiloxane) (PDMS; Sylgard 184, Ellsworth Adhesives) containing a relief of the desired tissue geometry were fabricated using a combination of photolithography and soft lithography as previously described (Nelson et al., 2008; Gomez and Nelson, 2011). Briefly, stamps were rendered non‐adhesive by coating with 1% bovine serum albumin in phosphate‐buffered saline (PBS). Stamps were placed atop a drop of collagen, which was then gelled as described above. After removing the stamps, a suspension of EpH4 mouse mammary epithelial cells was allowed to settle within the moulded collagen cavities. The extra cells were washed away with growth medium and a gelled collagen lid was placed on top of the sample. The epithelial cells formed tubular tissues of the shape and size of the collagen cavities, and remained quiescent until they were induced to branch by adding growth factor.
Imaging and immunofluorescence analysis
The branching pattern from microfabricated tubules was measured as described previously (Nelson et al., 2006). Briefly, samples were fixed (4% formaldehyde in PBS, 15 min), stained for nuclei using Hoechst 33342 (Invitrogen), and visualized using a Hamamatsu Orca CCD camera attached to a Nikon Eclipse Ti microscope. The binarized images of ∼50 tubules were stacked with ImageJ software to obtain a pixel frequency map, which was subsequently colour‐coded in Adobe Photoshop. All experiments were conducted at least four times. Branching was quantified by measuring the pixel intensity within frequency maps 12 μm from the ends of the initial tubule, as previously described (Gjorevski and Nelson, 2010).
For immunofluorescence analysis, samples were fixed, permeabilized (0.1% Triton X‐100 in PBS, 15 min), and incubated with 10% goat serum (Atlanta Biologicals) for 1 h. Samples were then incubated with primary antibodies against Snail1, Snail2, E47, vimentin (Sigma), E‐cadherin, cleaved caspase‐3 (Cell Signaling), and p53 followed by incubation with Alexa Fluor‐conjugated secondary antibodies (Invitrogen).
References
- Aman A, Piotrowski T (2010) Cell migration during morphogenesis. Dev Biol 341: 20–33
Google Scholar - Barrallo‐Gimeno A, Nieto MA (2005) The Snail genes as inducers of cell movement and survival: implications in development and cancer. Development 132: 3151–3161
Google Scholar - Brinkmann V, Foroutan H, Sachs M, Weidner KM, Birchmeier W (1995) Hepatocyte growth factor/scatter factor induces a variety of tissue‐specific morphogenic programs in epithelial cells. J Cell Biol 131: 1573–1586
Google Scholar - Cano A, Perez‐Moreno MA, Rodrigo I, Locascio A, Blanco MJ, del Barrio MG, Portillo F, Nieto MA (2000) The transcription factor snail controls epithelial‐mesenchymal transitions by repressing E‐cadherin expression. Nat Cell Biol 2: 76–83
Google Scholar - Carver EA, Jiang R, Lan Y, Oram KF, Gridley T (2001) The mouse Snail gene encodes a key regulator of the epithelial‐mesenchymal transition. Mol Cell Biol 21: 8184–8188
Google Scholar - Chen CS, Nelson CM, Khauv D, Bennett S, Radisky ES, Hirai Y, Bissell MJ, Radisky DC (2009) Homology with vesicle fusion mediator syntaxin‐1a predicts determinants of epimorphin/syntaxin‐2 function in mammary epithelial morphogenesis. J Biol Chem 284: 6877–6884
Google Scholar - Chen ZF, Behringer RR (1995) Twist is required in head mesenchyme for cranial neural tube morphogenesis. Genes Dev 9: 686–699
Google Scholar - Chi X, Michos O, Shakya R, Riccio P, Enomoto H, Licht JD, Asai N, Takahashi M, Ohgami N, Kato M, Mendelsohn C, Costantini F (2009) Ret‐dependent cell rearrangements in the Wolffian duct epithelium initiate ureteric bud morphogenesis. Dev Cell 17: 199–209
Google Scholar - Côme C, Arnoux V, Bibeau F, Savagner P (2004) Roles of the transcription factors snail and slug during mammary morphogenesis and breast carcinoma progression. J Mammary Gland Biol Neoplasia 9: 183–193
Google Scholar - Comijn J, Berx G, Vermassen P, Verschueren K, van Grunsven L, Bruyneel E, Mareel M, Huylebroeck D, van Roy F (2001) The two‐handed E box binding zinc finger protein SIP1 downregulates E‐cadherin and induces invasion. Mol Cell 7: 1267–1278
Google Scholar - Ewald AJ, Brenot A, Duong M, Chan BS, Werb Z (2008) Collective epithelial migration and cell rearrangements drive mammary branching morphogenesis. Dev Cell 14: 570–581
Google Scholar - Fata JE, Mori H, Ewald AJ, Zhang H, Yao E, Werb Z, Bissell MJ (2007) The MAPK(ERK‐1,2) pathway integrates distinct and antagonistic signals from TGFalpha and FGF7 in morphogenesis of mouse mammary epithelium. Dev Biol 306: 193–207
Google Scholar - Friedl P, Gilmour D (2009) Collective cell migration in morphogenesis, regeneration and cancer. Nat Rev Mol Cell Biol 10: 445–457
Google Scholar - Gjorevski N, Nelson CM (2010) Endogenous patterns of mechanical stress are required for branching morphogenesis. Integr Biol 2: 424–434
Google Scholar - Gomez EW, Chen QK, Gjorevski N, Nelson CM (2010) Tissue geometry patterns epithelial‐mesenchymal transition via intercellular mechanotransduction. J Cell Biochem 110: 44–51
Google Scholar - Gomez EW, Nelson CM (2011) Lithographically‐defined two‐ and three‐dimensional tissue microarrays. In Biological Microarrays, Khademhosseini A, Suh K‐Y, Zourob M (eds) Totowa, NJ: Humana Press
- Gray RS, Cheung KJ, Ewald AJ (2010) Cellular mechanisms regulating epithelial morphogenesis and cancer invasion. Curr Opin Cell Biol 22: 1–11
Google Scholar - Gumbiner BM (2005) Regulation of cadherin‐mediated adhesion in morphogenesis. Nat Rev Mol Cell Biol 6: 622–634
Google Scholar - Hirai Y, Lochter A, Galosy S, Koshida S, Niwa S, Bissell MJ (1998) Epimorphin functions as a key morphoregulator for mammary epithelial cells. J Cell Biol 140: 159–169
Google Scholar - Ilina O, Friedl P (2009) Mechanisms of collective cell migration at a glance. J Cell Sci 122: 3203–3208
Google Scholar - Kajita M, McClinic KN, Wade PA (2004) Aberrant expression of the transcription factors snail and slug alters the response to genotoxic stress. Mol Cell Biol 24: 7559–7566
Google Scholar - Kalluri R, Neilson EG (2003) Epithelial‐mesenchymal transition and its implications for fibrosis. J Clin Invest 112: 1776–1784
Google Scholar - Kalluri R, Weinberg RA (2009) The basics of epithelial‐mesenchymal transition. J Clin Invest 119: 1420–1428
Google Scholar - Khalil AA, Friedl P (2010) Determinants of leader cells in collective cell migration. Integr Biol 2: 568–574
Google Scholar - Kouros‐Mehr H, Werb Z (2006) Candidate regulators of mammary branching morphogenesis identified by genome‐wide transcript analysis. Dev Dyn 235: 3404–3412
Google Scholar - Larsen M, Wei C, Yamada KM (2006) Cell and fibronectin dynamics during branching morphogenesis. J Cell Sci 119: 3376–3384
Google Scholar - Leroy P, Mostov KE (2007) Slug is required for cell survival during partial epithelial‐mesenchymal transition of HGF‐induced tubulogenesis. Mol Biol Cell 18: 1943–1952
Google Scholar - Liu Y, Martinez L, Ebine K, Abe MK (2008) Role for mitogen‐activated protein kinase p38 alpha in lung epithelial branching morphogenesis. Dev Biol 314: 224–235
Google Scholar - Micalizzi DS, Farabaugh SM, Ford HL (2010) Epithelial‐mesenchymal transition in cancer: parallels between normal development and tumor progression. J Mammary Gland Biol Neoplasia 15: 117–134
Google Scholar - Moreno‐Bueno G, Portillo F, Cano A (2008) Transcriptional regulation of cell polarity in EMT and cancer. Oncogene 27: 6958–6969
Google Scholar - Nelson CM, Bissell MJ (2005) Modeling dynamic reciprocity: engineering three‐dimensional culture models of breast architecture, function, and neoplastic transformation. Semin Cancer Biol 15: 342–352
Google Scholar - Nelson CM, Inman JL, Bissell MJ (2008) Three‐dimensional lithographically defined organotypic tissue arrays for quantitative analysis of morphogenesis and neoplastic progression. Nat Protoc 3: 674–678
Google Scholar - Nelson CM, Vanduijn MM, Inman JL, Fletcher DA, Bissell MJ (2006) Tissue geometry determines sites of mammary branching morphogenesis in organotypic cultures. Science 314: 298–300
Google Scholar - O'Brien LE, Zegers MM, Mostov KE (2002) Opinion: building epithelial architecture: insights from three‐dimensional culture models. Nat Rev Mol Cell Biol 3: 531–537
Google Scholar - Onodera T, Sakai T, Hsu JC, Matsumoto K, Chiorini JA, Yamada KM (2010) Btbd7 regulates epithelial cell dynamics and branching morphogenesis. Science 329: 562–565
Google Scholar - Peinado H, Olmeda D, Cano A (2007) Snail, Zeb and bHLH factors in tumour progression: an alliance against the epithelial phenotype? Nat Rev Cancer 7: 415–428
Google Scholar - Peinado H, Quintanilla M, Cano A (2003) Transforming growth factor beta‐1 induces snail transcription factor in epithelial cell lines: mechanisms for epithelial mesenchymal transitions. J Biol Chem 278: 21113–21123
Google Scholar - Perez‐Moreno MA, Locascio A, Rodrigo I, Dhondt G, Portillo F, Nieto MA, Cano A (2001) A new role for E12/E47 in the repression of E‐cadherin expression and epithelial‐mesenchymal transitions. J Biol Chem 276: 27424–27431
Google Scholar - Pollack AL, Runyan RB, Mostov KE (1998) Morphogenetic mechanisms of epithelial tubulogenesis: MDCK cell polarity is transiently rearranged without loss of cell‐cell contact during scatter factor/hepatocyte growth factor‐induced tubulogenesis. Dev Biol 204: 64–79
Google Scholar - Reichmann E, Ball R, Groner B, Friis RR (1989) New mammary epithelial and fibroblastic cell clones in coculture form structures competent to differentiate functionally. J Cell Biol 108: 1127–1138
Google Scholar - Revenu C, Gilmour D (2009) EMT 2.0: shaping epithelia through collective migration. Curr Opin Genet Dev 19: 338–342
Google Scholar - Sakai T, Larsen M, Yamada KM (2003) Fibronectin requirement in branching morphogenesis. Nature 423: 876–881
Google Scholar - Sarbassov DD, Guertin DA, Ali SM, Sabatini DM (2005) Phosphorylation and regulation of Akt/PKB by the rictor‐mTOR complex. Science 307: 1098–1101
Google Scholar - Simian M, Hirai Y, Navre M, Werb Z, Lochter A, Bissell MJ (2001) The interplay of matrix metalloproteinases, morphogens and growth factors is necessary for branching of mammary epithelial cells. Development 128: 3117–3131
Google Scholar - Sternlicht MD (2006) Key stages in mammary gland development: the cues that regulate ductal branching morphogenesis. Breast Cancer Res 8: 201
Google Scholar - Talanian RV, Quinlan C, Trautz S, Hackett MC, Mankovich JA, Banach D, Ghayur T, Brady KD, Wong WW (1997) Substrate specificities of caspase family proteases. J Biol Chem 272: 9677–9682
Google Scholar - Teddy JM, Kulesa PM (2004) In vivo evidence for short‐ and long‐range cell communication in cranial neural crest cells. Development 131: 6141–6151
Google Scholar - Tríbulo C, Aybar MJ, Sánchez SS, Mayor R (2004) A balance between the anti‐apoptotic activity of Slug and the apoptotic activity of msx1 is required for the proper development of the neural crest. Dev Biol 275: 325–342
Google Scholar - Vega S, Morales AV, Ocana OH, Valdes F, Fabregat I, Nieto MA (2004) Snail blocks the cell cycle and confers resistance to cell death. Genes Dev 18: 1131–1143
Google Scholar - Winklbauer R, Selchow A, Nagel M, Angres B (1992) Cell interaction and its role in mesoderm cell migration during Xenopus gastrulation. Dev Dyn 195: 290–302
Google Scholar - Xue Y, Smedts F, Ruijter ET, Debruyne FM, de la Rosette JJ, Schalken JA (2001) Branching activity in the human prostate: a closer look at the structure of small glandular buds. Eur Urol 39: 222–231
Google Scholar - Yang J, Mani SA, Donaher JL, Ramaswamy S, Itzykson RA, Come C, Savagner P, Gitelman I, Richardson A, Weinberg RA (2004) Twist, a master regulator of morphogenesis, plays an essential role in tumor metastasis. Cell 117: 927–939
Google Scholar - Zeisberg M, Neilson EG (2009) Biomarkers for epithelial‐mesenchymal transitions. J Clin Invest 119: 1429–1437
Google Scholar