Strong and persistent effect on liver fat with a Paleolithic diet during a two-year intervention (original) (raw)
Introduction
The prevalence of type 2 diabetes is steadily increasing worldwide. Obesity, mainly abdominal obesity, is associated with decreased insulin sensitivity and an increased risk for type 2 diabetes and cardiovascular disease.1
A link between abdominal adipose tissue accumulation and metabolic–cardiovascular risk may be non-alcoholic fatty liver disease (NAFLD), defined as a liver fat content greater than 5.6%.2 NAFLD affects 30% of the general population and 60–80% of individuals with diabetes and obesity, and has been suggested as a key marker for a metabolically unhealthy phenotype in obesity.3, 4 Notably, liver fat levels below the diagnostic threshold for NAFLD may also be associated with impaired insulin sensitivity.5 Moreover, the relationship between liver fat and insulin sensitivity exists independent of weight and the amount of visceral adipose tissue (VAT).6
Diet interventions that reduce body weight may ameliorate insulin resistance in patients diagnosed with obesity, but the mechanism by which weight loss improves metabolic balance remains unknown. A reduction in liver fat may be critical. Currently, the main strategy for reducing liver fat is to modify lifestyle by changing diet and increasing exercise.7 The combination of caloric and carbohydrate restriction decreases liver fat substantially within a couple of days,7 but long-term studies on liver fat reduction with diet interventions are lacking. Furthermore, there is a need for studies that control for physical activity and macronutrient intake.7
Recently, Haufe et al.8 showed that 6 months of a hypocaloric diet low in either carbohydrate or fat had similar effects in reducing liver fat. This beneficial effect was associated with changes in insulin sensitivity. Interestingly, a later follow-up (17–36 months from study start) showed that improvements in liver fat and insulin sensitivity persisted, despite weight regain during the observational period.8
A Paleolithic diet (PD) emphasizes a high intake of vegetables, fruit, nuts, eggs, fish and lean meat and excludes refined sugar, salt, dairy products and grains. By adhering to these recommendations, the intake of mono- and polyunsaturated fatty acids increases compared with a conventional low-fat diet (LFD).9, 10 Other diets high in mono- or polyunsaturated fatty acids have shown greater liver fat reduction when compared with conventional LFDs.11, 12 A PD improves glucose tolerance and other cardiovascular risk factors, independent of change in waist circumference during short-term studies.9, 13 Furthermore, a PD lowered HbA1c levels more than a consensus diet in a crossover study in patients with type 2 diabetes.9
Centrally located body fat is linked to a higher prevalence of NAFLD after menopause.14 We have recently reported a significant reduction in liver fat content after a 5-week ad libitum PD in 10 healthy, obese, postmenopausal women. Concomitantly, hepatic insulin sensitivity (Homeostasis model assessment-insulin resistance, HOMA-IR) improved.15 Therefore, we were interested in the long-term effects of a PD on liver fat and insulin sensitivity. Our hypothesis was that a PD would improve liver fat and insulin sensitivity more than a conventional LFD.
Materials and methods
Study design
Overweight postmenopausal women were randomized to either a PD or a conventional LFD. Examinations were performed at 0, 6 and 24 months.
Subjects and randomization
Study participants were recruited through advertisements in local newspapers and posters within the Umeå University Hospital area. We included women after menopause with a body mass index (BMI) above 27 kg m−2. Exclusion criteria were smoking, hypertension, heart disease, diabetes, kidney disease, osteoporosis, thyroid disease, and medication with statins or beta-blockers, allergy to a key component of the intervention diets or consumption of a restricted diet. In all, 210 women were interested in participating. Seventy fulfilled the inclusion criteria and were randomized (Figure 1). The randomization was carried out by a statistician blinded to the study with a block size of four and an allocation ratio of 1:1. There were no significant differences at baseline between the 41 included and the 29 excluded participants (data not shown). Nurses and technicians who carried out the examinations were blinded to group affiliation. Also the researchers conducting the statistical analyses were blinded. The study protocol was approved by the Regional Ethics Review Board at Umeå University, Umeå, Sweden and was in accordance with the Helsinki declaration. All participants gave written informed consent before inclusion.
Figure 1
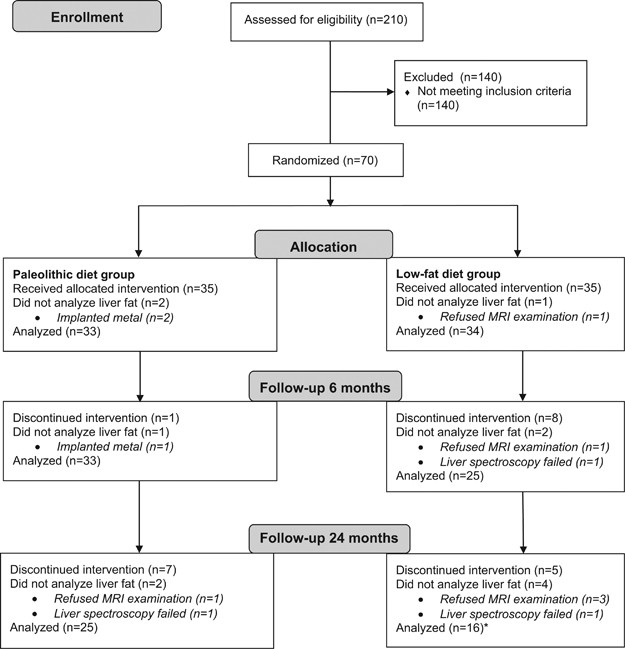
CONSORT flow diagram. *The main analysis in the LFD group was conducted with 16 subjects. Two additional subjects underwent liver spectroscopy at 24 months but did not have data from baseline/6 months. These individuals were included in a separate analysis including all available liver fat data.
Diet intervention
The PD was based on fish, seafood, lean meat, eggs, nuts, fruits and vegetables. Cereals, dairy products, legumes, added salt and sugar were excluded. The PD aimed to provide 40 E% as fat with a high intake of mono- and polyunsaturated fatty acids. 30 E% were planned to come from carbohydrates and 30 E% from protein.
The conventional LFD was based on the Nordic Nutrition Recommendations.16 The women were advised to increase their intake of fruit, vegetables, whole grain and fish. Meat and dairy products were to be low fat. The LFD aimed to provide 25–30 E% as fat, 55–60 E% as carbohydrates and 15 E% as protein.
Energy intake in both diet groups was ad libitum. Each study group met with a separate dietician on a regular basis but most frequently during the first 6 months. For details regarding diet validation, see Mellberg et al.10
Measurements of body composition
Weight was measured on a digital scale. Height was measured to the nearest 0.5 cm. Waist circumference was measured with a tape midway between the iliac crest and the lowest rib during gentle exhalation. Abdominal height was recorded at the umbilical level as the height of the abdomen measured when lying down on the examination couch with the legs straight. All measurements were performed after a 4-h fast.
Lean mass (kg), fat mass (kg) and body fat (%) were measured with dual energy X-ray absorptiometry (Lunar Prodigy X-ray Tube Housing Assembly, Brand BX-1L, Model 8743; GE Medical Systems, Madison, WI, USA) after a 4-h fast.
Measurement of physical activity energy expenditure
Physical activity energy expenditure was estimated using a heart rate monitor combined with an accelerometer (Actiheart, CamNtech Ltd, Cambridge, UK) as described previously.17, 18, 19
Measurement of liver fat and visceral/subcutaneous adipose tissue
VAT and subcutaneous adipose tissue (SAT) were measured with magnetic resonance imaging. Liver fat was determined by proton resonance spectroscopy. All magnetic resonance investigations were performed with a 1.5T ACS NT MR scanner (Philips, Best, The Netherlands). The details of the setup and measurement protocols have been described previously.15, 20, 21
Measurement of insulin sensitivity and glucose metabolism
Baseline blood samples (glucose and insulin) were drawn after overnight fasting. The participants were given a solution containing 75 g glucose to drink within 5 min. Blood samples for plasma glucose and plasma insulin were then drawn every 30 min for a total of 2 h. Hepatic insulin sensitivity was calculated as the liver insulin resistance (Liver IR) index (–0.091+(log area under the insulin curve from 0 to 120 min × 0.4)+(log % fat mass × 0.346)−(log high-density lipoprotein (HDL) × 0.408)+(log BMI × 0.435))22 and the HOMA-IR index ((fasting glucose × fasting insulin)/22.5).23 Based on our recent meta-analysis, the oral glucose insulin sensitivity (OGIS) and Matsuda indices were chosen as surrogate measures for peripheral insulin sensitivity.24, 25, 26
Measurement of blood lipids and blood pressure
Total cholesterol, triglycerides and HDL were analyzed at the Department for Clinical Chemistry, Umeå University Hospital, Umeå, Sweden. Low-density lipoprotein was calculated as (cholesterol−HDL−triglycerides)/2.2. Blood pressure was measured in the sitting position with an automated blood pressure meter (Boso Medicus, Bosch, Jungingen, Germany).
Statistical analyses
Generalized estimation equations were used to test differences between diet groups during the entire period of intervention. When the overall model effect was significant (P<0.05), analyses were conducted to determine whether the diet groups showed significant differences over the time periods of 0–6 months and/or 0–24 months. In addition, generalized estimation equations were used to analyze the change over time within each intervention group. Again, when the overall model effect was significant for the whole study period, we performed separate analyses for the 0–6 month and 0–24 month periods. Also, the difference between baseline values was assessed with generalized estimation equations. Before conducting the analyses, we logarithmically transformed the values for waist circumference, abdominal height, lean mass, fat mass, body fat, liver fat, fasting glucose, glucose 120 min after oral glucose tolerance test, fasting insulin, HOMA-IR, systolic blood pressure, diastolic blood pressure, triglycerides and HDL.
For correlation analyses, we used Spearman (_r_s) because not all variables were normally distributed. Data are also reported after Bonferroni corrections for the number of analyses. All statistical analyses were performed with IBM SPSS Statistics for Mac, Version 21.0 (IBM Corp, Armonk, NY, USA). Data are presented as means (s.d.) if not otherwise stated.
Results
Subject characteristics
The results from the diet intervention have been published separately.10 The study participants were 61 (2) years and 62 (6) years old, respectively (PD and LFD). They had a BMI of 32.6 (3.9) kg m−2 and 32.0 (2.7) kg m−2, respectively (PD and LFD). There was no difference in baseline characteristics between diet groups (Table 1). Physical activity energy expenditure did not change during the study.10
Table 1 Body composition, glucose metabolism, blood lipids and blood pressure
Body composition
Both diet groups lost weight and decreased their BMI, waist circumference, fat mass, VAT and SAT throughout the study (Table 1). At 6 months, the PD group showed a greater reduction in BMI, body fat (%), fat mass (kg) and SAT than the LFD group. However, the LFD group lost less lean mass compared with the PD group. At 24 months, there were no significant differences in body composition between diet groups except the better preservation of lean mass in the LFD group.
Liver fat
Both intervention groups reduced their liver fat significantly during the 24-month study period (Figure 2, Table 1). After the first 6 months, the PD group had a more pronounced liver fat reduction compared with the LFD group (Figure 2). In the LFD group, weight reduction was strongly associated with liver fat reduction (Figure 3). The strong correlation persisted (_r_s=0.58, _P<_0.05) even if calculated without a subject that reduced her weight by 17 kg and her liver fat by 14%. However, in the PD group weight reduction was not associated with liver fat reduction (Figure 3). After 6 months all individuals in the PD group had reduced their liver fat below 5% and 13 of the 25 participants below 1%. In the PD group, liver fat changes during the first 6 months of the study were strongly associated with baseline liver fat content (_r_s=0.92, P<0.001). These analyses used only data from individuals that had completed all liver fat examinations. Inclusion of all available liver fat data did not alter these results (data not shown).
Figure 2
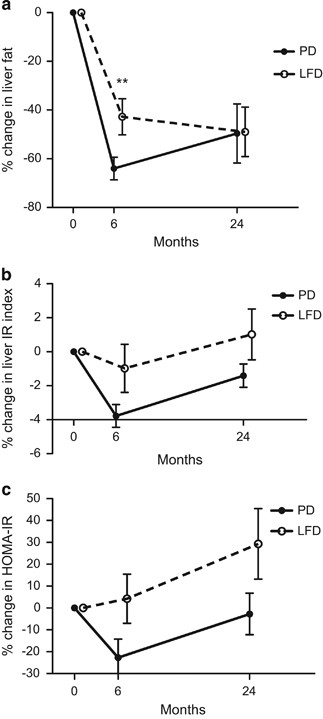
Relative changes of liver fat (a) and hepatic insulin sensitivity (b, c) after a PD compared with a conventional LFD in a 2-year intervention with postmenopausal obese women. Data represent mean relative changes in percent±s.e.m. **P<0.01.
Figure 3
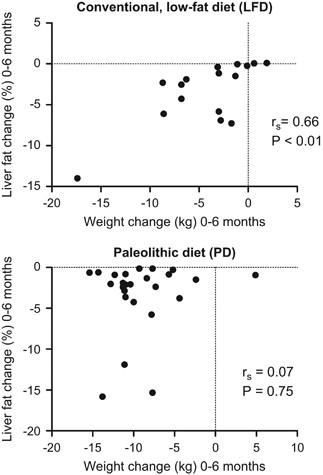
Association between changes observed in weight and liver fat during 6 months of a conventional LFD and a PD.
Insulin sensitivity
Hepatic insulin sensitivity measured with the Liver IR index and HOMA-IR improved significantly after 6 months in the PD group but not in the LFD group (Table 1). Between 6 and 24 months, hepatic insulin sensitivity deteriorated significantly in the PD group (P<0.001 for Liver IR index and HOMA-IR, respectively), with a similar trend in the LFD group. Peripheral insulin sensitivity improved non-significantly in both groups after the first 6 months (Table 1). The diet groups did not differ significantly regarding hepatic or peripheral insulin sensitivity after the intervention (Figure 2, Table 1). These analyses used only data from individuals that had completed all liver fat examinations. Inclusion of all available insulin sensitivity data did not influence the interpretation of the results to any major extent (data not shown).
Association between liver fat, VAT and insulin sensitivity
VAT and liver fat correlated with insulin sensitivity measures at baseline (Table 2). These results did not change after adjustment for BMI (data not shown). In contrast, SAT was not correlated with liver fat or insulin sensitivity measures at baseline.
Table 2 Correlations between body composition, liver fat, and insulin sensitivity at baseline
Changes in VAT and liver fat did not correlate significantly with changes in insulin sensitivity between baseline and 6 months (data not shown) and between baseline and 24 months (Table 3).
Table 3 Correlations between changes observed in body composition, liver fat and insulin sensitivity
When we compared participants with liver fat >10% at baseline with those with <5.6%, we found that women with more liver fat had a greater increase in hepatic and peripheral insulin sensitivity than those with low amounts of liver fat, but this difference was not significant (data not shown).
Blood lipids and blood pressure
Triglycerides, total cholesterol and low-density lipoprotein improved significantly more in the PD group during the first 6 months of the study (Table 1). At 24 months, both study groups showed an improvement of HDL (Table 1). Systolic blood pressure improved in both study groups at 6 months. However, diastolic blood pressure improved only in the PD group.
Discussion
Liver fat decreased more after 6 months of a PD compared with a conventional LFD in obese postmenopausal women. Hepatic insulin sensitivity improved after 6 months of PD. After 24 months of PD liver fat was still low, but hepatic insulin sensitivity had deteriorated between 6 and 24 months.
One may argue that greater liver fat reduction in the PD group compared with the LFD group depends on the difference in weight reduction between both groups. In fact, there is a strong correlation between weight reduction and liver fat improvement in the LFD group, but there was no such association in the PD group. After 6 months, all participants in the PD group had reduced their liver fat below 5%, but this was not the case for the LFD group. Other factors than weight loss and calorie restriction may therefore have an important role for this effect, that is, macronutrient composition and food quality. Westerbacka et al.27 showed that 2 weeks of an isocaloric LFD decreased liver fat content while an isocaloric diet with high fat content increased liver fat. In contrast, an isocaloric diet high in mono-unsaturated fatty acids was reported to reduce liver fat content in patients with diabetes.11 Moreover, a 6-week Mediterranean diet intervention improved insulin sensitivity and liver fat without weight reduction in individuals without diabetes.12 Preliminary analyses of serum fatty-acid composition suggest a significant increase in polyunsaturated fatty acids between baseline and 6 months in the PD group compared with the LFD group (Blomquist et al., unpublished data). Thus, the benefits we observed with the PD may be associated with its high content of polyunsaturated fatty acids. Notably, a recent meta-analysis confirmed that n-3 polyunsaturated fatty acids have a positive effect on liver fat content.28 Furthermore, Rosqvist et al.29 showed that overfeeding with either polyunsaturated or saturated fat resulted in weight gain, but only study participants overfed with saturated fat had increased liver fat. Another possible explanation for the difference in liver fat at 6 months is the lower amount of carbohydrates in the PD, which may cause decreased de novo lipogenesis.30
We found a clear divergence between changes in liver fat and changes in insulin sensitivity after diet intervention. Both liver fat and visceral fat had improved at the end of the study period. In contrast, hepatic insulin sensitivity improved initially but deteriorated between 6 and 24 months. Consistent with this finding, changes in liver fat content did not correlate with changes in insulin sensitivity.
A relationship between liver fat and hepatic insulin sensitivity was reported previously in individuals with type 2 diabetes,31 but this association may not be as clear-cut in individuals without diabetes.5, 32 In our cohort of overweight, postmenopausal women without diabetes, we found that liver fat content at baseline was moderately associated with hepatic insulin sensitivity. In line with this, both normal and impaired suppression of endogenous glucose production have been reported in subjects with NAFLD.6, 32
Whether accumulation of liver fat is the cause or consequence of hepatic insulin resistance remains unclear.33 We found an improvement in hepatic insulin sensitivity in the PD group after the first 6 months, which deteriorated between 6 and 24 months. Concomitantly, liver fat content decreased between baseline and 6 months but remained unaltered during the remaining study period. This finding is in line with earlier studies showing short-term effects on hepatic insulin sensitivity after gastric bypass surgery and a very low-calorie diet.34, 35 Thus, a profound change in energy balance may rapidly improve hepatic insulin sensitivity. We therefore analyzed the ketone body beta-hydroxybutyrate as a marker of negative energy balance, but found only a slight (non-significant) increase in beta-hydroxybutyrate in the PD group after 6 months (data not shown). This argues against a profound alteration in energy balance as a main factor underlying the metabolic improvement.
In the PD group, hepatic insulin sensitivity returned to baseline values from 6 to 24 months. Comparable results have been reported from studies on gastric bypass and a very low-calorie diet, in which a decrease in hepatic insulin sensitivity followed an initial improvement.34, 35 In contrast, liver fat continued to decrease on the very low-calorie diet until the end of the 8-week study.35
Haufe et al.36 found that insulin sensitivity improved with a concomitant decrease in liver fat after a hypocaloric, 6-month intervention with a diet reduced in either carbohydrates or fat. After 2 years, liver fat and hepatic insulin sensitivity remained improved compared with baseline levels. Notably, our participants were older than those in the Haufe et al. study, which may have influenced insulin sensitivity.37 This influence may include effects of menopause per se, because estrogen may have a protective effect against the development of liver steatosis.37 Furthermore, possible changes in fatty-acid patterns during the diet intervention are of interest for further studies as this can reflect alterations in compliance to especially the PD.
Taken together, the results indicate that hepatic insulin sensitivity and liver fat can change quickly after alterations in energy balance. However, after an initial rapid improvement, hepatic insulin sensitivity seems to deteriorate gradually, despite reduced intrahepatic fat levels.
At baseline, we found that VAT, liver fat and insulin sensitivity were closely related, as described previously.5, 8, 31, 32, 38, 39, 40 Therefore, the triad of VAT, liver fat and insulin sensitivity seems to be an important determinant of metabolic health, but this association was not consistent after our diet intervention. It may therefore be advisable in future studies to stratify by, for example, VAT (or waist circumference as a substitute) to eliminate potential differences between study groups at baseline.
Major strengths of our study include the combination of a long-term trial with reliable measurements of liver fat and visceral fat, with concomitant control of putatively confounding factors, such as changes in physical activity and different adherence to diets.10 Notably, protein intake did not differ between groups, despite different target levels, as estimated by nitrogen excretion in the urine.10 A limitation is the lack of quantification of the intake of different carbohydrates with a method that is more accurate than food records. Two separate dieticians introduced the study participants to the different diets. This may have introduced a bias. However, both dieticians had earlier experience of educating individuals in the respective diet. The aim was therefore to decrease the risk that the participants in the LFD group felt as participants in a control group. Furthermore, future detailed studies with clamp techniques for more precise estimations of hepatic and peripheral insulin sensitivity are of interest.
In conclusion, a PD had a significant and persistent effect on liver fat and differed significantly from a conventional LFD at 6 months. This difference may not be due to greater body weight reduction but to a difference in food quality, for example, a higher content of mono- and polyunsaturated fatty acids in the PD.
References
- Global Burden of Metabolic Risk Factors for Chronic Diseases Collaboration, Lu Y, Hajifathalian K, Ezzati M, Woodward M, Rimm EB et al. Metabolic mediators of the effects of body-mass index, overweight, and obesity on coronary heart disease and stroke: a pooled analysis of 97 prospective cohorts with 1.8 million participants. Lancet 2014; 383: 970–983.
Article Google Scholar - Szczepaniak LS, Nurenberg P, Leonard D, Browning JD, Reingold JS, Grundy S et al. Magnetic resonance spectroscopy to measure hepatic triglyceride content: prevalence of hepatic steatosis in the general population. Am J Physiol Endocrinol Metab 2005; 288: E462–E468.
Article CAS Google Scholar - Ratziu V, Bellentani S, Cortez-Pinto H, Day C, Marchesini G . A position statement on NAFLD/NASH based on the EASL 2009 special conference. J Hepatol 2010; 53: 372–384.
Article Google Scholar - Fabbrini E, Yoshino J, Yoshino M, Magkos F, Tiemann Luecking C, Samovski D et al. Metabolically normal obese people are protected from adverse effects following weight gain. J Clin Invest 2015; 125: 787–795.
Article Google Scholar - Korenblat KM, Fabbrini E, Mohammed BS, Klein S . Liver, muscle, and adipose tissue insulin action is directly related to intrahepatic triglyceride content in obese subjects. Gastroenterology 2008; 134: 1369–1375.
Article CAS Google Scholar - Seppälä-Lindroos A, Vehkavaara S, Häkkinen AM, Goto T, Westerbacka J, Sovijärvi et al. Fat accumulation in the liver is associated with defects in insulin suppression of glucose production and serum free fatty acids independent of obesity in normal men. J Clin Endocrinol Metab 2002; 87: 3023–3028.
Article Google Scholar - Thoma C, Day CP, Trenell MI . Lifestyle interventions for the treatment of non-alcoholic fatty liver disease in adults: a systematic review. J Hepatol 2012; 56: 255–266.
Article Google Scholar - Haufe S, Haas V, Utz W, Birkenfeld AL, Jeran S, Bohnke J et al. Long-lasting improvements in liver fat and metabolism despite body weight regain after dietary weight loss. Diabetes Care 2013; 36: 3786–3792.
Article CAS Google Scholar - Jonsson T, Granfeldt Y, Ahren B, Branell UC, Palsson G, Hansson et al. Beneficial effects of a Paleolithic diet on cardiovascular risk factors in type 2 diabetes: a randomized cross-over pilot study. Cardiovasc Diabetol 2009; 8: 35.
Article Google Scholar - Mellberg C, Sandberg S, Ryberg M, Eriksson M, Brage S, Larsson C et al. Long-term effects of a Palaeolithic-type diet in obese postmenopausal women: a 2-year randomized trial. Eur J Clin Nutr 2014; 68: 350–357.
Article CAS Google Scholar - Bozzetto L, Prinster A, Annuzzi G, Costagliola L, Mangione A, Vitelli et al. Liver fat is reduced by an isoenergetic MUFA diet in a controlled randomized study in type 2 diabetic patients. Diabetes Care 2012; 35: 1429–1435.
Article CAS Google Scholar - Ryan MC, Itsiopoulos C, Thodis T, Ward G, Trost N, Hofferberth S et al. The Mediterranean diet improves hepatic steatosis and insulin sensitivity in individuals with non-alcoholic fatty liver disease. J Hepatol 2013; 59: 138–143.
Article CAS Google Scholar - Lindeberg S, Jönsson T, Granfeldt Y, Borgstrand E, Soffman J, Sjöström K et al. A Palaeolithic diet improves glucose tolerance more than a Mediterranean-like diet in individuals with ischaemic heart disease. Diabetologia 2007; 50: 1795–1807.
Article CAS Google Scholar - Volzke H, Schwarz S, Baumeister SE, Wallaschofski H, Schwahn C, Grabe HJ et al. Menopausal status and hepatic steatosis in a general female population. Gut 2007; 56: 594–595.
Article Google Scholar - Ryberg M, Sandberg S, Mellberg C, Stegle O, Lindahl B, Larsson C et al. A Palaeolithic-type diet causes strong tissue-specific effects on ectopic fat deposition in obese postmenopausal women. J Intern Med 2013; 274: 67–76.
Article CAS Google Scholar - Alexander J, Anderssen SA, Aro A, Becker W, Fogelholm M, Lyhne N et al. Nordic Nutrition Recommendations 2004, Integrating Nutrition and Physical Activity, 4th edn. Copenhagen: Norden, 2004.
Google Scholar - Stegle O, Fallert SV, MacKay DJ, Brage S . Gaussian process robust regression for noisy heart rate data. IEEE Trans Biomed Eng 2008; 55: 2143–2151.
Article Google Scholar - Brage S, Westgate K, Wijndaele K, Godinho J, Griffin S, Wareham N . Evaluation Of A Method For Minimizing Diurnal Information Bias In Objective Sensor Data. 3rd International Conference on Ambulatory Monitoring of Physical Activity and Movement; June 17-19, 2013; Amherst, MA, USA, 2013.
- Brage S, Ekelund U, Brage N, Hennings MA, Froberg K, Franks PW et al. Hierarchy of individual calibration levels for heart rate and accelerometry to measure physical activity. J Appl Physiol (1985) 2007; 103: 682–692.
Article Google Scholar - Bolinder J, Ljunggren O, Kullberg J, Johansson L, Wilding J, Langkilde AM et al. Effects of dapagliflozin on body weight, total fat mass, and regional adipose tissue distribution in patients with type 2 diabetes mellitus with inadequate glycemic control on metformin. J Clin Endocrinol Metab 2012; 97: 1020–1031.
Article CAS Google Scholar - Kullberg J, Ahlstrom H, Johansson L, Frimmel H . Automated and reproducible segmentation of visceral and subcutaneous adipose tissue from abdominal MRI. Int J Obes (Lond) 2007; 31: 1806–1817.
Article CAS Google Scholar - Vangipurapu J, Stancakova A, Kuulasmaa T, Paananen J, Kuusisto J, Ferrannini E et al. A novel surrogate index for hepatic insulin resistance. Diabetologia 2011; 54: 540–543.
Article CAS Google Scholar - Matthews DR, Hosker JP, Rudenski AS, Naylor BA, Treacher DF, Turner RC . Homeostasis model assessment: insulin resistance and beta-cell function from fasting plasma glucose and insulin concentrations in man. Diabetologia 1985; 28: 412–419.
Article CAS Google Scholar - Mari A, Pacini G, Murphy E, Ludvik B, Nolan JJ . A model-based method for assessing insulin sensitivity from the oral glucose tolerance test. Diabetes Care 2001; 24: 539–548.
Article CAS Google Scholar - Matsuda M, DeFronzo RA . Insulin sensitivity indices obtained from oral glucose tolerance testing: comparison with the euglycemic insulin clamp. Diabetes Care 1999; 22: 1462–1470.
Article CAS Google Scholar - Otten J, Ahren B, Olsson T . Surrogate measures of insulin sensitivity vs the hyperinsulinaemic-euglycaemic clamp: a meta-analysis. Diabetologia 2014; 57: 1781–1788.
Article CAS Google Scholar - Westerbacka J, Lammi K, Hakkinen AM, Rissanen A, Salminen I, Aro et al. Dietary fat content modifies liver fat in overweight nondiabetic subjects. J Clin Endocrinol Metab 2005; 90: 2804–2809.
Article CAS Google Scholar - Parker HM, Johnson NA, Burdon CA, Cohn JS, O'Connor HT, George J . Omega-3 supplementation and non-alcoholic fatty liver disease: a systematic review and meta-analysis. J Hepatol 2012; 56: 944–951.
Article CAS Google Scholar - Rosqvist F, Iggman D, Kullberg J, Cedernaes J, Johansson HE, Larsson et al. Overfeeding polyunsaturated and saturated fat causes distinct effects on liver and visceral fat accumulation in humans. Diabetes 2014; 63: 2356–2368.
Article Google Scholar - Neuschwander-Tetri BA . Hepatic lipotoxicity and the pathogenesis of nonalcoholic steatohepatitis: the central role of nontriglyceride fatty acid metabolites. Hepatology 2010; 52: 774–788.
Article Google Scholar - Gastaldelli A, Cusi K, Pettiti M, Hardies J, Miyazaki Y, Berria R et al. Relationship between hepatic/visceral fat and hepatic insulin resistance in nondiabetic and type 2 diabetic subjects. Gastroenterology 2007; 133: 496–506.
Article CAS Google Scholar - Bugianesi E, Gastaldelli A, Vanni E, Gambino R, Cassader M, Baldi S et al. Insulin resistance in non-diabetic patients with non-alcoholic fatty liver disease: sites and mechanisms. Diabetologia 2005; 48: 634–642.
Article CAS Google Scholar - Perry RJ, Samuel VT, Petersen KF, Shulman GI . The role of hepatic lipids in hepatic insulin resistance and type 2 diabetes. Nature 2014; 510: 84–91.
Article CAS Google Scholar - Bojsen-Moller KN, Dirksen C, Jorgensen NB, Jacobsen SH, Serup AK, Albers PH et al. Early enhancements of hepatic and later of peripheral insulin sensitivity combined with increased postprandial insulin secretion contribute to improved glycemic control after Roux-en-Y gastric bypass. Diabetes 2014; 63: 1725–1737.
Article Google Scholar - Lim EL, Hollingsworth KG, Aribisala BS, Chen MJ, Mathers JC, Taylor R . Reversal of type 2 diabetes: normalisation of beta cell function in association with decreased pancreas and liver triacylglycerol. Diabetologia 2011; 54: 2506–2514.
Article CAS Google Scholar - Haufe S, Engeli S, Kast P, Bohnke J, Utz W, Haas V et al. Randomized comparison of reduced fat and reduced carbohydrate hypocaloric diets on intrahepatic fat in overweight and obese human subjects. Hepatology 2011; 53: 1504–1514.
Article CAS Google Scholar - Shulman GI . Ectopic fat in insulin resistance, dyslipidemia, and cardiometabolic disease. N Engl J Med 2014; 371: 1131–1141.
Article Google Scholar - Cnop M, Landchild MJ, Vidal J, Havel PJ, Knowles NG, Carr DR et al. The concurrent accumulation of intra-abdominal and subcutaneous fat explains the association between insulin resistance and plasma leptin concentrations: distinct metabolic effects of two fat compartments. Diabetes 2002; 51: 1005–1015.
Article CAS Google Scholar - Ross R, Aru J, Freeman J, Hudson R, Janssen I . Abdominal adiposity and insulin resistance in obese men. Am J Physiol Endocrinol Metab 2002; 282: E657–E663.
Article CAS Google Scholar - Koda M, Kawakami M, Murawaki Y, Senda M . The impact of visceral fat in nonalcoholic fatty liver disease: cross-sectional and longitudinal studies. J Gastroenterol 2007; 42: 897–903.
Article Google Scholar
Acknowledgements
We thank the women who participated in this study and research nurses Inger Arnesjö and Katarina Iselid for their invaluable contributions. We would like to thank Marie Eriksson of the Department of Statistics, Umeå University, Sweden, for advice on statistics, and Elin Chorell of the Department of Public Health and Clinical Medicine, Umeå University, for analyzing beta-hydroxybutyrate. This study was supported by grants from The Swedish Council for Working Life and Social Research (2006-0699 and 2010-0398), the Swedish Research Council (K2011-12237-15-6), the Swedish Heart and Lung Foundation, King Gustaf V and Queen Victoria’s Foundation, the Swedish Diabetes Research Foundation, the County Council of Västerbotten and Umeå University, Sweden.
Author contributions
JO performed the statistical analysis, interpreted the data, drafted the figure and tables and wrote the manuscript. CM recruited participants, collected the data, performed the statistical analysis and wrote the manuscript. MR recruited participants, collected the data and edited the manuscript. SS recruited participants and collected the data. JK analyzed the VAT and SAT data. CL and BL designed the study and interpreted the data. JH analyzed the liver spectroscopy data. TO designed the study, recruited participants, collected the data, interpreted the data and wrote the manuscript. All authors actively participated in revising the paper and gave approval of the final version. JO is the guarantor of this work and, as such, had full access to all the data in the study and takes responsibility for the integrity of the data and the accuracy of the data analysis.
Author information
Author notes
- J Otten and C Mellberg: These authors contributed equally to this work.
Authors and Affiliations
- Department of Public Health and Clinical Medicine, Umeå University, Umeå, Sweden
J Otten, C Mellberg, M Ryberg, S Sandberg, B Lindahl & T Olsson - Department of Radiology, Uppsala University, Uppsala, Sweden
J Kullberg - Department of Food and Nutrition, and Sport Science, University of Gothenburg, Gothenburg, Sweden
C Larsson - Center for Medical Technology and Radiation Physics, Umeå University Hospital, Umeå, Sweden
J Hauksson
Authors
- J Otten
- C Mellberg
- M Ryberg
- S Sandberg
- J Kullberg
- B Lindahl
- J Hauksson
- T Olsson
Corresponding author
Correspondence toJ Otten.
Ethics declarations
Competing interests
The authors declare no conflict of interest.
Rights and permissions
About this article
Cite this article
Otten, J., Mellberg, C., Ryberg, M. et al. Strong and persistent effect on liver fat with a Paleolithic diet during a two-year intervention.Int J Obes 40, 747–753 (2016). https://doi.org/10.1038/ijo.2016.4
- Received: 28 June 2015
- Revised: 16 November 2015
- Accepted: 09 December 2015
- Published: 20 January 2016
- Issue date: May 2016
- DOI: https://doi.org/10.1038/ijo.2016.4