Application of an integrated physical and functional screening approach to identify inhibitors of the Wnt pathway (original) (raw)
Abstract
Large‐scale proteomic approaches have been used to study signaling pathways. However, identification of biologically relevant hits from a single screen remains challenging due to limitations inherent in each individual approach. To overcome these limitations, we implemented an integrated, multi‐dimensional approach and used it to identify Wnt pathway modulators. The LUMIER protein–protein interaction mapping method was used in conjunction with two functional screens that examined the effect of overexpression and siRNA‐mediated gene knockdown on Wnt signaling. Meta‐analysis of the three data sets yielded a combined pathway score (CPS) for each tested component, a value reflecting the likelihood that an individual protein is a Wnt pathway regulator. We characterized the role of two proteins with high CPSs, Ube2m and Nkd1. We show that Ube2m interacts with and modulates β‐catenin stability, and that the antagonistic effect of Nkd1 on Wnt signaling requires interaction with Axin, itself a negative pathway regulator. Thus, integrated physical and functional mapping in mammalian cells can identify signaling components with high confidence and provides unanticipated insights into pathway regulators.
Synopsis
Large‐scale proteomic approaches have been used successfully to study signalling pathways (Kabuyama et al, 2004; Moffat and Sabatini, 2006). However, identification of biologically relevant hits from a single screen remains challenging due to limitations inherent in each individual approach (Hakes et al, 2008; Stelzl and Wanker, 2006). To overcome these limitations, we implemented an integrated, multi‐dimensional approach and used it to identify Wnt pathway modulators.
For the physical mapping of a Wnt interactome, we used the LUMIER protein‐protein interaction method (Barrios‐Rodiles et al, 2005), which measures the interaction of a Firefly luciferase‐tagged bait with Flag‐tagged preys in mammalian cells (Figure 2A). Eleven cytoplasmic mediators of Wnt signals, β‐catenin, Dishevelled (Dvl) 1, 2 and 3, Axin1 and 2, glycogen synthase kinase (GSK) 3β, casein kinase (CK) 1α and 1ε and Naked (Nkd) 1 and 2, were tagged with Firefly luciferase for use as baits and screened for interactions with a library of 640 3XFlag‐tagged cDNAs. The data were used to generate a network map comprised of 829 protein‐protein interactions between 11 baits and 265 Flag‐tagged preys (Figure 2B and C).
In order to complement this interaction map, we carried out two functional screens to determine the effect of altering the expression of each of the proteins encoded by the Flag‐tagged cDNA library on Wnt‐dependent transcription. As a functional readout of the canonical Wnt pathway, we used the Wnt3A‐responsive transcriptional reporter, TOPflash, which is comprised of three LEF/TCF binding sites located upstream of the Firefly luciferase gene. We first examined the effect on transcription upon protein overexpression by transfecting cells with plasmids encoding each individual Flag‐tagged cDNA. Next, we examined the effect on signalling upon abrogation of the expression of each of these genes using siRNAs. Each screen was run in the presence and absence of Wnt3A ligand and analysis of normalised data revealed both known and novel Wnt pathway regulators.
Initial comparison of the two functional screens and the protein interaction screen suggested that a number of hits were common in multiple screens (Figure 4A). To integrate the three data sets, we developed the combined pathway (CP) score, a value that reflects the likelihood that a tested gene is a component of the signalling pathway of interest. For this, _P_‐values were derived from each data set and converted to a condition‐specific confidence score for each individual gene, ranging from 0 to 15. For each gene, this resulted in 15 individual scores; one for each bait in LUMIER, and two each for the functional screens run with and without Wnt3A. To ensure equal weighting of the three screens, we selected the maximum score achieved in each screen, and the sum of the three values was used to calculate the CP score. Analysis of the ranked scores revealed that while only 8.6% of all genes achieved a score of 15 or greater, over 89% of well‐established key Wnt pathway components present in the screen scored 15 or higher, demonstrating that CP scoring is highly predictive for Wnt pathway components (Figure 4B). Additional analysis of performance revealed that the CPS outperformed each of the individual screens in identifying true positives while maintaining low false positive rates (Figure 4C). Of the top ranked genes, we selected Ube2m and Nkd1 for further characterisation.
Ube2m is a member of the E2 ubiquitin‐conjugating enzyme family that transfer Nedd8, a ubiquitin‐like moiety, to target proteins (Petroski and Deshaies, 2005). Consistent with the screen data, we found that Ube2m interacts with β‐catenin and that Ube2m overexpression activates TOPflash. Ube2m overexpression increased both total β‐catenin and phospho‐β‐catenin levels. As phospho‐β‐catenin is an intrinsically unstable form that is targetted for degradation, the results suggested that the increase in β‐catenin levels may be due to a disruption in the SCF complex responsible for β‐catenin ubiquitination. As function of this complex is dependent on neddylation, we tested the effect of increasing Nedd8 levels in the presence of Ube2m overexpression and found that Nedd8 overexpression reversed the effect of Ube2m on TOPflash. These data suggest that Ube2m regulates β‐catenin expression by recruiting β‐catenin to the SCF complex, and that increasing Ube2mexpression impairs the ability of this complex to degrade β‐catenin.
We also characterised the role of Nkd1 as an inhibitor of Wnt signalling. Nkd1 was previously reported to be a Wnt inhibitor that interacts with Dvl (Yan et al, 46,47,), and consistent with this, our screening data showed that Nkd1 inhibits TOPflash and binds all three Dvls. In addition, we detected a novel interaction between Nkd1 and Axin. The histidine rich tail of Nkd1 was found to be crucial for association with Axin, and for inhibition of Wnt‐dependent TOPflash activity. To test whether the association of Nkd1 with Axin was required for the inhibitory activity of Nkd1 on Wnt signalling, we tested the effect of Nkd1 overexpression in the presence and absence of Axin. Knockdown of Axin impaired the ability of Nkd1 to repress TOPflash, suggesting that this interaction is crucial for the repressive effect of Nkd1 on Wnt transcriptional activity. As both Nkd1 and Axin are Wnt responsive genes this suggests a model whereby Wnt induces expression of both inhibitors, which then cooperate to downregulate Wnt pathway signals.
In summary, determination of a Combined Pathway Score (CPS) allows integration of high throughput screens that examine physical and functional behaviors of individual proteins, and thereby enhances the selection of physiologically relevant pathway components. The novel insights gained into Wnt signalling using CP scoring demonstrates the power of our integrated mammalian‐cell based physical and functional mapping method. In addition to Wnt, this approach can be applied to diverse signalling pathways to facilitate the identification of novel regulators and gain fresh insight into pathway function.
Abstract
- A new statistical measure, the combined pathway score (CPS), was developed to integrate independent screen data sets and identify novel regulators of signalling pathways.
- We applied this approach to identify modulators of the Wnt pathway by carrying out a physical protein‐protein interaction screen and two functional screens and then integrating the data using CPS.
- Ube2m was identified as a novel regulator of Wnt signalling that acts to modulate β‐catenin stability.
- Nkd1 was found to cooperate with Axin to repress Wnt signalling.
Introduction
Wnt signaling is a key regulator of developmental pathways, and alterations in the Wnt pathway are associated with numerous human diseases (Nusse, 2005; Clevers, 2006). At the core of the canonical Wnt signaling cascade is the regulation of β‐catenin levels by a destruction complex comprised of proteins including Axin and adenomatous polyposis coli (APC). In resting cells, β‐catenin is sequentially phosphorylated by casein kinase 1α and glycogen synthase kinase 3 (GSK3α or β) and is subsequently targeted for ubiquitin‐mediated degradation through the SCF/β‐TrCP complex (Nusse, 2005; Clevers, 2006). Activation of Wnt signaling induces hyperphosphorylation of Dishevelleds (Dvls) and this, through a poorly understood mechanism, ultimately leads to a rise in the levels of nuclear β‐catenin and activation of target gene expression (Nusse, 2005; Wallingford and Habas, 2005; Clevers, 2006). Although many Wnt target genes promote cell proliferation, others such as Axin and naked (Nkd) function in a negative autoregulatory loop that serves to block Wnt signaling (Logan and Nusse, 2004). Axin is thought to downregulate Wnt signaling by promoting formation of the β‐catenin destruction complex (Clevers, 2006), whereas Nkd1 seems to mitigate pathway initiation by sequestering Dvl (Yan et al, 2001a).
Aberrant activation of the Wnt pathway has been implicated in several cancers and is a contributing factor to almost 90% of colorectal tumors (Giles et al, 2003). Consequently, there is considerable interest in the identification of negative regulators of the Wnt pathway as this may facilitate the development of new therapeutic strategies for colorectal and other cancers. Strategies that can be used to identify novel regulators of Wnt and other signal transduction pathways have been revolutionized by the advent of high‐throughput biology and the associated technologies (Kabuyama et al, 2004; Moffat and Sabatini, 2006; Preisinger et al, 2008). Proteins function in complexes, thus large‐scale proteomic approaches involving protein–protein interaction mapping such as LUMIER, yeast two‐hybrid or affinity‐purification coupled to mass spectroscopy provide a fruitful exploratory approach (Cusick et al, 2005; Stelzl and Wanker, 2006; Gingras et al, 2007; Kocher and Superti‐Furga, 2007; Preisinger et al, 2008). Moreover, mammalian cell‐based functional screens such as RNA interference (RNAi) are now frequently used to identify signaling mediators (Moffat and Sabatini, 2006; Iorns et al, 2007). In the case of the Wnt pathway, several studies have used individual high‐throughput methods to identify novel regulators of Wnt signaling (DasGupta et al, 2005; Liu et al, 2005; Stelzl et al, 2005; Angers et al, 2006; Bartscherer et al, 2006; Luo et al, 2007; Major et al, 2007, 2008; Tang et al, 2008). However, identifying biologically relevant associations from primary screens remains challenging due to experimental and theoretical limitations inherent in each individual approach (Cusick et al, 2005; Stelzl and Wanker, 2006; Hakes et al, 2008). For instance, yeast two‐hybrid mapping of the mammalian interactome has been initiated (Rual et al, 2005; Stelzl et al, 2005), but the overlap in independently derived maps is low, necessitating methods of assigning confidence scores to identified protein interactions (Cusick et al, 2005; Stelzl and Wanker, 2006; Braun et al, 2009). In parallel, genome‐wide RNAi screens to identify new components in pathways or biological activities of interest are also well underway (Iorns et al, 2007), though these screens have been criticized for the overabundance of false positives (Moffat and Sabatini, 2006). Although it is well recognized that integration of diverse data sets can enhance the prediction of relevant signaling effectors, in practice, combining data from diverse sources can be difficult. Thus, despite computational efforts to improve hit selection (Hakes et al, 2008), on completion of a single screen, researchers typically undertake lengthy secondary studies to validate identified hits using methods distinct from that used in the original screen.
To address these limitations, we have developed an integrated approach using both physical protein–protein interaction mapping and functional transcriptional regulation screens to enhance identification of biologically relevant signaling components. We applied this approach to identify modulators of Wnt signaling from a focused subset of 640 genes, enriched in intracellular signaling components. Integration of the heterogenous data sets yielded combined pathway scores (CPSs) for each component, a predictive score that reflects the likelihood that an individual protein is a Wnt pathway regulator. We show that this integrated approach provides enhanced screening performance as compared with individual screens and led to new insights into the mechanisms of negative regulation of the Wnt pathway. Specifically, we characterized two inhibitors, Ube2m and Nkd1, and show that Ube2m modulates the levels of β‐catenin protein, and that a previously unknown interaction of Nkd1 with Axin is required for the inhibitory function Nkd1.
Results
Analysis of protein–protein interactions in the Wnt pathway using LUMIER
To develop an integrated screening method to identify Wnt signaling pathway components, we undertook three independent high‐throughput screens that coupled physical mapping of protein–protein interactions to functional screens assessing transcriptional regulation (Figure 1). For the physical mapping of a Wnt interactome, we used the LUMIER method. In LUMIER, proteins of interest are fused to Renilla (Barrios‐Rodiles et al, 2005) or Firefly (herein) luciferase and the association with Flag‐tagged proteins coexpressed in mammalian HEK293T cells assessed by performing a luciferase assay on anti‐Flag immunoprecipitates collected using an automated robotics platform (Figure 2A). Eleven cytoplasmic mediators of Wnt signals, including β‐catenin, Dvl 1, 2 and 3, Axin1 and 2, GSK3β, casein kinase (CK) 1α and 1ε and Naked (Nkd) 1 and 2, were tagged with Firefly luciferase for use as baits. Overall structural integrity of the fusion proteins was confirmed by examining their interactions with known protein partners using a manual LUMIER assay (Supplementary Figure 1). These baits were screened for interactions with a library of 640 3XFlag‐tagged cDNAs comprised of an augmented version (Supplementary Data Set 1) of the earlier described cDNA library that encodes proteins comprised of diverse signaling‐associated domains (Barrios‐Rodiles et al, 2005). To detect interactions that may be dependent on ligand stimulation, we determined the interaction of luciferase‐tagged components with each Flag‐tagged cDNA in the absence (duplicate runs) or presence of Wnt3A (single run) for a total of over 21 000 tests. Normalized data are visualized in Figure 2B, where the color intensity reflects the interaction determined as the fold‐change over the median, or median‐based Luminescence Intensity Ratio (mLIR). To evaluate screen performance, the experimental false positive rate was determined by subjecting 88 protein pairs, representing interactions with a wide range of mLIR values, for repeat analysis by manual LUMIER. Of these, 80 and 90% of interactions with mLIR values >2 or 3, respectively, were reproduced (Supplementary Table 1), indicating that interactions with average mLIR screen values above 2 are experimentally reliable. Analysis of screen negatives as compared with interactions reported in the literature (Supplementary Table 2) revealed a false negative rate of 40% at an mLIR value cutoff of 2, a rate comparable to that reported earlier for LUMIER screening of the TGFβ pathway (Barrios‐Rodiles et al, 2005). Missed interactions are likely due to cell‐type‐specific interactions, steric interference caused by the epitope tags, the presence of splice‐variants lacking the appropriate interaction domain or erroneous literature reports. Of note, comparisons of LUMIER results with earlier studies aimed at identifying β‐catenin, Dvl and Axin protein partners using mass spectroscopy‐based methods (Angers et al, 2006; Major et al, 2007), revealed that 12 of 13 reported interactions assayed by LUMIER were recapitulated (Supplementary Table 3). Although the sample size is small (Supplementary Table 4), the screen did not detect interactions known to occur through indirect mechanisms such as the association of Axin1 with Akt1 in the presence of Dvl1 (Fukumoto et al, 2001), thereby suggesting that in a high‐throughput format, LUMIER preferentially identifies direct protein partners. Thus, given the low rate of experimental false positives (20%) and to minimize false negative rates, we selected an mLIR value cutoff of 2 to build a LUMIER‐based protein–protein Wnt pathway interaction network. This network is comprised of 829 protein–protein interactions between 11 baits and 265 Flag‐tagged preys (Figure 2C) most of which are previously unreported interactions. Although, LUMIER requires protein overexpression and thus may yield biologically irrelevant positives overexpression often permits the detection of weak or transient interactions or those occurring between low abundance proteins (Barrios‐Rodiles et al, 2005). Thus, the PPI network generated from LUMIER provides evidence for the potential involvement of a protein partner in the Wnt pathway, and is an ideal starting point for additional functional analysis to establish biological relevance.
Figure 1
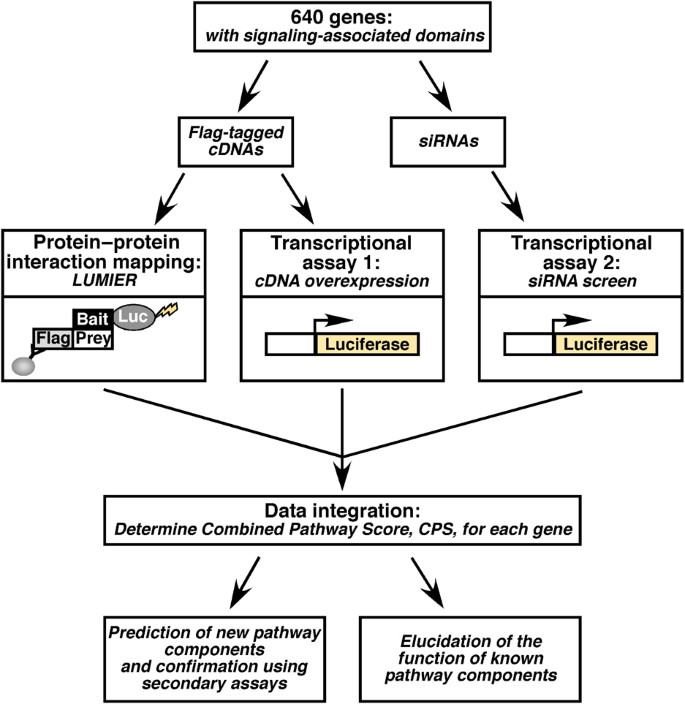
Schematic of an integrated, multi‐dimensional approach to identify signaling pathway components. Genes harboring cell signaling‐associated domains were randomly selected and then used to generate libraries of corresponding Flag‐tagged cDNAs and siRNAs. These were then used in three high‐throughput screens to map protein–protein interactions by LUMIER and to examine the effect of altering protein expression levels on a transcriptional reporter. The data from the three screens were integrated to derive a combined pathway score (CPS), which predicts the likelihood that a protein is a component of the signaling pathway being studied.
Figure 2
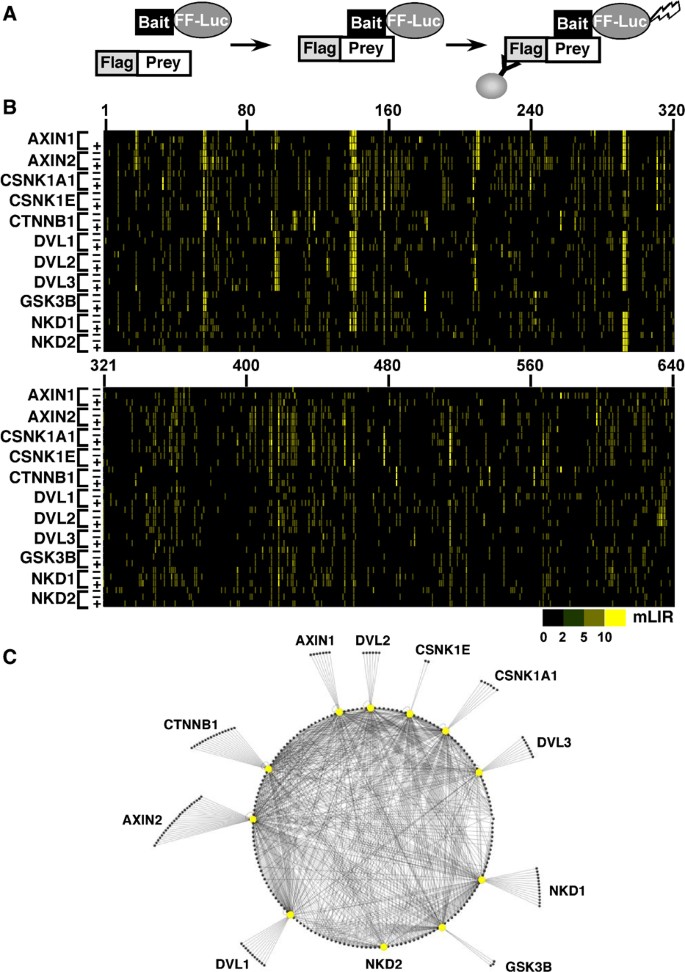
High‐throughput screening of protein–protein interactions of the Wnt pathway. (A) The LUMIER assay involves coexpression of a Flag‐tagged prey and Firefly luciferase (FF‐Luc)‐tagged bait in mammalian cells. An interaction is detected by α‐Flag immunoprecipitation followed by measurement of luciferase activity. (B) Results of the LUMIER screen of the Wnt pathway. Luciferase‐tagged baits (left) were screened against 640 Flag‐tagged cDNAs (numbered across top) in the absence (−) or presence (+) of Wnt3A‐conditioned media. The mLIR score for each interaction is represented by colors according to the indicated scale. (C) The Wnt interactome as defined by LUMIER. Interactions with an mLIR >2 in at least 2 of 3 runs or in the single Wnt3A run, and with a total average mLIR of >2 are visualized with Cytoscape (Shannon et al, 2003). The complete network is shown as a circular representation with baits represented by large yellow nodes, preys as small nodes and interactions by edges.
Functional analysis of Wnt signaling
To complement the map of physical interactions, we carried out two functional screens to determine the effect of altering the expression of each of the proteins encoded by the Flag‐tagged cDNA library of preys on transcriptional regulation in the same cell system (HEK293T). As a functional readout of the canonical Wnt pathway, we used the Wnt3A‐responsive transcriptional reporter, TOPflash, which is comprised of three LEF/TCF binding sites driving the expression of the Firefly luciferase gene (Korinek et al, 1997). We first examined the effect of protein overexpression by transfecting cells with plasmids encoding each individual Flag‐tagged cDNA. TOPflash reporter activity in the absence and presence of Wnt3A in duplicate runs was determined by measuring luciferase activity, which was then normalized for transfection efficiency with a coexpressed β‐galactosidase reporter gene (Figure 3A). Comparisons of replicate runs revealed good correlation (Figure 3A) and manual repeats of a small subset confirmed results from the high‐throughput screen (data not shown). Analysis of normalized data revealed that known positive regulators, such as β‐catenin, Dvl1 and LEF1 ectopically activated the reporter in the absence of Wnt3A, whereas negative regulators, such as Axin2 and GSK3β, decreased ligand‐mediated stimulation of the reporter (Figure 3A). Using relaxed hit selection criteria of an average increase of >1.5‐fold or decrease of <0.6‐fold relative to the run median, we found that of the 640 cDNAs examined, 15% enhanced basal or Wnt‐induced reporter activity whereas 8% inhibited Wnt‐induced signaling.
Figure 3
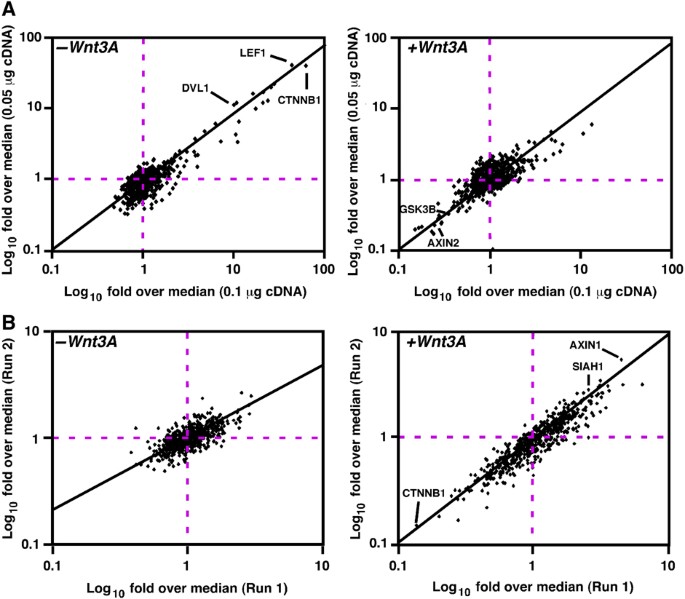
RNAi and overexpression screens for Wnt pathway modulators. Modulation of TOPflash activity by overexpression or RNA‐mediated abrogation of expression of specific genes was used to identify regulators of the Wnt pathway. Data are shown as scatterplot comparisons of fold over median values from two runs with the indicated concentrations of cDNAs (A) or replicate siRNA screens (B) conducted in the absence (left panels) or presence of Wnt3A (right panels).
We next examined the effect on Wnt signaling of abrogating the expression of the endogenous protein corresponding to each of the genes encoded by the Flag‐tagged cDNA prey library. Cells were transfected with an siRNA pool that targets each individual gene and the effect on Wnt‐dependent TOPflash activity in duplicate runs in the presence or absence of Wnt3A was determined (Figure 3B). After data normalization, candidate Wnt pathway components were identified by their deviation from the run median using relaxed thresholds of >1.5‐fold above and <0.6‐fold below the screen median. As expected, RNAi‐mediated knock‐down of the expression of negative regulators such as Axin1 and Siah1 increased basal and/or Wnt3A‐induced signaling, whereas abrogation of the expression of essential pathway components such as β‐catenin, prevented Wnt3A‐dependent activation of TOPflash reporter activity (Figure 3B). RNAi‐based approaches have the notable advantage that the contribution of endogenous genes on signaling is directly assessed. However, besides the potential for off‐target or indirect effects on the targeted protein, the method is limited by the fact that incomplete gene knock‐down or redundant activities by highly related proteins can obscure the contribution of a component. Nevertheless, novel positive and negative regulators of canonical Wnt signaling were identified using this approach.
Data integration and the CPS
To explore methods for integrative analysis with the goal of facilitating the identification of novel pathway components, we first used straightforward Venn diagrams to overlay the results of the two functional screens and the LUMIER screen (Figure 4A). To ensure maximal identification of true positives, we used relaxed cutoffs as described above (Figures 2B and 4). This analysis revealed that 10 of 19 key pathway components (Supplementary Data Set 2) were found within the intersection of the three screens, whereas an additional six key components were located in the overlap region of two of three screens. These 16/19 positives were among a total of 169 hits found within the double and triple overlaps. In this analysis (Figure 4A), hit selection from individual screens following statistical analysis requires the selection of specific cutoffs before data integration. The disadvantage of this approach is that true positives that fall below the designated cutoffs, as the result of experimental and/or theoretical limitations of a particular screen, would be eliminated before the application of integrative analysis. Thus, to obviate the need to set arbitrary cutoffs for individual screens before data integration and to obtain a numerical measure of the likelihood that a protein is a bona fide component of the pathway, we next sought to develop a quantitative method to integrate the heterogenous data sets. For this we developed the CPS, a value that reflects the likelihood that a tested gene is a component of the signaling pathway of interest. Without assuming the normality of the data, we first converted raw experimental intensities into normalized log intensities using a robust _Z_‐score transformation. _P_‐values were derived and the negative log of combined _P_‐values were then used as a condition‐specific confidence score for each cDNA, ranging from 0 to 15, where a higher number indicates higher certainty that the observed intensity deviates from the norm. This yielded 15 condition‐specific scores, 11 for each bait in the LUMIER screen, and 4 for the individual control and Wnt3A‐treated cDNA and RNAi‐based transcriptional assays. Our objective was to identify those genes that display the highest probability of being novel Wnt pathway modulators, irrespective of the specific protein partner or the mode of function of the component in the pathway. Thus, we next calculated a single overall score for each cDNA by combining these condition‐specific confidence scores, a number we refer to as the CPS. To provide for equivalent weightings of each of the three screens (LUMIER, RNAi and cDNA overexpression), a single screen‐specific score, consisting of the maximal condition‐specific score achieved in each screen type, was determined. For example, in LUMIER, the highest score obtained for interaction with any one of the 11 baits was used. The sum of these three screen‐specific scores for each cDNA yielded the CPS, a quantitative indicator of the probability that a given cDNA is likely to be a component of the canonical Wnt pathway (Supplementary Data Set 3).
Figure 4
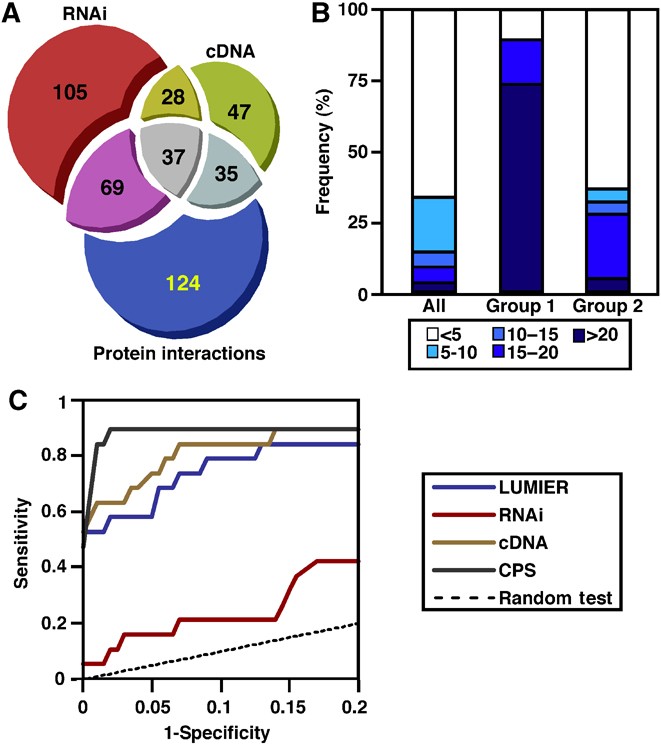
Integration of data from multiple screens. (A) A proportional Venn diagram (prepared with www.cs.kent.ac.uk/people/staff/pjr/EulerVennCircles/EulerVennApplet.html), indicating the number of hits in the LUMIER (as defined in Figure 2), RNAi and cDNA overexpression (where overexpression or knockdown gave an average fold over median >1.5 or <0.6 in the presence or absence of Wnt3A) and the degree of overlap. (B) Distribution of combined pathway scores (CPSs) of integrated screen data. The percentage of core (Group 1) and known (Group 2) components of the Wnt pathway and all tested genes (All) corresponding to the indicated CPS thresholds are shown. (C) Receiver operating characteristic (ROC) curves assessing screen and CPS performance. The sensitivity (true positives) versus 1‐specificity (false positives) is plotted for the integrated (CPS) and individual screens (cDNA, LUMIER and RNAi).
The maximum theoretical score achievable is 45 (15 in all 3 runs), though the most highly ranked known component, CSNK1D, scored 33. The maximal score in any one run is 15, thus genes with CPSs close to 15 may reflect either a very strong hit in a single screen, as for NKD2 (CPS=16), which had a LUMIER score of 15, or a lower score in multiple screens, such as RHOA (CPS=15.8) with scores of 7, 2 and 6.8 in LUMIER, RNAi and cDNA overexpression screens, respectively. To assess how well the CPS method performed, we first analyzed the distribution of ranked scores and observed that while only 8.6% of all genes achieved a score of 15 or greater, over 89% of well‐established key components essential for Wnt pathway function (group 1) present in the screen scored 15 or higher (Figure 4B). We also examined the distribution of 22 (group 2) components, which are known Wnt pathway regulators, but may not be essential for Wnt pathway function (Supplementary Data Set 2). We observed that over 27% of this group achieved CPSs of 15 or better (Figure 4B). Thus, the set of highly scoring genes were particularly enriched in Wnt pathway components.
To further evaluate performance, we generated receiver operating characteristic (ROC) curves, which are plots of sensitivity (true positives) versus 1‐specificity (false positives), using the key components (group 1) as true positives, and 200 randomly selected screened genes as false positives (Supplementary Data Set 2). This analysis revealed that the CPS outperformed each of the individual screens in identifying true positives while maintaining low false positive rates (Figure 4C; Supplementary Table 5). For example, in the CPS method, a true positive rate of 79% (obtained at a CPS of 18.9), yielded a false positive rate of only 0.5%, whereas in single screens the corresponding false positive rate ranged from 13 to 65%. Of note, calculating the CPS by weighting of the three distinct assays using Linear Discriminant Analysis did not significantly improve the predictive accuracy of the CPS (data not shown), so equivalent weighting of the three individual screens was retained.
Thus, the CPS is a sensitive, specific and predictive method and reveals that an integrative analysis method that dispenses with individual screen cutoffs is a powerful approach for identifying biologically relevant signaling components. Examination of the top scoring genes (CPS>18; Figure 5) identified eight genes that had not been previously associated with Wnt signaling as well as 21 known pathway components. From the 29 genes, we selected two that displayed differing scoring patterns but with high CPS, namely Ube2m, and a known component, Nkd1, for further characterization.
Figure 5
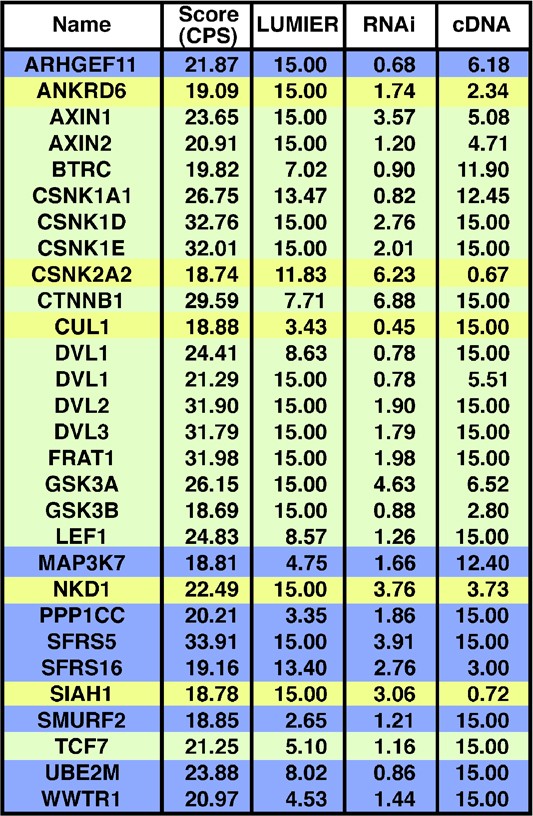
Top hits as defined by CPS. Scores for individual screens and the CPS are shown. Shading indicates known Group 1 (green), Group 2 (yellow) and putative novel (blue) pathway components. Full length and a splice variant of Dvl1 are shown.
Ube2M is a novel Wnt pathway component
Ube2m displayed a high CPS of 24, interacting specifically with β‐catenin in the LUMIER screen (Supplementary Figure 2A) and potently activating TOPflash when overexpressed but without effect in the RNAi screen, a scoring pattern similar to that obtained by GSK3B (Supplementary Data Set 1). Ube2m is a member of the E2 ubiquitin‐conjugating enzyme family that transfer the ubiquitin‐like moiety, Nedd8, to target proteins, most notably, cullins (Parry and Estelle, 2004; Petroski and Deshaies, 2005). Neddylation of cullins within E3 ligase complexes is essential for the ubiquitination of target substrates and it is the Cul1‐containing SCF/β‐TrCP complex that mediates β‐catenin degradation (Latres et al, 1999; Kawakami et al, 2001). Consistent with LUMIER, manual assays confirmed that Flag‐Ube2m interacted with β‐catenin‐FFluciferase as well as with endogenous β‐catenin (Figure 6A; Supplementary Figure 2B) and that overexpressed mouse or human Ube2M activated TOPflash in a dose‐dependent manner (Figure 6B; Supplementary Figure 2C) but not the mutated reporter, FOPflash (Supplementary Figure 2D). Of note, increased TOPflash activity was observed at levels of ectopically expressed Ube2m of only four‐fold over endogenous levels (Supplementary Figure 2C). Overexpression of Ube2m also stabilized total endogenous β‐catenin, the GSK3β/CK1 phosphorylated form and nonphosphorylated, active, β‐catenin (Figure 6C). As the phosphorylated form of β‐catenin is normally rapidly targetted for degradation, these results suggest that Ube2m overexpression disrupts the activity of the β‐catenin destruction complex.
Figure 6
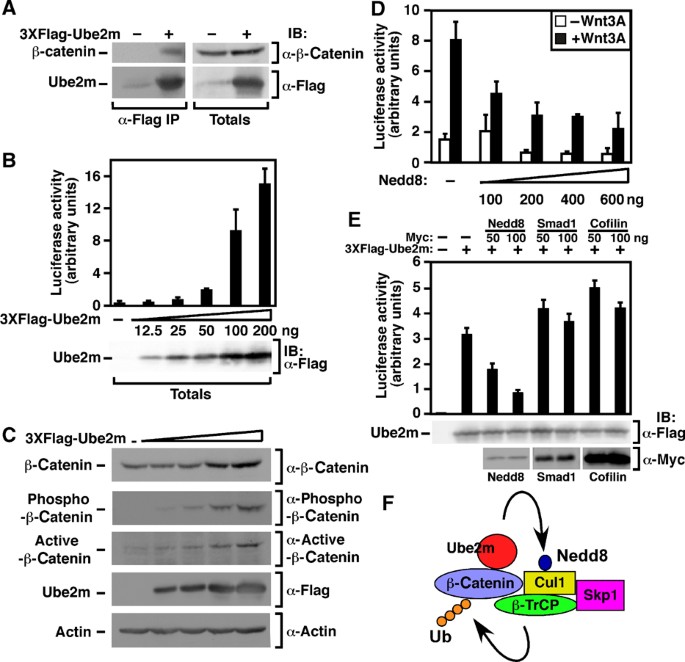
Ube2m is a Wnt pathway component. (A) Endogenous β‐catenin interacts with 3XFlag‐Ube2m. HEK293T cells were transfected with Flag‐tagged Ube2m or empty vector. Interactions were detected by anti‐Flag immunoprecipitation followed by anti‐β‐catenin immunoblotting. (B) Ube2m overexpression increases TOPflash activity. HEK293T cells were transfected with TOPflash and the indicated amounts of Ube2m. Promoter activity was measured by luciferase assay and data are shown as the mean of triplicate samples ±standard deviation. (C) Ube2m overexpression increases β‐catenin levels. HEK293T cells were transfected with increasing amounts of Flag‐Ube2m cDNA and β‐catenin levels were determined by anti‐β‐catenin, anti‐phospho‐β‐catenin or anti‐active‐β‐catenin immunoblotting. Actin levels were detected by immunoblotting as a loading control. (D, E) HEK293T cells were transfected with TOPflash and the indicated amounts of myc‐tagged Nedd8, Smad1 or cofilin in the absence (D) or presence (E) of Ube2m. Cells were treated with or without Wnt3A overnight. Promoter activity was measured by luciferase assay and the data are shown as the mean of duplicate (D) or triplicate (E) samples±standard deviation. (F) Model of the role of Ube2m in the degradation of β‐catenin by the β‐TrCP/SCF complex.
As neddylation of Cul1 occurs most efficiently in the context of a correctly assembled SCF complex (Read et al, 2000; Petroski and Deshaies, 2005; Bornstein et al, 2006; Chew and Hagen, 2007), overexpression of Ube2m may enhance signaling by interfering with neddylation within the β‐TrCP destruction complex. Indeed, overexpression of Nedd8 inhibited Wnt signaling and reversed activation by overexpressed Ube2m, while overexpression of Smad1 or cofilin, as controls, had no effect (Figure 6D and E). Furthermore, IL1‐induced NFκb reporter activation (Supplementary Figure 2E), which requires SCF/β‐TrCP‐mediated destabilization of the inhibitor IκBα (Read et al, 2000), was blocked by Ube2m overexpression, consistent with interference of SCF/β‐TrCP activity. These results suggest that alterations in the expression of components of the SCF/β‐TrCP complex can modulate the activity of Wnt signaling. Moreover, our demonstration that Ube2m interacts with β‐catenin, also suggests that efficient activity of the destruction complex may be facilitated by substrate‐dependent enhancement of Cul1 neddylation by recruitment of the neddylating enzyme, Ube2m (Figure 6F). As high levels of Ube2m enhance Wnt signaling, we speculate that enhanced expression in vivo has the possibility of contributing to Wnt‐induced diseases, such as cancer.
Nkd1 cooperates with Axin to inhibit the canonical Wnt signaling pathway
Nkd1 is a Wnt‐induced gene that functions as an antagonist of canonical Wnt signaling (Wharton et al, 2001; Yan et al, 2001a). Nkd1 interacts with Dvl and it has been suggested that this association is essential for the inhibitory effect of Nkd1 in the Wnt/β‐catenin pathway (Wharton et al, 2001; Yan et al, 2001a). However, Nkd1 mutants unable to antagonise the Wnt pathway still interact with Dvl (Yan et al, 2001a), suggesting that other Nkd1 binding partners may also contribute to the inhibitory effect of Nkd1 on Wnt signaling.
In our combined screen analysis, Nkd1 achieved a high CPS of 22.5 and, consistent with earlier studies, interacted with all three Dvls and repressed TOPflash activity (Supplementary Data Set 1). In addition, LUMIER also revealed a novel interaction between Nkd1 and the key Wnt inhibitor, Axin. To confirm the screen data, we tested the interaction between luciferase‐tagged Nkd1 and Flag‐tagged Axin 1 or 2 using manual LUMIER (Figure 7A). Nkd1 interacted efficiently with Axin1 and to a lesser extent Axin2. A similar association of Nkd1‐HA with 3XFlag‐Axin1 was detected by immunoprecipitation followed by immunoblotting (Supplementary Figure 3A). Moreover, an interaction between transfected Nkd1 and endogenous Axin1 in HEK293T cells was observed (Figure 7B). To determine the regions of Nkd1 required for association with Axin1, we prepared a series of Flag‐tagged Nkd1 deletion mutants (Figure 7C) and the ability of these mutants to bind luciferase‐tagged Axin1 was assessed using the LUMIER assay (Figure 7D). This analysis revealed that mutants lacking a 17 amino acid C‐terminal histidine‐rich tail did not bind Axin1. A similar mapping experiment to determine the regions of Nkd1 required for binding Dvl2 showed that mutants lacking the histidine‐rich tail retained interaction with Dvl2 (Supplementary Figure 3B) and consistent with earlier work (Rousset et al, 2002), deletion of internal domains of Nkd1, including the EF hand and flanking regions, disrupted the interaction between Nkd1 and Dvl2.
Figure 7
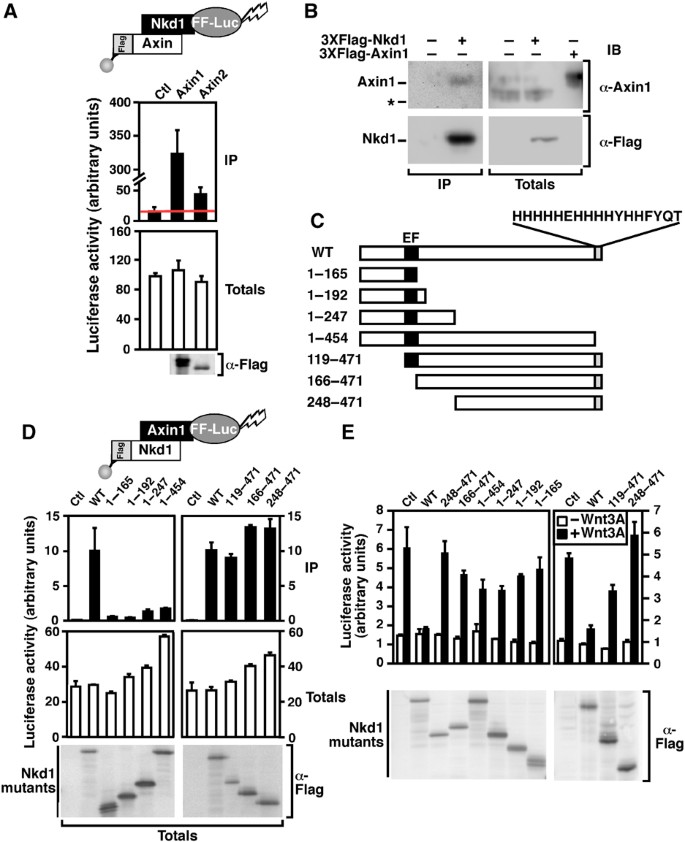
Nkd1 cooperates with Axin1 to inhibit the Wnt pathway. (A) Nkd1 interacts with Axin. HEK293T cells were transfected with luciferase‐tagged Nkd1 (Nkd1‐FF‐Luc) and 3XFlag‐tagged Axin1 or Axin2. Interactions were detected by luciferase assay following anti‐flag immunoprecipitation. Data are shown as the mean of two samples ±standard deviation. (B) Endogenous Axin1 interacts with 3XFlag‐Nkd1. HEK293T cells were transfected with Flag‐tagged Nkd1 or empty vector. Interactions were detected by anti‐Flag immunoprecipitation followed by immunoblotting. The migration of endogenous Axin was confirmed in total cell lysates by comparison with transiently transfected Axin1 (left two lanes). * Indicates a nonspecific band. (C) Schematic of Nkd1 deletion mutants and the amino acid sequence of the His‐rich carboxy‐terminus is shown. (D) Axin1 interacts with the C‐terminal His‐rich tail of Nkd1. HEK293T cells were transfected with luciferase‐tagged Axin1 (Axin1‐FF‐Luc) and the indicated Flag‐Nkd1 constructs. Cell lysates were subject to anti‐Flag immunoprecipitation and the presence of Axin1 was assessed by luciferase assay. Data are expressed as the mean of two samples±range. (E) Multiple regions of Nkd1 are required for efficient inhibition of TOPflash activity. HEK293T cells were transfected with TOPflash and the indicated Flag‐Nkd1 constructs. Cells were treated overnight with or without Wnt3A and TOPflash activity was measured by luciferase assay. Data are shown as the mean of two samples ±standard deviation.
Nkd1 overexpression inhibits Wnt3A‐dependent TOPflash activation (Supplementary Figure 3C). To identify the regions of Nkd1 required to mediate this effect, we next tested the ability of each of the Nkd1 deletion mutants to repress TOPflash activity in HEK293T cells. All of the Nkd1 deletion constructs displayed a severely impaired ability to repress TOPflash activity, including those that retain the ability to bind Dvl (Figure 7E). This suggests that in addition to the previously reported requirement for Dvl interaction (Yan et al, 2001a), Nkd1 interaction with Axin is required for maximal inhibition of TOPflash. We next focused on Axin1 and observed that abrogation of Axin1 expression by siRNA, increased Wnt3A‐dependent signaling as expected given the negative role of Axins in Wnt signaling (Figure 8A). Moreover, our analysis revealed that the Nkd1‐mediated inhibition of TOPflash was impaired in cells transfected with siRNAs targeting Axin1 compared with those transfected with control siRNA (Figure 8A). Decrease of Axin1 expression was confirmed by quantitative RT–PCR, with an average knockdown efficiency of almost 60% observed (Supplementary Figure 3D). Overall, these results reveal that the antagonistic activity of Nkd1 in the canonical Wnt signaling pathway is not only dependent on Dvl as previously thought, but also requires interaction with Axins. Given that the expression of Nkd1 and Axin2 is induced by Wnt pathway activation in many biological contexts (Yan et al, 2001b; Lustig et al, 2002; Koch et al, 2005) and that Nkd1 can interact with both Axin1 and Axin2, these data suggest the intriguing possibility of the existence of a novel reinforcing negative feedback loop where Wnt induces expression of both Nkd1 and Axin2, and that these two proteins in turn can physically interact and cooperate to repress Wnt signaling (Figure 8B).
Figure 8
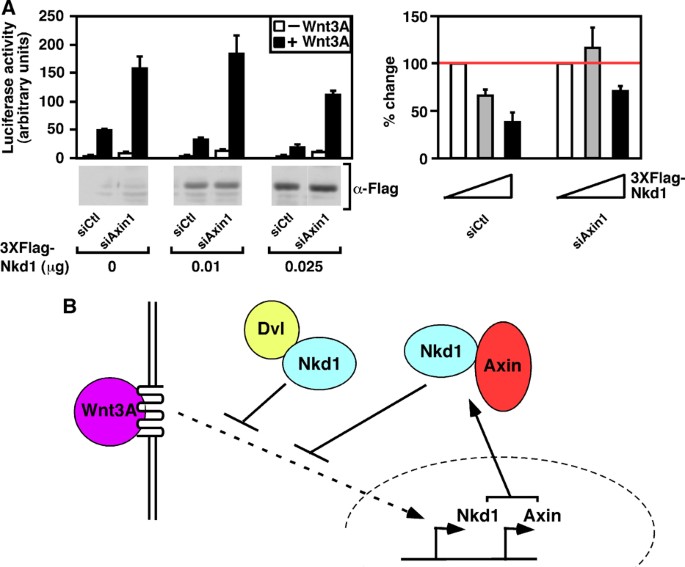
Nkd1 cooperates with Axin1 to inhibit the Wnt pathway. (A) Nkd1 and Axin1 cooperate to inhibit TOPflash. HEK293T cells were transfected with TOPflash, the indicated amount of 3XFlag‐Nkd1 and 20 nM control or Axin1‐targeting siRNA. Cells were treated overnight with or without Wnt3A and TOPflash activity was measured by luciferase assay. Data are shown as the mean of three samples (left panel) or percentage of control (right panel) ±standard deviation. (B) Model of inhibition of Wnt3A signaling by Nkd1 and Axin1 cooperation.
In summary, the identification of Ube2m as a regulator of β‐catenin stability and of Axin as a novel partner for Nkd1 demonstrates the utility of the application of CPS in providing new insights into signaling pathways. Together with our demonstration of enhanced performance in identifying known Wnt pathway effectors, these results demonstrate that our integrated mammalian cell‐based physical and functional mapping method is a powerful approach that can be applied to diverse pathways to facilitate identification of novel signaling regulators.
Discussion
Individual high‐throughput screening methods, such as protein‐interaction mapping or RNAi‐based functional screens, have been successfully applied to the investigation of signal transduction pathways (Kabuyama et al, 2004; Moffat and Sabatini, 2006; Preisinger et al, 2008). However, it is widely appreciated that there are experimental and/or theoretical limitations inherent in each individual approach. One way to overcome these limitations is to use multiple screening methods and integrate the divergent data sets. Indeed, several investigators have used multiple screening methods to verify hits obtained in a primary screen. For instance, in one study, hits obtained in a genome‐wide siRNA screen were verified using a series of secondary screening methods including a microarray‐based approach and by comparisons with protein interaction networks (Major et al, 2008). In a second study, a method was developed to assign confidence scores to protein–protein interactions detected by yeast‐two‐hybrid by using four alternative methods to test identified interacting partners (Braun et al, 2009). These approaches show great potential for strengthening hit selection from primary screens, especially in the elimination of false positives. However, they do not address the flaws in the primary screen that may lead to false negatives. Thus, an alternative approach for integrated screening is to carry out multiple independent screens to identify hits common to each. For instance, a recent study combined siRNA and small molecule screening methods to identify common protein targets (James et al, 2009). However, one limitation of each of these approaches is the necessity to specify cutoffs to define reliable high‐confidence interactions or activities. These cutoffs typically yield fewer false positives but overlook interactions or effects considered of lower confidence but that may be biologically relevant.
Here, we used an integrated approach that incorporates a physical interaction map and two functional screens and applied it to the Wnt signaling pathway. We developed the CPS as a means to integrate the three distinct data sets, which negated the need to use arbitrary cutoffs to define hits. We show that combining diverse data sets using CPS can provide a more robust estimation of biological relevance as the distinct advantages of each approach can serve to mitigate individual disadvantages. Indeed, CP scoring demonstrated enhanced performance as compared with individual screens in identifying known Wnt pathway components, while maintaining a low rate of false positives when compared with the individual screening methods. Thus, combining diverse data sets in this way serves as a powerful filter of artifactual hits that are inherent in individual screening strategies, such as off‐target effects in RNAi‐based methods. This represents a distinct advantage of integrated analysis as it facilitates triaging of hits before tertiary studies, which in the case of in vivo analysis is typically both lengthy and laborious.
Consistent with the expected enhanced selection of relevant components, application of this multi‐dimensional integrated approach led to the successful identification of proteins not previously known to be in the Wnt pathway. Smurf2 was one of the top scoring genes by CPS (Figure 4D), and elsewhere we showed that Smurf2 and Smurf1 are key regulators of noncanonical Wnt pathways (Narimatsu et al, 2009). Herein, we described the identification of Ube2m as a regulator of canonical Wnt signaling. Ube2m is a member of the E2 ubiquitin‐conjugating enzyme family that transfers Nedd8 to cullins, which are components of SCF complexes that function to ubiquitinate target substrates (Parry and Estelle, 2004; Petroski and Deshaies, 2005). Although a role for Ube2m in Wnt signaling may have been deduced given the requirement for SCF complexes in β‐catenin degradation, our examination of screen results and subsequent verification, revealed an interaction between Ube2m and the SCF complex substrate, β‐catenin suggesting that this association may contribute to targeting of β‐catenin by modulation of Cul1 neddylation. Indeed, other studies have shown that substrate‐bound Cul1 complexes are highly neddylated, though the molecular basis for this observation is still under active investigation (Merlet et al, 2009). Our analysis further revealed that modest changes in Ube2m expression can modulate Wnt signaling. On the basis of these findings, further investigation of a role for Ube2m in Wnt‐associated human diseases is warranted.
Our integrated screening method also provided new insights into the mechanisms of action of previously known pathway components, such as Nkd1. Naked family members were first characterized in Drosophila, where it was shown that mutants of the Naked cuticle (dNkd) gene display segmentation defects, including the replacement of denticles by excess secreted naked cuticle (Zeng et al, 2000). This phenotype resembles that of embryos exposed to excess Wingless (Wnt) ligand, and thus it was proposed that Nkd functions as an antagonist of Wnt signaling. Subsequent analysis of dNkd as well as the mammalian counterparts, Nkd1 and Nkd2 revealed that the interaction of Nkds with Dvls was important for the repressive effects on Wnt signaling (Wharton et al, 2001; Yan et al, 2001a; Rousset et al, 2002). However, the observation that Nkd mutants that retain Dvl binding were ineffective in blocking Wnt‐induced transcriptional responses (Yan et al, 2001a) suggested that the mechanism for the inhibitory activity of Nkds remained incompletely understood.
Here, we have shown that Nkd1 binds Axin1 and Axin2, two potent negative regulators of Wnt signaling. In Nkd1, this interaction is mediated by an unusual 17 amino acid carboxy‐terminal region comprised of 11 His residues, a domain that is essential for the negative effect of Nkd on Wnt‐dependent transcriptional activity. Moreover, we showed that reduction of Axin1 levels by siRNAs, impaired the ability of Nkd to inhibit Wnt‐dependent reporter activation. As loss of Dvl expression abrogates Wnt signaling, it was not possible to use a similar siRNA‐mediated approach to examine the requirement of Dvl in Nkd function. However, consistent with earlier literature, we observed that Nkd mutants unable to bind Dvl, do not block reporter activation. In earlier models, it was proposed that Nkd blocks Wnt signaling by sequestering Dvl, possibly by drawing Dvl into the competing noncanonical Wnt pathway (Yan et al, 2001a). However, our studies suggest that the maximal repressive effects of Nkd, requires association with both Dvl and Axin. Activated Dvl is thought to disrupt the β‐catenin destruction complex, of which Axin is a component, and we speculate that Nkd1 may act at this stage. Unfortunately, the mechanism whereby Dvl disrupts the complex remains mysterious thus the precise function of Nkd1 remains an area for further study.
Wnt signaling is critical for numerous developmental processes including the maintenance of the stem cell pool, all of which are processes, like tumorigenesis, in which changes in the level and duration of signal can have profound consequences (Logan and Nusse, 2004; Clevers, 2006). Consistent with this, numerous extracellular regulators, such as SFRP, Wisp1 and Dkk serve to limit excessive Wnt signaling. Moreover, a feature of Wnt pathway activation is the induction of the expression of intracellular negative regulators, including Nkd1 and Axin2 (Yan et al, 2001b). As our studies have demonstrated that Nkd1 requires Axin expression for maximal effect, it suggests that simultaneous Wnt‐dependent gene activation of these two interacting partners, which then cooperate to maximally inhibit Wnt signaling, can provide for a reinforcing negative regulatory loop that contributes to the precise control of Wnt pathway activation (Figure 8B).
In summary, we have shown that determination of a CPS, allows integration of physical and functional behaviors for each gene, and thereby enhances the selection of physiologically relevant pathway components. Although our screen was focused on the Wnt pathway, integration of our physical interaction map with functional screens using alternative reporters has the potential to provide rapid insights into other signaling pathways.
Materials and methods
cDNA and siRNA libraries
The previously described Flag‐tagged cDNA library (Barrios‐Rodiles et al, 2005) was augmented using cDNA templates obtained from the FANTOM1 mouse cDNA library or the Mammalian Gene Collection mouse or human libraries. To establish the identity of each cDNA, the closest matching human and mouse genes were determined by Blast searches using both the nucleotide sequence of the open reading frame and the corresponding amino acid sequence against the mouse and human databases. The top Blast hit was adopted as the identity of the cDNA. In instances where the amino acid and nucleotide Blast searches did not match, manual curation was used to determine the gene identity. This information was used to establish an siRNA library consisting of siRNAs that corresponded to the components of the cDNA library. All siRNAs were siGENOME pools purchased from Dharmacon. To indicate the library components that have previously been reported to be involved in Wnt signaling, we designated two groups of Wnt‐pathway component genes. Members of group 1 have been shown to be essential for the functioning of the Wnt pathway, while group 2 genes have shown to be involved but are not considered essential to pathway function.
LUMIER screens
High‐throughput protein interaction screens were carried out at the SMART Robotics Facility in Mount Sinai Hospital, Toronto (robotics.lunenfeld.ca) using the LUMIER assay as described earlier (Barrios‐Rodiles et al, 2005) with the following modifications. Baits were tagged with Firefly luciferase. HEK293T cells were manually seeded in poly‐L‐lysine coated 96‐well dishes at a density of 22 000 cells per well. Two days after transfection, cells were either left untreated or were stimulated for 3 h with Wnt3A‐conditioned media produced as described earlier (Labbe et al, 2007). Cells were lysed 170 μl of lysis buffer (50 mM Tris–HCl, 150 mM NaCl, 1 mM EDTA, 0.5% Triton X‐100, 1 mM DTT, 10% (vol/vol) glycerol) containing phosphatase and protease inhibitors. Aliquots of cell lysates were subjected to immunoprecipitation (100 μl) or were used directly (10 μl) for totals. After addition of luciferase substrate (75 μl for immunoprecipitation and 25 μl for totals), luciferase activity was measured on a chemiluminesence imaging plate reader (CLIPR, Molecular Devices, CA).
cDNA overexpression and RNAi TOPflash screens
HEK293T cells were manually seeded in poly‐L‐lysine coated 96‐well dishes at a density of 11 000 cells per well. Cells were transfected with 0.8 μl of Lipofectamine 2000 (Invitrogen), 75 ng of TOPflash, 25 ng of β‐galactosidase and either 100 ng Flag‐tagged cDNA (overexpression screen) or 57 nM siRNA (RNAi screen). Cells were treated with control medium or Wnt3A‐conditioned medium overnight and then lysed with 100 μl of lysis buffer (25 mM Tris, 2 mM DTT, 2 mM CDTA, 10% glycerol, 1% Triton X‐100). Aliquots of the lysate (10 μl) were used to read luciferase activity using a CLIPR and β‐galactosidase activity using an Envision reader (PerkinElmer).
cDNA constructs and siRNAs
All constructs were triple Flag‐tagged and taken from the cDNA library (Barrios‐Rodiles et al, 2005), with the exception of human UBE2M (untagged MGC clone BC058924) and Nkd1 mutants. Nkd1 deletions were prepared by identifying the regions of human Nkd1 corresponding to domains previously characterised in Drosophila (Rousset et al, 2002). Deletions mutants were then generated by PCR using full‐length Nkd1 as a template and inserting the products into pCMV5c via HindIII and BamHI restriction sites. The siRNA‐targeting Axin1 was an siGENOME pool purchased from Dharmacon, and the sequence for control siRNA was GGGCAAGACGAGCGGGAAG.
Immunoprecipitation and immunoblotting
HEK293T cells were transfected using calcium phosphate and immunoprecipitation (IP) and immunoblotting (IB) were carried out as described earlier (Labbe et al, 2000). Antibodies were used at the following dilutions: Flag (Sigma #F3165; 1:1000 IP, 1:2000 IB); Ube2m (Abnova #H00009040‐M01; 1:1000 IB); β‐catenin (BD Biosciences #610153; 1:1000 IB); Phospho‐β‐catenin (Cell Signalling Technology #9561; 1:1000 IB); active β‐catenin (Millipore #05‐665; 1:1000 IB); Axin1 (Signalling Technology #2087; 1:1000 IB); Actin (Sigma # A2066; 1:2000 IB).
Calculation of mLIR and thresholds
For the LUMIER screen, data were normalized to the plate‐based median to derive the mLIR. Two proteins were considered to interact if the mLIR was >2 in two of the three runs or in the single Wnt3A run, and the average mLIR of all three runs was >2. For the cDNA overexpression and RNAi screens, each data point was divided by the run median to derive the fold over median value. The average value of duplicate screens was calculated and a component was considered to modulate Wnt signaling if this average was >1.5 or <0.5.
Data analysis
For each cDNA, in each condition in each screen, we calculated a numerical _P_‐value as a measure of confidence that the observed effect deviated significantly from the median. For this, log‐transformed luciferase intensities from batches of 96‐well plates were normalized by subtracting the plate median log intensity and dividing by a robust estimate of the plate standard deviation. This estimate was the median absolute deviation (MAD) of the batch divided by the MAD of the standard normal distribution. We call these values normalized log intensity _Z_‐scores. Next, these _Z_‐scores were converted into _P_‐values using a standard normal cumulative distribution curve. For the LUMIER assay, we only calculated _P_‐values for the hypothesis that each _Z_‐score was significantly higher than the median; for all other assays, we calculated _P_‐values for both the lower and higher than the median single‐sided hypothesis. _P_‐values were thresholded at 10−15 and replicates were combined using Fisher's method and re‐thresholded. For all assays except LUMIER, the final _P_‐value was the minimum of two different sets of combined _P_‐values; one representing the hypothesis that all replicates were above the median, and one that all were below the median. Finally, the confidence score of each cDNA in each condition is the negative log10 of the final combined _P_‐value and thus ranges from 0 to 15. ROC curves were generated using SPSS.
References
- Angers S, Thorpe CJ, Biechele TL, Goldenberg SJ, Zheng N, MacCoss MJ, Moon RT (2006) The KLHL12‐Cullin‐3 ubiquitin ligase negatively regulates the Wnt‐beta‐catenin pathway by targeting Dishevelled for degradation. Nat Cell Biol 8: 348–357
Google Scholar - Barrios‐Rodiles M, Brown KR, Ozdamar B, Bose R, Liu Z, Donovan RS, Shinjo F, Liu Y, Dembowy J, Taylor IW, Luga V, Przulj N, Robinson M, Suzuki H, Hayashizaki Y, Jurisica I, Wrana JL (2005) High‐throughput mapping of a dynamic signaling network in mammalian cells. Science 307: 1621–1625
Google Scholar - Bartscherer K, Pelte N, Ingelfinger D, Boutros M (2006) Secretion of Wnt ligands requires Evi, a conserved transmembrane protein. Cell 125: 523–533
Google Scholar - Bornstein G, Ganoth D, Hershko A (2006) Regulation of neddylation and deneddylation of cullin1 in SCFSkp2 ubiquitin ligase by F‐box protein and substrate. Proc Natl Acad Sci USA 103: 11515–11520
Google Scholar - Braun P, Tasan M, Dreze M, Barrios‐Rodiles M, Lemmens I, Yu H, Sahalie JM, Murray RR, Roncari L, de Smet AS, Venkatesan K, Rual JF, Vandenhaute J, Cusick ME, Pawson T, Hill DE, Tavernier J, Wrana JL, Roth FP, Vidal M (2009) An experimentally derived confidence score for binary protein‐protein interactions. Nat Methods 6: 91–97
Google Scholar - Chew EH, Hagen T (2007) Substrate‐mediated regulation of cullin neddylation. J Biol Chem 282: 17032–17040
Google Scholar - Clevers H (2006) Wnt/beta‐catenin signaling in development and disease. Cell 127: 469–480
Google Scholar - Cusick ME, Klitgord N, Vidal M, Hill DE (2005) Interactome: gateway into systems biology. Hum Mol Genet 14 Spec No. 2: R171–R181
Google Scholar - DasGupta R, Kaykas A, Moon RT, Perrimon N (2005) Functional genomic analysis of the Wnt‐wingless signaling pathway. Science 308: 826–833
Google Scholar - Fukumoto S, Hsieh CM, Maemura K, Layne MD, Yet SF, Lee KH, Matsui T, Rosenzweig A, Taylor WG, Rubin JS, Perrella MA, Lee ME (2001) Akt participation in the Wnt signaling pathway through Dishevelled. J Biol Chem 276: 17479–17483
Google Scholar - Giles RH, van Es JH, Clevers H (2003) Caught up in a Wnt storm: Wnt signaling in cancer. Biochim Biophys Acta 1653: 1–24
Google Scholar - Gingras AC, Gstaiger M, Raught B, Aebersold R (2007) Analysis of protein complexes using mass spectrometry. Nat Rev Mol Cell Biol 8: 645–654
Google Scholar - Hakes L, Pinney JW, Robertson DL, Lovell SC (2008) Protein‐protein interaction networks and biology—what's the connection? Nat Biotechnol 26: 69–72
Google Scholar - Iorns E, Lord CJ, Turner N, Ashworth A (2007) Utilizing RNA interference to enhance cancer drug discovery. Nat Rev Drug Discov 6: 556–568
Google Scholar - James RG, Biechele TL, Conrad WH, Camp ND, Fass DM, Major MB, Sommer K, Yi X, Roberts BS, Cleary MA, Arthur WT, MacCoss M, Rawlings DJ, Haggarty SJ, Moon RT (2009) Bruton's tyrosine kinase revealed as a negative regulator of Wnt‐beta‐catenin signaling. Sci Signal 2: ra25
Google Scholar - Kabuyama Y, Resing KA, Ahn NG (2004) Applying proteomics to signaling networks. Curr Opin Genet Dev 14: 492–498
Google Scholar - Kawakami T, Chiba T, Suzuki T, Iwai K, Yamanaka K, Minato N, Suzuki H, Shimbara N, Hidaka Y, Osaka F, Omata M, Tanaka K (2001) NEDD8 recruits E2‐ubiquitin to SCF E3 ligase. EMBO J 20: 4003–4012
Google Scholar - Koch A, Waha A, Hartmann W, Hrychyk A, Schuller U, Waha A, Wharton Jr KA, Fuchs SY, von Schweinitz D, Pietsch T (2005) Elevated expression of Wnt antagonists is a common event in hepatoblastomas. Clin Cancer Res 11: 4295–4304
Google Scholar - Kocher T, Superti‐Furga G (2007) Mass spectrometry‐based functional proteomics: from molecular machines to protein networks. Nat Methods 4: 807–815
Google Scholar - Korinek V, Barker N, Morin PJ, van Wichen D, de Weger R, Kinzler KW, Vogelstein B, Clevers H (1997) Constitutive transcriptional activation by a beta‐catenin‐Tcf complex in APC−/− colon carcinoma. Science 275: 1784–1787
Google Scholar - Labbe E, Letamendia A, Attisano L (2000) Association of Smads with lymphoid enhancer binding factor 1/T cell‐specific factor mediates cooperative signaling by the transforming growth factor‐beta and wnt pathways. Proc Natl Acad Sci USA 97: 8358–8363
Google Scholar - Labbe E, Lock L, Letamendia A, Gorska AE, Gryfe R, Gallinger S, Moses HL, Attisano L (2007) Transcriptional cooperation between the transforming growth factor‐beta and Wnt pathways in mammary and intestinal tumorigenesis. Cancer Res 67: 75–84
Google Scholar - Latres E, Chiaur DS, Pagano M (1999) The human F box protein beta‐Trcp associates with the Cul1/Skp1 complex and regulates the stability of beta‐catenin. Oncogene 18: 849–854
Google Scholar - Liu J, Bang AG, Kintner C, Orth AP, Chanda SK, Ding S, Schultz PG (2005) Identification of the Wnt signaling activator leucine‐rich repeat in Flightless interaction protein 2 by a genome‐wide functional analysis. Proc Natl Acad Sci USA 102: 1927–1932
Google Scholar - Logan CY, Nusse R (2004) The Wnt signaling pathway in development and disease. Annu Rev Cell Dev Biol 20: 781–810
Google Scholar - Luo W, Peterson A, Garcia BA, Coombs G, Kofahl B, Heinrich R, Shabanowitz J, Hunt DF, Yost HJ, Virshup DM (2007) Protein phosphatase 1 regulates assembly and function of the beta‐catenin degradation complex. EMBO J 26: 1511–1521
Google Scholar - Lustig B, Jerchow B, Sachs M, Weiler S, Pietsch T, Karsten U, van de Wetering M, Clevers H, Schlag PM, Birchmeier W, Behrens J (2002) Negative feedback loop of Wnt signaling through upregulation of conductin/axin2 in colorectal and liver tumors. Mol Cell Biol 22: 1184–1193
Google Scholar - Major MB, Camp ND, Berndt JD, Yi X, Goldenberg SJ, Hubbert C, Biechele TL, Gingras AC, Zheng N, Maccoss MJ, Angers S, Moon RT (2007) Wilms tumor suppressor WTX negatively regulates WNT/beta‐catenin signaling. Science 316: 1043–1046
Google Scholar - Major MB, Roberts BS, Berndt JD, Marine S, Anastas J, Chung N, Ferrer M, Yi X, Stoick‐Cooper CL, von Haller PD, Kategaya L, Chien A, Angers S, MacCoss M, Cleary MA, Arthur WT, Moon RT (2008) New regulators of Wnt/beta‐catenin signaling revealed by integrative molecular screening. Sci Signal 1: ra12
Google Scholar - Merlet J, Burger J, Gomes JE, Pintard L (2009) Regulation of cullin‐RING E3 ubiquitin‐ligases by neddylation and dimerization. Cell Mol Life Sci 66: 1924–1938
Google Scholar - Moffat J, Sabatini DM (2006) Building mammalian signalling pathways with RNAi screens. Nat Rev Mol Cell Biol 7: 177–187
Google Scholar - Narimatsu M, Bose R, Pye M, Zhang L, Miller B, Ching P, Sakuma R, Luga V, Roncari L, Attisano L, Wrana JL (2009) Regulation of planar cell polarity by Smurf ubiquitin ligases. Cell 137: 295–307
Google Scholar - Nusse R (2005) Wnt signaling in disease and in development. Cell Res 15: 28–32
Google Scholar - Parry G, Estelle M (2004) Regulation of cullin‐based ubiquitin ligases by the Nedd8/RUB ubiquitin‐like proteins. Semin Cell Dev Biol 15: 221–229
Google Scholar - Petroski MD, Deshaies RJ (2005) Function and regulation of cullin‐RING ubiquitin ligases. Nat Rev Mol Cell Biol 6: 9–20
Google Scholar - Preisinger C, von Kriegsheim A, Matallanas D, Kolch W (2008) Proteomics and phosphoproteomics for the mapping of cellular signalling networks. Proteomics 8: 4402–4415
Google Scholar - Read MA, Brownell JE, Gladysheva TB, Hottelet M, Parent LA, Coggins MB, Pierce JW, Podust VN, Luo RS, Chau V, Palombella VJ (2000) Nedd8 modification of cul‐1 activates SCF(beta(TrCP))‐dependent ubiquitination of IkappaBalpha. Mol Cell Biol 20: 2326–2333
Google Scholar - Rousset R, Wharton Jr KA, Zimmermann G, Scott MP (2002) Zinc‐dependent interaction between dishevelled and the Drosophila Wnt antagonist naked cuticle. J Biol Chem 277: 49019–49026
Google Scholar - Rual JF, Venkatesan K, Hao T, Hirozane‐Kishikawa T, Dricot A, Li N, Berriz GF, Gibbons FD, Dreze M, Ayivi‐Guedehoussou N, Klitgord N, Simon C, Boxem M, Milstein S, Rosenberg J, Goldberg DS, Zhang LV, Wong SL, Franklin G, Li S et al (2005) Towards a proteome‐scale map of the human protein‐protein interaction network. Nature 437: 1173–1178
Google Scholar - Shannon P, Markiel A, Ozier O, Baliga NS, Wang JT, Ramage D, Amin N, Schwikowski B, Ideker T (2003) Cytoscape: a software environment for integrated models of biomolecular interaction networks. Genome Res 13: 2498–2504
Google Scholar - Stelzl U, Wanker EE (2006) The value of high quality protein‐protein interaction networks for systems biology. Curr Opin Chem Biol 10: 551–558
Google Scholar - Stelzl U, Worm U, Lalowski M, Haenig C, Brembeck FH, Goehler H, Stroedicke M, Zenkner M, Schoenherr A, Koeppen S, Timm J, Mintzlaff S, Abraham C, Bock N, Kietzmann S, Goedde A, Toksoz E, Droege A, Krobitsch S, Korn B et al (2005) A human protein‐protein interaction network: a resource for annotating the proteome. Cell 122: 957–968
Google Scholar - Tang W, Dodge M, Gundapaneni D, Michnoff C, Roth M, Lum L (2008) A genome‐wide RNAi screen for Wnt/beta‐catenin pathway components identifies unexpected roles for TCF transcription factors in cancer. Proc Natl Acad Sci USA 105: 9697–9702
Google Scholar - Wallingford JB, Habas R (2005) The developmental biology of Dishevelled: an enigmatic protein governing cell fate and cell polarity. Development 132: 4421–4436
Google Scholar - Wharton Jr KA, Zimmermann G, Rousset R, Scott MP (2001) Vertebrate proteins related to Drosophila Naked Cuticle bind Dishevelled and antagonize Wnt signaling. Dev Biol 234: 93–106
Google Scholar - Yan D, Wallingford JB, Sun TQ, Nelson AM, Sakanaka C, Reinhard C, Harland RM, Fantl WJ, Williams LT (2001a) Cell autonomous regulation of multiple Dishevelled‐dependent pathways by mammalian Nkd. Proc Natl Acad Sci USA 98: 3802–3807
Google Scholar - Yan D, Wiesmann M, Rohan M, Chan V, Jefferson AB, Guo L, Sakamoto D, Caothien RH, Fuller JH, Reinhard C, Garcia PD, Randazzo FM, Escobedo J, Fantl WJ, Williams LT (2001b) Elevated expression of axin2 and hnkd mRNA provides evidence that Wnt/beta ‐catenin signaling is activated in human colon tumors. Proc Natl Acad Sci USA 98: 14973–14978
Google Scholar - Zeng W, Wharton Jr KA, Mack JA, Wang K, Gadbaw M, Suyama K, Klein PS, Scott MP (2000) naked cuticle encodes an inducible antagonist of Wnt signalling. Nature 403: 789–795
Google Scholar
Acknowledgements
We thank Thomas Sun, Frederick Vizeacoumar and Rob Donovan at the SMART Robotics Facility for their contribution to assay development and technical support and Peter Ching for assistance with manual verification of the LUMIER screen. This work was supported by grants to LA from the Canadian Institutes of Health Research (#77690) and the Canadian Cancer Society, to JLW with funds from Genome Canada through the Ontario Genomics Institute and a US NIH grant from NHGRI, R01HG001715 (JLW subcontract, M. Vidal contact PI), to LA and JLW from the Ontario Research Fund, and to QM from the Natural Sciences and Engineering Research Council. LA and JLW hold Canadian Research Chairs, and JLW is an International Scholar of the Howard Hughes Medical Institute.
Author information
Authors and Affiliations
- Department of Biochemistry, University of Toronto, Toronto, Ontario, Canada
Bryan W Miller, Garnet Lau, Emanuela Mollica & Liliana Attisano - Donnelly Centre for Cellular and Biomolecular Research, University of Toronto, Toronto, Ontario, Canada
Bryan W Miller, Garnet Lau, Quaid Morris & Liliana Attisano - Banting and Best Department of Medical Research, University of Toronto, Toronto, Ontario, Canada
Chris Grouios & Quaid Morris - Department of Computer Science, University of Toronto, Toronto, Ontario, Canada
Quaid Morris - Centre for Systems Biology, Samuel Lunenfeld Research Institute, Mount Sinai Hospital, Toronto, Ontario, Canada
Miriam Barrios‐Rodiles, Yongmei Liu & Jeffrey L Wrana - Samuel Lunenfeld Research Institute, Mount Sinai Hospital, Toronto, Ontario, Canada
Miriam Barrios‐Rodiles, Alessandro Datti & Jeffrey L Wrana - Department of Molecular Genetics, University of Toronto, Toronto, Ontario, Canada
Quaid Morris & Jeffrey L Wrana - Department of Biochemistry, University of Toronto, Donnelly CCBR, 160 College Street, Room 1008, Toronto, Ontario, M5S 1A8, Canada
Liliana Attisano
Authors
- Bryan W Miller
- Garnet Lau
- Chris Grouios
- Emanuela Mollica
- Miriam Barrios‐Rodiles
- Yongmei Liu
- Alessandro Datti
- Quaid Morris
- Jeffrey L Wrana
- Liliana Attisano
Corresponding author
Correspondence toLiliana Attisano.
Ethics declarations
The authors declare that they have no conflict of interest.
Additional information
Miller, Bryan W, Lau, Garnet, Grouios, Chris, Mollica, Emanuela, Barrios‐Rodiles, Miriam, Liu, Yongmei, Datti, Alessandro, Morris, Quaid, Wrana, Jeffrey L, Attisano, Liliana, (2009) Application of an integrated physical and functional screening approach to identify inhibitors of the Wnt pathway. Molecular Systems Biology, 5. 315. doi: 10.1038/msb.2009.72
Supplementary Information
Rights and permissions
This is an open access article under the terms of the Creative Commons Attribution‐NonCommercial‐NoDerivs License, which permits use and distribution in any medium, provided the original work is properly cited, the use is non‐commercial and no modifications or adaptations are made.
About this article
Cite this article
Miller, B.W., Lau, G., Grouios, C. et al. Application of an integrated physical and functional screening approach to identify inhibitors of the Wnt pathway.Mol Syst Biol 5, MSB200972 (2009). https://doi.org/10.1038/msb.2009.72
- Received: 15 April 2009
- Accepted: 08 September 2009
- Published: 13 October 2009
- DOI: https://doi.org/10.1038/msb.2009.72