Modelling vaccination strategies against foot-and-mouth disease (original) (raw)
This part discusses in more detail the current biological and other issues associated with vaccination, provides a brief synopsis of the underlying model and considers the sensitivity of the results given in the main paper to changes in vaccine uptake or epidemiological variation.
Contents.
- Limits of control by vaccination for the 2001 epidemic
- Logistics of mass reactive vaccination
- Caveats for future vaccination programmes
- Description of the model
- Control measures
- Sheep vaccination
- Predictive vaccination
- Sensitivity to parameter variation and the data-base
- Initial conditions and reporting biases
- Start date of vaccination
- Delay in protection
- Vaccine efficacy in infected farms
- Width of infection kernel
- Species specific disease parameters
- Variable incubation periods
- The effects of vaccination in non-spatial models
Limits of control by vaccination for the 2001 epidemic
Reactive vaccination was not used during the UK 2001 epidemic, although it has been used during FMD epidemics in other countries during the past few years (http://www.oie.int/). Factors contributing to the decision not to use vaccination in the UK included: i) international livestock trade regulations; ii) logistic limitations; iii) anticipated low effectiveness in comparison with pre-emptive culling. International trade regulations favour `FMD-free without vaccination' status (http://www.defra.gov.uk/animalh/int-trde/fmd.htm), providing an economic disincentive for a vaccination-to-live control strategy. Logistical limitations are important because of the necessity of rapid implementation of control measures: limited availability of vaccine, absence of contingency planning involving vaccination and legislative uncertainties all mitigated against the use of vaccination in the UK during 2001. Limited reactive vaccination is likely to be less effective than pre-emptive culling for controlling FMD (Ferguson, Donnelly & Anderson 2001; Morris et al., 2001; Keeling et al., 2001). A combined culling and vaccination strategy would have benefits, but at the time proposed these were expected to be relatively modest and did not present a compelling argument for a combined strategy in the UK in 2001 (Morris et al., 2001; Keeling et al., 2001).
Logistics of mass reactive vaccination
Vaccination of large numbers of animals will present some practical and logistical problems that will necessitate careful planning with specific contingency procedures. Vaccine efficacy depends upon the correct use and administration of the vaccine, which requires skill. In the face of FMD infection within an area, it will be essential to ensure that animals to be vaccinated are not clinically affected with disease, and so examination prior to vaccination will be necessary. Vaccination will need to be recorded with the identity of vaccinated animals notated. The procedure will require skilled labour which will need to be ready trained and available to ensure the rapid coverage that the proposals require.
It can be estimated that vaccination of cattle herds can be performed at about the same speed as tuberculin testing which requires similar procedures. Experience shows that this common procedure can be performed most efficiently on large dairy herds, where up to 600 adult dairy cows can be processed per day by a team of one veterinary surgeon and two experienced stock handlers with efficient handling systems. Young cattle require more handling, and will slow the rate to 200 ?-300 per day. Most dairy farms comprise 60 - 80% of their stock as adult dairy cattle, with the rest classified as 'followers' comprising young animals of various ages.
Beef cattle herds will be more problematical, as they are less agreeable to handling, and handling facilities tend to be less available. It is estimated that one veterinary surgeon and two experienced handlers could process 200-300 beef cattle of various ages per day.
The total number of vaccinations that could be performed efficiently and effectively will depend upon the availability of skilled operatives, and the location of the cattle. Housed animals, during the winter months, will be much more available than grazing animals in the summer, which may be isolated and distant from handling facilities.
In the UK there are 12 million cattle including around 4 million breeding animals, and although the farm animal veterinary expertise is on the decline it is still prominent in the livestock areas. Some 40% of the 8,500 vets in practise work, for some of their time with cattle. There are around 3,000 LVIs (Local Veterinary Inspectors) appointed by DEFRA.
In dairying areas the ratio of vets to adult cattle is around 1 per 3-4,000 cows. In beef areas the ratio is more likely to be around 1 per 10,000 or even fewer.
With a total commitment from local veterinary surgeons and delegation of some tasks to trained non veterinary personnel, it may be possible to vaccinate the majority of cattle within an area within three to ten days of the instruction being received, depending on local condition and the time of year. We explore a range of daily cattle vaccination rates up to this maximum. This period would be extended if there was any lack of co-operation from the owners of the animals, or if movement of the animals to handling facilities was prohibited as a biosecurity measure to prevent local spread of the virus.
International comparisons OIE data for the recent FMD incursions into Uruguay, Argentina and Brazil imply that cattle vaccination (nationwide) proceeded at hundreds of thousands per day and started within days of the first reported case (http://www.oie.int). This indicates that the critical threshold of 300,000 per day in Fig. 2 is not an unreasonable target. We assume a lag of 7 days before large stocks of vaccine are available for use, though this is likely to be conservative if the appropriate logistic preparations are made.
Caveats for future vaccination programmes
As outlined in the discussion to the main paper, several important additional factors must be considered before vaccination in any form can be used,
Trade issues.
Before any vaccine programme can succeed, there must be full co-operation from the animal owners. If the target is large farms, the issue of trade restrictions will have to be considered before such a programme is even contemplated. Both EU and local government will need a clear policy. Farmer will need the confidence of knowing that vaccination will not devalue or limit the sale of their stock or produce, and such confidence will only be achieved is there is some form of indemnity should that occur.
Practical issues.
Vaccination will undoubtedly suppress clinical disease, and this has been and will likely remain the primary method of surveillance. It is unlikely that any vaccine programme will achieve total protection, and so disease will undoubtedly occur, albeit at a low level, in some vaccinated farms - careful and extensive surveillance will therefore be required. It may not be adequate to rely on owner observation and reporting, as the perception may be that the odd clinical case within a vaccinated population will not really matter, and can be tolerated or disposed of. This will leave undetected virus within the population.
The high level of births on some farms (often with a doubling of livestock numbers over a period of 8 week) will dilute the effects of vaccination at particular times of the year. Re-vaccination will be essential to maintain a realistic level of protection on these farms.
The practicalities of vaccinating of livestock species needs to be explored in more detail. While mass vaccination of cattle is predicted to be sufficient to control a repeat of the 2001 outbreak, a different strain with different transmission properties may require additional vaccination. Vaccinating sheep is regarded as very difficult, while vaccination of pigs is complicated due to their high reproductive rate. Related to this is the potential for the extra movement of vehicles and personal necessary for vaccination to contribute to the transmission of infection and to generate new long-distance sparks.
The prospect of combining DC culling with vaccination may revive the problems experienced with CP culling. Some farmers will resist culling in favour of vaccination, and others the reverse. Their decisions will be based on financial and emotive arguments, rather than science or disease control.
Judgements will have to be made, and the strategy altered to local and seasonal variations. Vaccination would be a lot easier in the winter than in the summer, when animals are far more widely distributed and difficult to handle. A summer vaccine programme will involve a lot of movements of animals to get them near any handling facilities.
Banks of relevant vaccines will have to be maintained.
Vaccine technology and virus issues
The next virus invasion may not behave the same way as the 2001 epidemic, therefore it is clear that any strategy must be sufficiently flexible to cope with all feasible variations. Pigs and airborne spread may play a significant role in the future, in which case meteorological effects will have to be incorporated into any vaccine target selection and prioritising.
Alternatives
A feature of this last epidemic was the predominance of local spread as the route of transmission. This local spread has not yet been identified, and we could eliminate the need for vaccination if we could discover what was the predominant cause of this local spread and stop it. These unknown transmission routes must be researched so that effective biosecurity can be achieved next time. A more effective biosecurity strategy will have to be implemented with or without any vaccine programme.
Objectives and the exit strategy.
It is crucial to define when to stop the control measures and how we would know that the virus has been eradicated. In any region we would undoubtedly end up with a mixed population of animals: infected and undetected, vaccinated and protected, or unprotected and susceptible. In such a mixed population the criterion for achieving disease free status may be difficult to ascertain. There may even be a conflict between epidemic control and the more stringent measures necessary for virus eradication.
Description of the model
The full underlying model for transmission of infection, culling and the progression of infection is explained in greater detail in Keeling et.al. (2001) and the associated supplementary material. The model is initialised with the total number and composition of livestock in each farm in Great Britain; farms are chosen as the fundamental units of our model. The transmission of infection between infectious and susceptible farms is controlled by four parameters governing the susceptibility and transmissibility of cattle and sheep (pigs played a negligible role in the 2001 epidemic), and an infection kernel which reflects the effects of distance between farms. Although farms are the units of infection within the model, the farm-level parameters are calculated on a per capita basis for all the livestock within the farm. The kernel (both before and after movement restrictions were enforced) is taken from the contact tracing performed by DEFRA, although estimation directly from the case report data produces good qualitative agreement. The transmissibility and susceptibility parameters are found by maximisation of the likelihood function on a daily basis. In essence we find that cattle and sheep have similar levels of transmission, but cattle are much more susceptible.
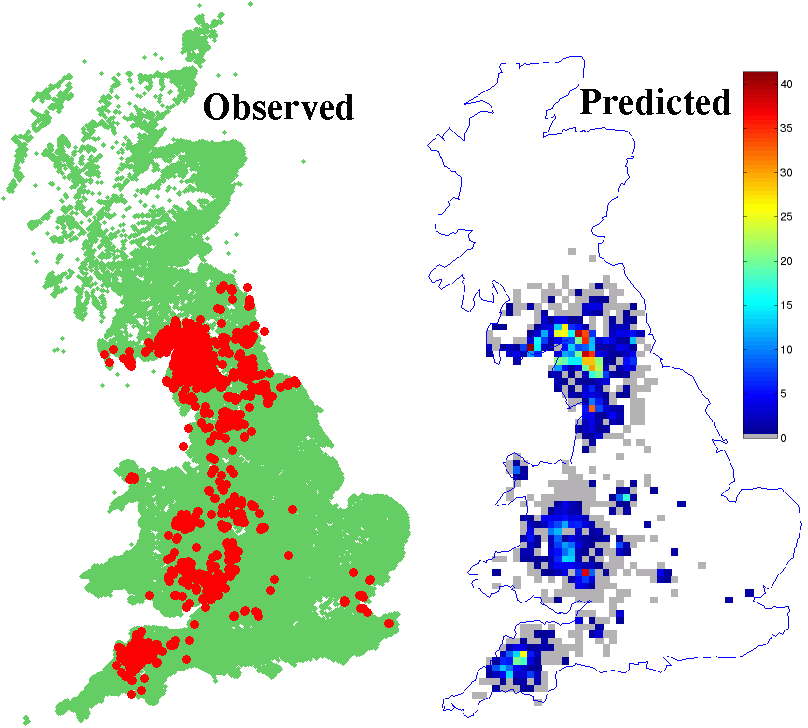
Figure 1 (download GIF )
(GIF 32.9 KB)
Comparison between the spatial location of observed cases (red circles) and the predicted density of cases from the model. (Green dots give the location of uninfected farms). There is good regional agreement, with Cumbria, Devon and the Welsh borders having the majority of cases. Further analysis has shown that the models and data show a similar clustering of cases at a more local scale.
In general the risk of infection is increased by (i) proximity to an infected farm (ii) the number of livestock on the infected farm (iii) the number of livestock on the susceptible farm (iv) the proportion of cattle on the susceptible farm. Thus regions of the country with a high density of large cattle farms (such as Cumbria) are most at risk.
Farms are considered to pass through five different stages. Initially all farms are susceptible. Once infected, farms move into the exposed class where they remain for around 4 days. Next farms become infectious and can spread the disease. Nine days after infection symptoms arise and the farm is reported to the authorities. Finally the livestock on the farm are slaughtered and the appropriate culling or vaccination policy is performed on the surrounding farms, ideally this should occur with 24 and 48 hours respectively of reporting.
Although many different vaccination strategies have been simulated, some general baseline assumptions have been made. Throughout we concentrated on vaccination of cattle only, starting 26 days after the disease was first detected (equivalent to 18th March in the 2001 UK epidemic), with an efficacy of 90%. The vaccine was assumed to be high-potency and therefore offer protection after four days; further it is assumed that reactive vaccination in response to an infected premise takes two days - hence the total delay in protection is six days. Only those farms that are uninfected at the end of this six-day lag will be protected, this is implemented by binomially sampling the cattle population and moving 90% (on average) into the protected class.
Control measures
Four basic strategies exist which will reduce the extent of the epidemic. These are, movement restrictions which limit the spatial transmission of infection, prompt slaughtering of infected herds which again limits transmission, the culling of at-risk herds (either the dangerous-contact or contiguous premise cull) which reduces both transmission and susceptibility within at-risk areas, and vaccination which limits susceptibility. Determining which combination of policies are optimal depends on the exact criterion being measured.
Sheep vaccination
Throughout this work we have focused on the most logistically feasible solution of only vaccinating cattle. Here, for completeness, and because it informs about the risks posed by each species, we consider vaccination of sheep only and compare the success of this approach with our standard cattle-only scenario. These results should be compared to Fig 1A in the main text.
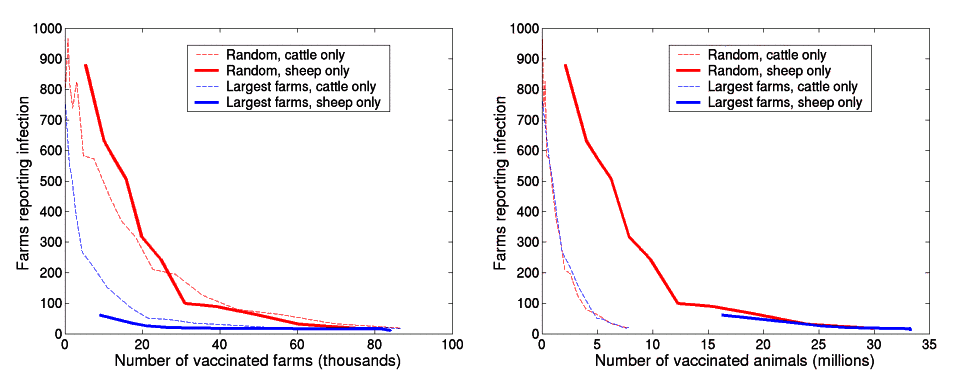
Figure 2 (download GIF )
(GIF 29.3 KB)
Comparison between cattle-only and sheep-only vaccination strategies. The left-hand graph shows the number of cases against the number of farms vaccinated, the right-hand graph shows the number of cases as a function of the number of animals vaccinated. The red lines are the results for random vaccination, the blue lines are for targeted vaccination which focuses primarily on farms which have the largest numbers of the target species.
Surprisingly, at the farm level vaccinating sheep seems to be as effective as vaccinating cattle; however there are two confounding factors which need to be considered. Firstly, for similar numbers of farms, vaccinating sheep involves far more animals than vaccinating cattle, this is in addition to the fact that sheep may be more difficult to catch and handle. Secondly, vaccinating sheep is successful because it generally prevents a randomly seeded epidemic from reaching the main high-risk areas of Cumbria; however chance events may lead to the disease reaching such area - in which case a large epidemic arises. These results support the assumptions made in the main text, that vaccination of cattle only is a safer and logistically easier policy.
Predictive vaccination
The movie below contrasts the dynamics of the epidemic (focusing on Cumbria) for three different control scenarios. Clearly the left-hand figure, which corresponds to the observed cull, produces the largest epidemic with the largest number of cases in the tail. For ring-vaccination, although the tail is lower it has a similar duration; in this figure the very localised application of vaccination is evident. Finally the right-hand graph, which is predictive-vaccination, has both the lowest epidemic and the shortest tail. Vaccination is no-longer localised, but targets specific areas. Which of these strategies is optimal depends on the eventual fate of vaccinated cattle, and the relative costs of the control measures - although predictive vaccination should always be more efficient than ring vaccination

Figure 3 (download GIF )
(GIF 656 KB)
Comparison between three different control options; from left to right, no vaccination, 3km ring-vaccination of cattle and predictive-vaccination of cattle (at 100 farms per day), all in addition to the observed level of IP, DC and CP culling. The top graph shows the number of simulated cases in the whole of the UK, the map shows the local situation in Cumbria. Green dots are susceptible farms, yellow dots are infected farms, red dots are reported farms and black dots are culled farms. Vaccinated farms are surrounded by a blue square. The stochastic transmission of infection in these three simulations is identical, only the various vaccination strategies differentiates between them.
Since predictive vaccination within a spatial epidemic is a novel control method, we explore its basic properties in the following figure ; three key elements can be observed. The distribution of distances between an infectious premise (IP) and a resultant vaccination has a very long tail, although the median distance is around 4km. The average distance is also seen to increase during the epidemic, this is primarily the result of local depletion of susceptibles in the at-risk areas, such that small isolated hot-spots are targeted towards the end of the epidemic. Finally we note that the distance between IP and vaccinated farms is a function of spatial location, with Cumbria and Devon having the shortest distances.
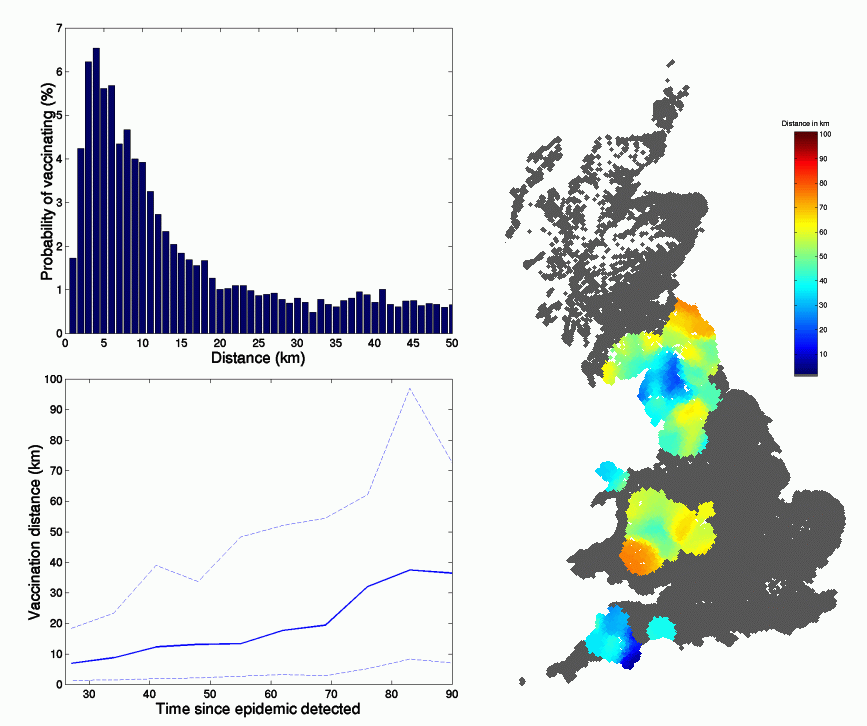
Figure 4 (download GIF )
(GIF 57.8 KB)
The spatial and temporal variation in the distance between Infected Premise and the farms vaccinated as a result. Top left: the distribution of distances averaged over time and space. Bottom left: the average distance and 95% confidence intervals as a function of time since the epidemic was reported. Right: the smoothed spatial distribution of vaccination distances.
Sensitivity to parameter variation and the data-base
Biological assumptions of the model are discussed in the supplement to http://www.sciencemag.org/cgi/content/full/1065973/DC1.
Reactive vaccination was considered using the dynamics of the 2001 UK epidemic as a template, with either IP and DC culling or IP, DC and CP culling being used in addition to vaccination. Obviously a wide spectrum of other possible scenarios exist. Future outbreaks may well be of a different strain with very different parameters; for example a strain that predominantly infected sheep would vastly increase the risk in Wales, whereas if pigs played a more major role (see Fig1C) the epidemic could be far larger and would be more confined to the east of England. It is also to be hoped that in any future incursion, action would be taken far more quickly. However, a comprehensive sweep of all possible future scenarios is computationally infeasible and would make it difficult to draw any unifying conclusions - hence, due to the available data and definite nature of the problem, we concentrate on re-running the 2001 epidemic with different control measures.
Initial conditions and reporting biases
There are various uncertainties associated with the databases recording foot-and-mouth disease cases, the culling of at risk farms and the baseline distribution of livestock for the UK 2001 FMD epidemic. It is important to consider how these uncertainties might influence analysis and interpretation of the epidemic's course and to what extent they may affect the qualitative conclusions regarding options for controlling FMD. The main points have been discussed previously (Keeling et al. 2001); below, the points most relevant to the current analysis are reviewed.
Farm location. There are over 142,000 livestock farms in the UK. The location of these is recorded as grid reference. Grid referencing errors do occur, but these are apparent at a low frequency (<1.7%).
Livestock composition. Comparison of observed (slaughtered during the FMD epidemic) and expected (from the livestock census) data provides measures of the reliability of the census data. Although there are numerous examples of discrepancies at the individual level, the expected number of livestock is a good predictor of the observed number of livestock at the population level (over 80% variance explained for sheep and over 90% for cattle). However, there is some evidence of bias for sheep, with over 25% fewer sheep being slaughtered on culled premises than were reported present at the time of censusing. There was no such bias for cattle.
Case diagnosis. The extent of mis-diagnosis of FMD during the UK 2001 epidemic has yet to be formally determined but a significant fraction of clinical diagnosis were not confirmed by laboratory testing. If only laboratory confirmed cases are considered then the evidence for the key risk factors (proximity to a previous cases, presence of cattle, large numbers of livestock) becomes even stronger.
Transmission kernel. The transmission kernel used here is taken directly from contact tracing data, mainly but not exclusively carried out during the early stages of the UK epidemic after the imposition of the national livestock movement ban. Comparison of resulting model output with the observed spatial clustering of cases gives good agreement, implying that there are not major biases in the tracing data. However, there is some uncertainty regarding the frequency and distribution of rare, long range (>10km) jumps.
Pre-clinical infection. Pre-clinical cases are critical for the dynamics of the spread of FMD. Tracing studies suggest that the majority of transmission events occur before reporting. Simulations suggest that significant fractions of culled or vaccinated herds and flocks would have pre-clinical infections. However, surveillance for pre-clinical FMD is highly problematic (Hughes et al., in press) and the expectation is that only rarely would pre-clinical infection be detected by the surveillance protocols used in the UK 2001 epidemic, as was found in practise.
Within-farm dynamics. Tracing data obtained during the UK 2001 epidemic do not indicate that there was a significant change in infectiousness after an initial incubation period, when averaged across all farms for which data are available. The underlying biology is likely to be more complex with farm level infectiousness reflecting the number of index cases, the viral doses to which they were exposed, the interval between exposure and reporting, and any improvements in biosecurity after reporting.
Start date of limited reactive vaccination
In the majority of simulations (Fig 3 and 4) we have assumed that reactive vaccination campaigns began on day 26, during the 2001 epidemic this was the interval before it became apparent that the disease was not being effectively controlled using traditional approaches. Clearly if vaccination is begun earlier, the total number of susceptibles during the early part of the epidemic must be lower and therefore the total epidemic size must be reduced. To gauge the strength of this change we consider the simplest reactive vaccination strategy, vaccinating a fixed number of farms each day. The graph below assumes vaccination of cattle only on one hundred farms each day starting with the largest cattle farms in the most at risk areas (eg. Cumbria).

Figure 5 (download GIF )
(GIF 44.1 KB)
The effects of the timing of vaccination. The left-hand graph is the total number of reported cases, the right-hand graph is the duration of the epidemic. The dots represent the individual results of simulations, while the solid lines show the average. The three main forms of reactive vaccination are considered; 3km ring-vaccination (red), constant daily vaccination of the 100 largest cattle farms in at-risk counties (green), predictive vaccination of 100 farms per day (blue). Throughout vaccination is of cattle only, is assumed to have an efficacy of 90%, and is performed in addition to the observed IP, DC and CP culls.
Clearly, early initiation of any form of vaccination campaign reduces the total number of cases, although has a less dramatic effect on the duration of the epidemic. Comparing the three vaccination methods (which are parameterised to have similar numbers of vaccinated farms), several key features are evident. Firstly, as the start date of vaccination becomes earlier, the predictive vaccination strategy has the most significant effect on the total number of cases. Beginning ring-vaccination much earlier does not have such a pronounced effect, this is because in the early stages there are few cases and hence less vaccination is performed. The predictive vaccination method has consistently shorter duration epidemics than either of the other strategies. The localised nature of ring vaccination has some success at truncating the epidemic tail, while the county level constant vaccination strategy is far less effective. From these simulations the advantages of predictive-vaccination are clear. We note however that these simulations assume that the vaccination campaign can begin in advance of the more efficient DC and CP culling, which started about day 26. Starting DC and CP culling early has a much more significant impact on the total epidemic size.
Delay in protection
To interpret the lack of success of limited reactive vaccination compared to culling we need to tease apart the relative contribution of two biological barriers to the effectiveness of reactive vaccination. The first problem is the delay between administering vaccine and the onset of protection; the second, inability of the vaccine to control already infected farms. The figure below addresses the relative contributions of these factors by manipulating the time delay before protection from culling or vaccination in a 3km ring.
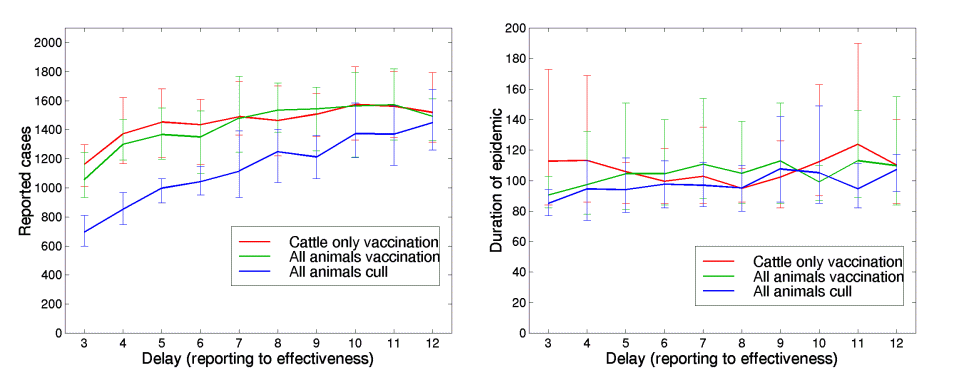
Figure 6 (download GIF )
(GIF 31.2 KB)
The effects of the delay between an infectious farm being reported, and the control measures applied in a 3km ring around the IP being effective. The left-hand graph is the total number of reported cases, the right-hand graph is the duration of the epidemic. The red line shows the results for cattle only vaccination (within a 3km ring), the green line represents vaccination of all animals, and the blue line is the cull of all animals within a 3km ring. These localised procedures are begun on day 26 and are applied in addition to the observed IP,DC and CP culling.
As expected (Keeling et al. 2001) increasing the delay decreases the efficacy of both control measures. The effect of "wasted" vaccination on infected farms is apparent in the comparison between the vaccination (green) and culled curves (blue). This effect is strongest (around a 40% decrease in cases) when the delay is short, and then declines as the delay increases. Because of this effect vaccination is less sensitive to a delay than culling. Overall, the delay is probably more important, although both factors interact synergistically. We might also under-estimate the effects of vaccination by our assumption that farms infected during the delay between vaccine administration and immunization are not protected by the vaccine, as detailed in the next sub-section.
During the latter stages of the 2001 UK epidemic, localised culling (DC and CP) was generally attempted within 48 hours. As this form of control would obviously take priority, we assumed that the 3km ring control could not better this two day delay. Throughout the paper we have optimistically assumed a delay of only six days which could only be achieved by very prompt action and high-potency vaccines; standard-strength vaccines would lead to a delay of at least twelve days. A decrease in the delay always leads to a reduction in reported cases. We note that culling animals within a 3km ring, which instantly prevents further transmission, is more effective and shows greater dependency on the delay. This reinforces the general message that prompt local culling is necessary for control of this infection. Considering the duration of the epidemic however, shows that there is no significant difference between any of the methods or any of the delays.
Vaccine efficacy in infected farms
In general, we have assumed that the infection and transmission processes proceeds unaffected if the farm is infected before vaccination provides full protection (four days after vaccination). The opposite extreme is to assume that vaccination protects all farms irrespective of infection status. We scale between these two extremes by assuming that for infected farms the efficacy of the vaccine is lower. Again we consider vaccination of cattle only starting on 26 days after the disease was first detected.
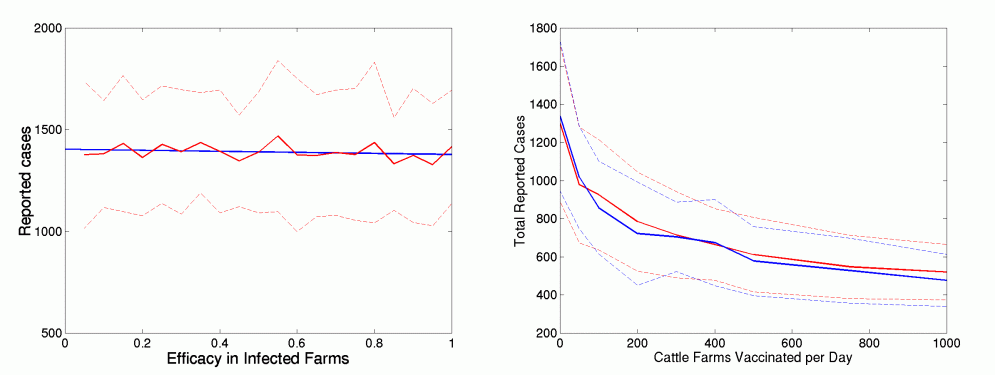
Figure 7 (download GIF )
(GIF 23.1 KB)
The left-hand graph shows the number of reported cases against the reduction in efficacy of the vaccine if the farm is infected before protection starts, for 3km ring vaccination of cattle. The solid red line gives the average of 50 simulations, the dotted lines show twice the standard deviation and the blue line is a linear regression to these results. The right-hand graph shows the generality of this result across a range of vaccination levels for the constant vaccination strategy. The red and blue lines are the results for 0 (the default assumption) and 50% efficacy for infected farms.
Clearly, the efficacy of the vaccine on already infected farms has very little effect on the overall size of the epidemic. This is surprising, but may reflect the fact that many farms within the 3km ring will already be infected and transmitting by the time vaccination offers protection, so whether they continue to shed virus or not has little impact on the subsequent spread of infection.
Width of infection kernel
The infection kernel, K, determines the potential spread of infection between farms. In the early and late stages of an epidemic, the spread to new areas with high densities of susceptibles is vital for maintaining the outbreak. Changes in this kernel are likely to be driven by changes in farming practises as well as epidemiological differences between strains of foot and mouth. Here we consider changes to the width of the infection kernel, such that the overall shape is maintained, the instantaneous rate of infection remains constant, but the average transmission distance increases. Hence, with a relative width of w, the new infection kernel, K', is given by
K' (wd) = K(d) / _w_2
For three distinct control measures, we contrast the behaviour of the epidemic as the kernel width increases.
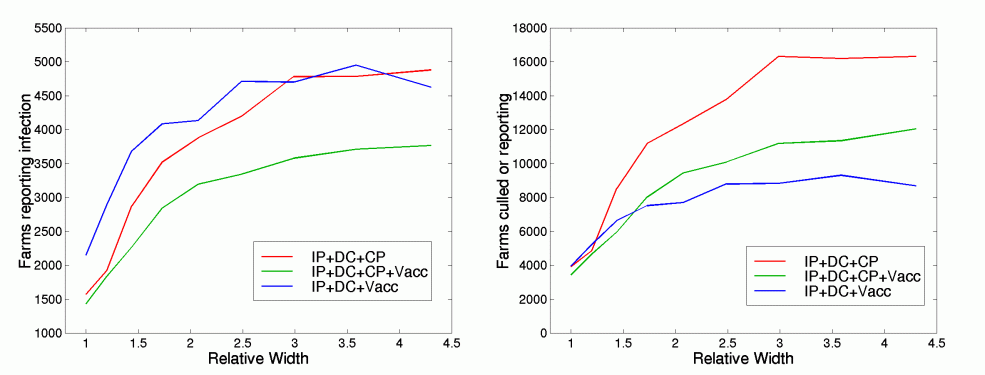
Figure 8 (download GIF )
(GIF 29.2 KB)
The left-hand graph shows the total number of farms reporting infection, whereas the right-hand graph shows the total number of farms that lose livestock either due to infection or due to culling. Results are the average of 50 simulations. Red line, IP, DC and CP culling following the observed pattern. Green line, IP, DC and CP in addition to ring vaccination of cattle within a 3km radius. Blue line , IP and DC culling only, in addition to ring vaccination of cattle.
As the width of the kernel increases, so does the size of the epidemic. This is to be expected, as although the instantaneous rate of infection is the same for all widths, local spatial saturation means that greater widths are associated with increased R 0 - unfortunately this relationship is non-linear, dependent on local farm density and difficult to quantify exactly. Looking at the total epidemic size, vaccination is seen to have an increasing effect as the kernel width becomes larger and the spread of infection is more diffuse; this is because less vaccine is wasted on already infected farms. Throughout, a mixture of IP, DC and CP culling with vaccination limits the total epidemic size. However, in terms of the total number of farms affected by the outbreak, wide diffuse kernels would mean that CP culling is an inefficient strategy as the infection is far less localised on the neighbouring contiguous farms. However, for our best-fit to the data (relative width=1), and moderate increases in kernel width, CP culling is the optimal policy.
Species specific disease parameters
Throughout this work we have used the species specific susceptibility and transmissibility parameters that have been estimated from the 2001 epidemic data. In practise, other strains of FMD may have widely varying parameters, and in particular may have much larger reproductive ratios. As an example of such a situation we consider the scenario where pigs (which played a minor role in the 2001 epidemic) are far more infectious. In particular we assume that pigs are as susceptible as cattle, but twenty times more infectious. The graph below shows the number of reported cases against different levels of vaccination, and should be compared to Fig1c in the main text. The table emphasises the differences that this change in parameters makes and gives the expected epidemic size, under different control strategies, with normal and increased pig parameters.
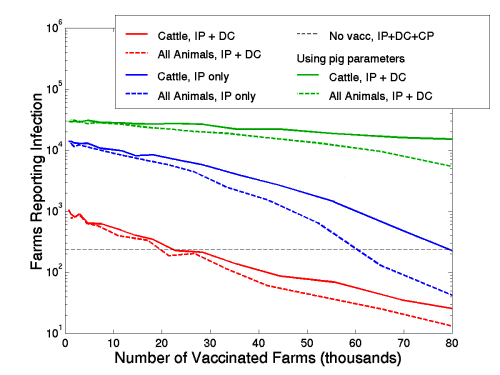
Figure 9 (download GIF )
(GIF 16.9 KB)
Comparison between standard parameters from the 2001 epidemic (red and blue), to those with increased pig transmissibility (green). Solid lines refer to vaccinating cattle only, whereas dashed lines refer to vaccinating all animals (including pigs). When pigs play a major role, the expected epidemic is far larger and more difficult to control (compare the red and green lines).
Tab 1 Results from 100 simulations
Clearly the disease level parameters have a marked impact on the dynamics and extent of an outbreak. The invading strain of the 2001 UK epidemic was unusual in not significantly infecting pigs, and as the above simulations demonstrate the situation could have been far worse and far more difficult to control. The parameters chosen are meant to be illustrative, in general pig farms are associated with high levels of bio-security which may lower their effective susceptibility and transmission rates.
Variable incubation periods
The assumptions of a 4 day interval between exposure and infectiousness and a further 5 days between infectiousness and reporting merit brief discussion. Broadly, these are consistent with available data on estimated dates of infection, contact tracings and dates of infection (Haydon et al 2002), noting that it is the development of infectiousness and the reporting of clinical signs at the level of the farm, not the individual animal, that is being considered. However, these intervals do vary, and some of this variation is due to differences between livestock species. In particular the average estimated time between exposure and reporting was 1.8 days less for cattle farms than for sheep farms, with mixed farms intermediate (and 1.1 days less on mixed farms where cattle rather than sheep were thought to have been first infected). While these differences are too slight to affect materially the results presented here, they will need to be considered in developing a new generation of more detailed models.
There is some anecdotal evidence at the animal level, to suggest that sheep have a longer incubation period than cattle, although there is no clear signature of this factor in the DEFRA case report data. The presence of longer incubation periods in sheep would have two main effects. Firstly, the longer delay before showing symptoms would bias our parameter estimation, leading to a slight reduction in the susceptibility level of sheep. Second, it would slow the spread of the epidemic in sheep only areas and improve the effectiveness of CP and DC culling.
The effects of vaccination in non-spatial models
Homogeneous deterministic and stochastic models.
Here we illustrate the basic properties of the three forms of vaccination (prophylactic, reactive and density independent) using the simple SIR-type framework. The SIR model divides a population of size N, into three classes: the number of susceptibles, S, the number of infected individuals, I, and the number of recovered or removed individuals, R. The basic equations governing these dynamics are,
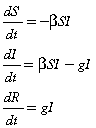
In the simple epidemic, initially all the population is susceptible (S(0)=N), and a small amount of infection is introduced. This leads to a 'final epidemic size' (the total proportion of individuals infected) of R∞ which satisfies,

where the Basic Reproductive Ratio, R0 = ß/g, defines the initial per generation growth rate.
Prophylactic vaccination obeys the same set of differential equations, however a proportion, V, of the population are vaccinated before the infection arises, hence S(0_)=(1-V) N_. This reduces the final size, which now obeys,

Reactive vaccination responds to the level of infection. As such, a number of susceptible individuals (proportional to the number of infection cases) are vaccinated during the epidemic and hence removed from the susceptible class. The governing equations are therefore,
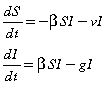
This set of equations can also be used to perform a final size calculation,
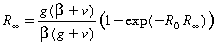
Constant daily vaccination in contrast removes susceptible individuals at a constant rate, so long as infection is still present. The governing equations are,
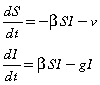
For this form of vaccination, the number of susceptibles will reach zero before the epidemic completely dies out, therefore we consider the epidemic to be over (and stop vaccinating) when the number of cases reaches one.
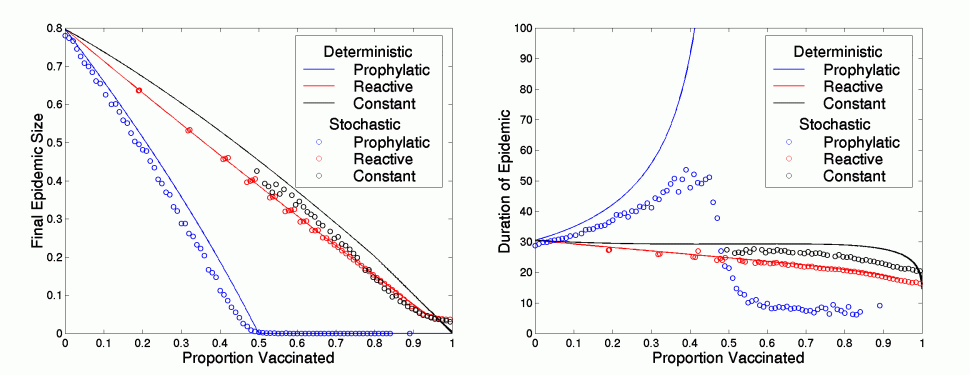
Figure 10 (download GIF )
(GIF 36 KB)
For a population size of one hundred thousand and a basic reproductive ratio R0 of 2, the left-hand shows the final epidemic size for the three methods of vaccination, against the total number of vaccinated individuals. The right-hand graph shows the associated duration. The solid lines are from deterministic equations, the circles are the average of 100 stochastic simulations.
Clearly prophylactic vaccination is the most effective, as it reduces the number of susceptibles before the infection arises and therefore it prevents an epidemic from taking off - it is easier to prevent an epidemic than to eradicate one. This means that vaccination effort should generally be concentrated at the beginning of the epidemic, once the at risk areas have been identified. However, in non-spatial models prophylactic vaccination can lead to a much longer epidemic, which could have important economic ramifications. These figures also show the corresponding results for the average of 100 simulations of stochastic versions of the above differential equations (simulations where early stochastic extinction has occurred are ignored). Clearly a similar pattern still holds for the number of infected cases although there is less difference between reactive and constant vaccination. However, in the stochastic model, prophylactic vaccination does not cause such prolonged epidemics close to the threshold, although there is an increase in epidemic duration as the level of vaccination approaches a critical value.
Including farm-level variability in models
The effects of vaccination, and in particular the impact of targeted vaccination, can be readily observed if farm-level heterogeneities are also included in the modelling approach. We have assumed throughout, susceptibility and transmissibility are proportional to the number of livestock; thus not only are larger farms more likely to catch the disease, they are also more likely to spread it - although the local spatial environment also plays a major role. For farm i, the susceptibility and transmissibility rates are defined as follows,

Where S and T are the species specific susceptibility and transmissibility rates, and N gives the number of livestock of each type in each farm. As shown in Box 1, the product of these two terms defines the potential infectivity of that farm, P i - the likelihood that is gets infected and the number of subsequent cases it can cause. This potential infectivity can also be used to describe the disease dynamics,

where k mimics the localising effects of the spatial kernel and g is the rate at which infectivity is lost; hence 1/g is the average infectious period. Using the census data it is possible to predict the value of P (the total potential infectivity) and hence the level of control afforded by various vaccination strategies. This is shown in the figure below.
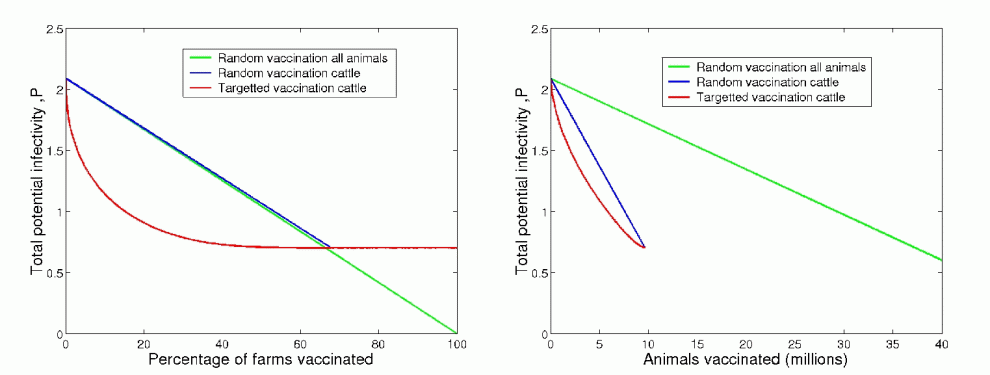
Figure 11 (download GIF )
(GIF 36 KB)
For three basic vaccination strategies (random all animals (green), random cattle only (blue), targeted at large farms cattle only (red)), the value of P is shown both per farm vaccinated and per animal vaccinated. It is clear that targeted vaccination is by far the most effective as the large farms has both high susceptibility and high transmissibility which act multiplicatively.
For random vaccination at a given rate the decrease in P is linear. Interesting, the decline per farm for both all animal and cattle only vaccination is remarkably similar, although vaccinating all animals is far more logistically expensive. If random vaccination is used to control the disease such that no major outbreak occurs, the number of cases is given by

where R is the effective reproductive ratio (without vaccination), µ (mu) is the vaccination rate, and T is the time when vaccination started. This simple formulation shows that after the start of vaccination the epidemic continues to grow exponentially, although eventually this will be outweighed by the negative _t_2 term and the number of daily cases will decrease. We note that targeted vaccination should always produce a more rapid reduction in epidemic size, although restriction of vaccination to a single species means that the effect of vaccination plateaus before reaching zero.
References
- Ferguson, N.M., Donnelly, C.S. & Anderson, R.M. Transmission intensity and impact of control policies on the foot and mouth epidemic in Great Britain. Nature 413, 542-548 (2001)
- Morris, R.S., Wilesmith, J.W., Stern, M.W., Sanson, R.L. & Stevenson, M.A. Predictive spatial modelling of alternative control strategies for the foot-and-mouth disease epidemic in Great Britain, 2001. Vet. Record 149, 137-144 (2001)
- Keeling, M.J. et al. Dynamics of the 2001 UK Foot and Mouth Epidemic: Stochastic Dispersal in a Heterogeneous Landscape. Science 294, 813-817 (2001)
- Haydon, D.T. et al. The construction and analysis of epidemic trees with reference to the 2001 UK foot-and-mouth outbreak. Proc. Roy. soc. Lond. B (in press).