International trade drives biodiversity threats in developing nations (original) (raw)
- Letter
- Published: 06 June 2012
Nature volume 486, pages 109–112 (2012) Cite this article
- 37k Accesses
- 1087 Citations
- 463 Altmetric
- Metrics details
Subjects
Abstract
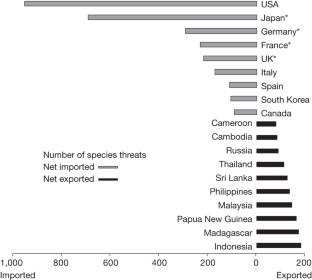
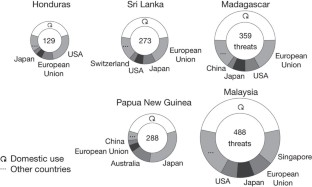
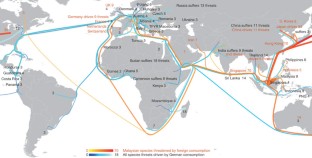
Human activities are causing Earth’s sixth major extinction event1—an accelerating decline of the world’s stocks of biological diversity at rates 100 to 1,000 times pre-human levels2. Historically, low-impact intrusion into species habitats arose from local demands for food, fuel and living space3. However, in today’s increasingly globalized economy, international trade chains accelerate habitat degradation far removed from the place of consumption. Although adverse effects of economic prosperity and economic inequality have been confirmed4,5, the importance of international trade as a driver of threats to species is poorly understood. Here we show that a significant number of species are threatened as a result of international trade along complex routes, and that, in particular, consumers in developed countries cause threats to species through their demand of commodities that are ultimately produced in developing countries. We linked 25,000 Animalia species threat records from the International Union for Conservation of Nature Red List to more than 15,000 commodities produced in 187 countries and evaluated more than 5 billion supply chains in terms of their biodiversity impacts. Excluding invasive species, we found that 30% of global species threats are due to international trade. In many developed countries, the consumption of imported coffee, tea, sugar, textiles, fish and other manufactured items causes a biodiversity footprint that is larger abroad than at home. Our results emphasize the importance of examining biodiversity loss as a global systemic phenomenon, instead of looking at the degrading or polluting producers in isolation. We anticipate that our findings will facilitate better regulation, sustainable supply-chain certification and consumer product labelling.
This is a preview of subscription content, access via your institution
Access options
Subscribe to this journal
Receive 51 print issues and online access
$199.00 per year
only $3.90 per issue
Buy this article
- Purchase on SpringerLink
- Instant access to the full article PDF.
USD 39.95
Prices may be subject to local taxes which are calculated during checkout
Additional access options:
Figure 1: Top net importers and exporters of biodiversity threats.
The alternative text for this image may have been generated using AI.
Figure 2: Selected net exporters.
The alternative text for this image may have been generated using AI.
Figure 3: Flow map of threats to species.
The alternative text for this image may have been generated using AI.
References
- Chapin, F. S. et al. Consequences of changing biodiversity. Nature 405, 234–242 (2000)
Article CAS Google Scholar - Pimm, S. L., Russell, G. J., Gittleman, J. L. & Brooks, T. M. The future of biodiversity. Science 269, 347–350 (1995)
Article CAS ADS Google Scholar - Donald, P. F. Biodiversity impacts of some agricultural commodity production systems. Conserv. Biol. 18, 17–38 (2004)
Article Google Scholar - Naidoo, R. & Adamowicz, W. L. Effects of economic prosperity on numbers of threatened species. Conserv. Biol. 15, 1021–1029 (2001)
Article Google Scholar - Mikkelson, G. M., Gonzalez, A. & Peterson, G. D. Economic inequality predicts biodiversity loss. PLoS ONE 2, e444 (2007)
Article ADS Google Scholar - Perfecto, I., Mas, A., Dietsch, T. & Vandermeer, J. Conservation of biodiversity in coffee agroecosystems: a tri-taxa comparison in southern Mexico. Biodivers. Conserv. 12, 1239–1252 (2003)
Article Google Scholar - Philpott, S. M. et al. Biodiversity loss in Latin American coffee landscapes: review of the evidence on ants, birds, and trees. Conserv. Biol. 22, 1093–1105 (2008)
Article Google Scholar - Fearnside, P. M. Soybean cultivation as a threat to the environment in Brazil. Environ. Conserv. 28, 23–38 (2001)
Article CAS Google Scholar - Nepstad, D. C., Stickler, C. M. & Almeida, O. T. Globalization of the Amazon soy and beef industries: opportunities for conservation. Conserv. Biol. 20, 1595–1603 (2006)
Article Google Scholar - Shearman, P. L., Ash, J., Mackey, B., Bryan, J. E. & Lokes, B. Forest conversion and degradation in Papua New Guinea 1972–2002. Biotropica 41, 379–390 (2009)
Article Google Scholar - Michael E, H. An assessment of the status of the coral reefs of Papua New Guinea. Mar. Poll. Bull. 29, 69–73 (1994)
Article Google Scholar - Koh, L. P. & Wilcove, D. S. Cashing in palm oil for conservation. Nature 448, 993–994 (2007)
Article CAS ADS Google Scholar - Giles, B. G., Ky, T. S., Hoang, H. & Vincent, A. C. J. in Topics in Biodiversity and Conservation Vol. 3 (eds Hawksworth, D. L. & Bull, A. T. ) 157–173 (Springer Netherlands, 2006)
Google Scholar - Lenzen, M., Murray, J., Sack, F. & Wiedmann, T. Shared producer and consumer responsibility – theory and practice. Ecol. Econ. 61, 27–42 (2007)
Article Google Scholar - Peters, G. P., Minx, J. C., Weber, C. L. & Edenhofer, O. Growth in emission transfers via international trade from 1990 to 2008. Proc. Natl Acad. Sci. USA (2011)
- Edwards, D. P., Fisher, B. & Wilcove, D. S. High conservation value or high confusion value? Sustainable agriculture and biodiversity conservation in the tropics. Conserv. Lett. 5, 20–27 (2012)
Article Google Scholar - Convention on International Trade in Endangered Species of Wild Fauna and Flora. http://www.cites.org (1979)
- Villasante, S., Rodríguez, D., Antelo, M., Quaas, M. & Österblom, H. The Global Seafood Market Performance Index: a theoretical proposal and potential empirical applications. Mar. Policy 36, 142–152 (2012)
Article Google Scholar - Rotherham, T. Forest management certification around the world — progress and problems. For. Chron. 87, 603–611 (2011)
Article Google Scholar - Parsons, E. C. M. & Cornick, L. A. Sweeping scientific data under a polar bear skin rug: The IUCN and the proposed listing of polar bears under CITES Appendix I. Mar. Policy 35, 729–731 (2011)
Article Google Scholar - Huang, A. Y., Lenzen, M., Weber, C., Murray, J. & Matthews, H. S. The role of input-output analysis for the screening of corporate carbon footprints. Econ. Syst. Res. 21, 217–242 (2009)
Article Google Scholar - Blackman, A. & Rivera, J. Producer-level benefits of sustainability certification. Conserv. Biol. 26, 1176–1185 (2011)
Article Google Scholar - Pacala, S. & Socolow, R. Stabilization wedges: Solving the climate problem for the next 50 years with current technologies. Science 305, 968–972 (2004)
Article CAS ADS Google Scholar - Ehrlich, P. R. & Pringle, R. M. Where does biodiversity go from here? A grim business-as-usual forecast and a hopeful portfolio of partial solutions. Proc. Natl Acad. Sci. USA 105, 11579–11586 (2008)
Article CAS ADS Google Scholar - World Trade Organization. WTO Rules and Environmental Policies: GATT Exceptions. http://www.wto.org/english/tratop_e/envir_e/envt_rules_exceptions_e.htm (2012)
- International Union for Conservation of Nature. The IUCN Red List of Threatened Species. Version 2011.2. http://www.iucnredlist.org (2011)
- BirdLife International. Threatened Birds of the World. http://www.birdlife.org (2011)
- Lenzen, M., Kanemoto, K., Moran, D. & Geschke, A. The Eora Global Multi-Region Input-Output Tables. ISA, Univ. Sydney, Australia http://www.worldmrio.com (2011)
- Leontief, W. & Ford, D. Environmental repercussions and the economic structure: an input-output approach. Rev. Econ. Stat. 52, 262–271 (1970)
Article Google Scholar
Acknowledgements
We thank C. Pollock and M. Hoffmann from the IUCN and A. Symes from BirdLife International for advice on using the Red Lists. The work described in this paper was financially supported by the Australian Research Council through its Discovery Project DP0985522 and its Linkage Project LP0669290.
Author information
Authors and Affiliations
- ISA, School of Physics A28, The University of Sydney, New South Wales 2006, Australia,
M. Lenzen, D. Moran, K. Kanemoto, B. Foran, L. Lobefaro & A. Geschke - Graduate School of Environmental Studies, Tohoku University, Sendai 980-8579, Japan,
K. Kanemoto - Institute of Land Water and Society, Charles Sturt University, Albury, New South Wales 2640, Australia,
B. Foran - Department of Business and Law Studies, I Faculty of Economics, University of Bari Aldo Moro, 70124 Bari, Italy,
L. Lobefaro
Authors
- M. Lenzen
- D. Moran
- K. Kanemoto
- B. Foran
- L. Lobefaro
- A. Geschke
Contributions
M.L. and D.M. conducted the analysis and prepared the figures. M.L., D.M. and B.F. wrote the paper. K.K., L.L. and A.G. prepared the data.
Corresponding author
Correspondence toM. Lenzen.
Ethics declarations
Competing interests
The authors declare no competing financial interests.
Supplementary information
PowerPoint slides
Rights and permissions
About this article
Cite this article
Lenzen, M., Moran, D., Kanemoto, K. et al. International trade drives biodiversity threats in developing nations.Nature 486, 109–112 (2012). https://doi.org/10.1038/nature11145
- Received: 18 December 2011
- Accepted: 16 April 2012
- Published: 06 June 2012
- Issue date: 07 June 2012
- DOI: https://doi.org/10.1038/nature11145
This article is cited by
Editorial Summary
The biodiversity cost of international trade
This study develops a global model linking threatened-species records published in the International Union for the Conservation of Nature Red List to worldwide industries causing these threats through the production of commodities such as agricultural crops and timber. Close to one-third of global species threats are due to international trade, according to this model. The resulting 'biodiversity footprint' reveals how consumers in developed countries drive species threats in developing countries. The United States, European Union and Japan emerge as the main final destinations of biodiversity-implicated commodities, with the coffee, rubber, cocoa, palm oil, fisheries and forestry industries among the most destructive.