Convergence of terrestrial plant production across global climate gradients (original) (raw)
- Article
- Published: 20 July 2014
Nature volume 512, pages 39–43 (2014) Cite this article
- 19k Accesses
- 359 Citations
- 92 Altmetric
- Metrics details
Subjects
A Corrigendum to this article was published on 18 May 2016
This article has been updated
Abstract
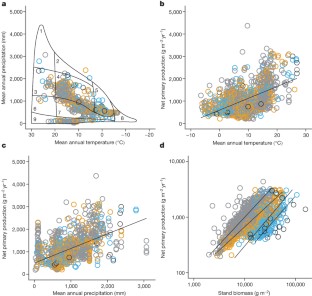
Variation in terrestrial net primary production (NPP) with climate is thought to originate from a direct influence of temperature and precipitation on plant metabolism. However, variation in NPP may also result from an indirect influence of climate by means of plant age, stand biomass, growing season length and local adaptation. To identify the relative importance of direct and indirect climate effects, we extend metabolic scaling theory to link hypothesized climate influences with NPP, and assess hypothesized relationships using a global compilation of ecosystem woody plant biomass and production data. Notably, age and biomass explained most of the variation in production whereas temperature and precipitation explained almost none, suggesting that climate indirectly (not directly) influences production. Furthermore, our theory shows that variation in NPP is characterized by a common scaling relationship, suggesting that global change models can incorporate the mechanisms governing this relationship to improve predictions of future ecosystem function.
This is a preview of subscription content, access via your institution
Access options
Subscribe to this journal
Receive 52 print issues and online access
$199.00 per year
only $3.83 per issue
Buy this article
- Purchase on SpringerLink
- Instant access to the full article PDF.
USD 39.95
Prices may be subject to local taxes which are calculated during checkout
Additional access options:
Figure 1: Global variation in annual net primary production for 1,247 woody plant communities grouped by age class.
The alternative text for this image may have been generated using AI.
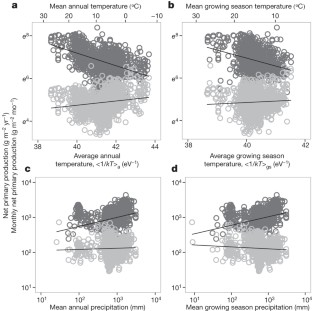
Figure 2: Net primary production of woody plant communities across global climate gradients.
The alternative text for this image may have been generated using AI.
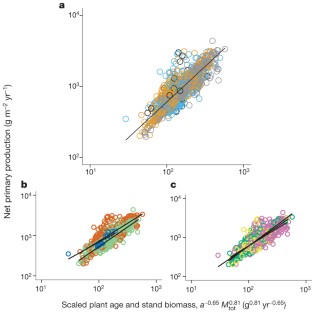
Figure 3: Global variation in annual net primary production of woody plant communities expressed as a general scaling function of plant age a and stand biomass _M_tot.
The alternative text for this image may have been generated using AI.
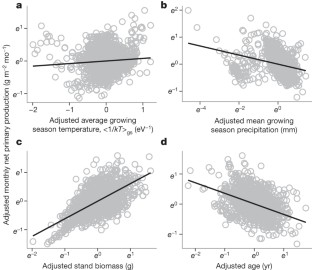
Figure 4: Partial regression plots illustrating relationships between monthly net primary production (NPP/_l_gs) and individual covariates from equation (4) for 1,247 woody plant communities.
The alternative text for this image may have been generated using AI.
Change history
06 August 2014
Figure 3 _y_-axis label was incorrect and has been fixed.
References
- Schimel, D. S. et al. Recent patterns and mechanisms of carbon exchange by terrestrial ecosystems. Nature 414, 169–172 (2001)
Article ADS CAS PubMed Google Scholar - Lieth, H. in Primary Productivity of the Biosphere (eds Lieth, H. & Whittaker, R. H. ) (Springer, 1975)
Book Google Scholar - Schuur, E. A. G. Productivity and global climate revisited: The sensitivity of tropical forest growth to precipitation. Ecology 84, 1165–1170 (2003)
Article Google Scholar - Huxman, T. E. et al. Convergence across biomes to a common rain-use efficiency. Nature 429, 651–654 (2004)
Article ADS CAS PubMed Google Scholar - Ponce Campos, G. E. et al. Ecosystem resilience despite large-scale altered hydroclimatic conditions. Nature 494, 349–352 (2013)
Article ADS CAS PubMed Google Scholar - Berry, J. & Bjorkman, O. Photosynthetic response and adaptation to temperature in higher plants. Annu. Rev. Plant Physiol. 31, 491–543 (1980)
Article Google Scholar - Enquist, B. J., Kerkhoff, A. J., Huxman, T. E. & Economo, E. P. Adaptive differences in plant physiology and ecosystem paradoxes: insights from metabolic scaling theory. Glob. Change Biol. 13, 591–609 (2007)
Article ADS Google Scholar - Kerkhoff, A. J., Enquist, B. J., Elser, J. J. & Fagan, W. F. Plant allometry, stoichiometry and the temperature-dependence of primary productivity. Glob. Ecol. Biogeogr. 14, 585–598 (2005)
Article Google Scholar - Bonan, G. B. Physiological derivation of the observed relationship between net primary production and mean annual air temperature. Tellus B Chem. Phys. Meterol. 45, 397–408 (1993)
Article ADS Google Scholar - Chapin, F. S. Effects of plant traits on ecosystem and regional processes: A conceptual framework for predicting the consequences of global change. Ann. Bot. (Lond.) 91, 455–463 (2003)
Article Google Scholar - Enquist, B. J., West, G. B. & Brown, J. H. Extensions and evaluations of a general quantitative theory of forest structure and dynamics. Proc. Natl Acad. Sci. USA 106, 7046–7051 (2009)
Article ADS CAS PubMed PubMed Central Google Scholar - West, G. B., Enquist, B. J. & Brown, J. H. A general quantitative theory of forest structure and dynamics. Proc. Natl Acad. Sci. USA 106, 7040–7045 (2009)
Article ADS CAS PubMed PubMed Central Google Scholar - Enquist, B. J. et al. A general integrative model for scaling plant growth, carbon flux, and functional trait spectra. Nature 449, 218–222 (2007)
Article ADS CAS PubMed Google Scholar - Brown, J. H., Gillooly, J. F., Allen, A. P., Savage, V. M. & West, G. B. Toward a metabolic theory of ecology. Ecology 85, 1771–1789 (2004)
Article Google Scholar - Allen, A. P., Gillooly, J. F. & Brown, J. H. Linking the global carbon cycle to individual metabolism. Funct. Ecol. 19, 202–213 (2005)
Article Google Scholar - Enquist, B. J. & Bentley, L. P. in Metabolic Ecology: A Scaling Approach (eds Sibly, R. M., Brown, S. & Kodric-Brown, A. ) 164–187 (Wiley, 2012)
Book Google Scholar - Gates, D. M. Biophysical Ecology (Springer, 1980)
Book Google Scholar - Helliker, B. R. & Richter, S. L. Subtropical to boreal convergence of tree-leaf temperatures. Nature 454, 511–514 (2008)
Article ADS CAS PubMed Google Scholar - Atkin, O. K. & Tjoelker, M. G. Thermal acclimation and the dynamic response of plant respiration to temperature. Trends Plant Sci. 8, 343–351 (2003)
Article CAS PubMed Google Scholar - New, M., Lister, D., Hulme, M. & Makin, I. A high-resolution data set of surface climate over global land areas. Clim. Res. 21, 1–25 (2002)
Article Google Scholar - Monteith, J. L. Climate and the efficiency of crop production in Britain. Phil. Trans. R. Soc. Lond. B 281, 277–294 (1977)
Article ADS Google Scholar - Renee Brooks, J., Barnard, H. R., Coulombe, R. & McDonnell, J. J. Ecohydrologic separation of water between trees and streams in a Mediterranean climate. Nature Geosci. 3, 100–104 (2010)
Article ADS CAS Google Scholar - Gower, S. T., McMurtrie, R. E. & Murty, D. Aboveground net primary production decline with stand age: potential causes. Trends Ecol. Evol. 11, 378–382 (1996)
Article CAS PubMed Google Scholar - Ryan, M. G. & Yoder, B. J. Hydraulic limits to tree height and tree growth. Bioscience 47, 235–242 (1997)
Article Google Scholar - DeLucia, E. H., Drake, J. E., Thomas, R. B. & Gonzalez-Meler, M. Forest carbon use efficiency: is respiration a constant fraction of gross primary production? Glob. Change Biol. 13, 1157–1167 (2007)
Article ADS Google Scholar - Kerkhoff, A. J. & Enquist, B. J. Ecosystem allometry: the scaling of nutrient stocks and primary productivity across plant communities. Ecol. Lett. 9, 419–427 (2006)
Article PubMed Google Scholar - Muller-Landau, H. C. et al. Testing metabolic ecology theory for allometric scaling of tree size, growth, and mortality in tropical forests. Ecol. Lett. 9, 575–588 (2006)
Article PubMed Google Scholar - Niklas, K. J., Midgley, J. J. & Rand, R. H. Tree size frequency distributions, plant density, age and community disturbance. Ecol. Lett. 6, 405–411 (2003)
Article Google Scholar - Yvon-Durocher, G. et al. Reconciling the temperature dependence of respiration across timescales and ecosystem types. Nature 487, 472–476 (2012)
Article ADS CAS PubMed Google Scholar - Wright, I. J. & Westoby, M. Differences in seedling growth behaviour among species: trait correlations across species, and trait shifts along nutrient compared to rainfall gradients. J. Ecol. 87, 85–97 (1999)
Article Google Scholar - Kempes, C. P., West, G. B., Crowell, K. & Girvan, M. Predicting maximum tree heights and other traits from allometric scaling and resource limitations. PLoS ONE 6, e20551 (2011)
Article ADS CAS PubMed PubMed Central Google Scholar - Stegen, J. C. et al. Variation in above-ground forest biomass across broad climatic gradients. Glob. Ecol. Biogeogr. 20, 744–754 (2011)
Article Google Scholar - Larjavaara, M. & Muller-Landau, H. C. Rethinking the value of high wood density. Funct. Ecol. 24, 701–705 (2010)
Article Google Scholar - Stephenson, N. L. et al. Rate of tree carbon accumulation increases continuously with tree size. Nature 507, 90–93 (2014)
Article ADS CAS PubMed Google Scholar - Cannell, M. G. R. World Forest Biomass and Primary Production Data (Academic, 1982)
Google Scholar - Luo, T. X. Patterns of Biological Production and its Mathematical Models for Main Forest Types of China. PhD thesis, Chinese Academy of Sciences. (1996)
- Clark, D. S. et al. Net primary productivity in tropical forests: An evaluation and synthesis of existing field data. Ecol. Appl. 11, 371–384 (2001)
Article Google Scholar - Luyssaert, S. et al. CO2 balance of boreal, temperate, and tropical forests derived from a global database. Glob. Change Biol. 13, 2509–2537 (2007)
Article ADS Google Scholar - Whittaker, R. H. Communities and Ecosystems (Macmillan, 1970)
Google Scholar - Cairns, M. A., Brown, S., Helmer, E. H. & Baumgardner, G. A. Root biomass allocation in the world's upland forests. Oecologia 111, 1–11 (1997)
Article ADS PubMed Google Scholar - Vieira, S. et al. Slow growth rates of Amazonian trees: Consequences for carbon cycling. Proc. Natl Acad. Sci. USA 102, 18502–18507 (2005)
Article ADS CAS PubMed PubMed Central Google Scholar - Häsler, R., Streule, A. & Turner, H. Shoot and root growth of young Larix decidua in contrasting microenvironments near the Alpine timberline. Phyton 39, 47–52 (1999)
Google Scholar - Fredlund, D. G., Rahardjo, H. & Fredlund, M. D. Unsaturated Soil Mechanics in Engineering Practice (Wiley, 2012)
Book Google Scholar - FAO/IIASA/ISRIC/ISSCAS/JRC. Harmonized World Soil Database (version 1.2) (FAO and IIASA, 2012)
- Huston, M. A. Precipitation, soils, NPP, and biodiversity: resurrection of Albrecht's curve. Ecol. Monogr. 82, 277–296 (2012)
Article Google Scholar - R Development Core Team R: A Language and Environment for Statistical Computing (R Foundation for Statistical Computing, 2011)
- Warton, D. I., Duursma, R. A., Falster, D. S. & Taskinen, S. smatr 3– an R package for estimation and inference about allometric lines. Methods Ecol. Evol. 3, 257–259 (2012)
Article Google Scholar - Brett, M. T. When is a correlation between non-independent variables “spurious”? Oikos 105, 647–656 (2004)
Article Google Scholar - Ryan, T. P. Modern Regression Methods (Wiley, 1997)
MATH Google Scholar
Acknowledgements
S.T.M. and B.J.E. were supported by an NSF MacroSystems award (1065861) and a fellowship from the Aspen Center for Environmental Studies. D.C. was supported by the National Natural Science Foundation of China (31170374 and 31370589) and Fujian Natural Science Funds for Distinguished Young Scholar (2013J06009). A.J.K. was supported by a sabbatical supplement from Kenyon College, and by a National Science Foundation ROA supplement (1065861) to the NSF MacroSystems award (1065861) to B.J.E.
Author information
Authors and Affiliations
- Department of Ecology and Evolutionary Biology, University of Arizona, Tucson, 85721, Arizona, USA
Sean T. Michaletz & Brian J. Enquist - Key Laboratory of Humid Subtropical Eco-geographical Process, Fujian Normal University, Ministry of Education, Fuzhou, Fujian Province 350007, China,
Dongliang Cheng - Department of Biology, Kenyon College, Gambier, 43022, Ohio, USA
Andrew J. Kerkhoff - The Santa Fe Institute, USA, 1399 Hyde Park Road, Santa Fe, New Mexico 87501, USA,
Brian J. Enquist - The iPlant Collaborative, Thomas W. Keating Bioresearch Building, 1657 East Helen Street, Tucson, Arizona 85721, USA,
Brian J. Enquist - Aspen Center for Environmental Studies, 100 Puppy Smith Street, Aspen, Colorado 81611, USA,
Brian J. Enquist
Authors
- Sean T. Michaletz
- Dongliang Cheng
- Andrew J. Kerkhoff
- Brian J. Enquist
Contributions
S.T.M., D.C., A.J.K. and B.J.E. compiled data, developed theory, performed analyses and wrote the paper.
Corresponding authors
Correspondence toDongliang Cheng or Brian J. Enquist.
Ethics declarations
Competing interests
The authors declare no competing financial interests.
Extended data figures and tables
Extended Data Figure 1 Partial residual plots showing linearization of NPP relationships by power and exponential transforms of precipitation and plant age.
Relationships were best linearized by power transforms of both precipitation and age, so power laws were used to characterize precipitation- and age-dependence of NPP in Supplementary Information Equation (S6). Multiple regression models used average growing season temperatures <1/_kT_>gs and mean growing season precipitation _P_gs, but similar results were observed using mean annual estimates. Dashed line, OLS linear regression line; solid line, Loess smooth. a, b, Power transform for precipitation and age; c, d, power transform for precipitation and exponential transform for age; e, f, exponential transform for precipitation and power transform for age; g, h, exponential transform for precipitation and age.
Extended Data Figure 2 Relationship between mean annual temperature and growing season length (_r_2 = 0.853, P < 2.2 × 10⁻¹⁶).
Extended Data Figure 3 Partial regression plots showing relationships between annual net primary production (NPP) and each covariate.
Both variables in each plot are residuals. Plots show the correct relationship (slope and variance) between NPP and each covariate while controlling for the influence of all other model covariates. All relationships were significant at α = 0.001, except for growing season length (P = 0.026). However, total stand biomass and plant age explained most of the variation in NPP, while temperature, growing season length, and mean annual precipitation each explained less than 10% of the variation (Table 1). a, Relationship between NPP and average growing season temperature <1/_kT_>gs. b, Relationship between NPP and mean growing season precipitation _P_gs. c, Relationship between NPP and growing season length _l_gs. d, Relationship between NPP and total stand biomass _M_tot. e, Relationship between NPP and plant age a.
Extended Data Figure 4 Global variation in annual net primary production (NPP) for 1,247 forest stands expressed as a general scaling function of age a and total stand biomass _M_tot.
Stands grouped according to standard biome definitions39. Grey, desert; light orange, savannah; light blue, temperate forest; black, temperate rainforest; yellow, taiga; dark blue, tropical rainforest; dark orange, tropical seasonal forest; pink, tundra; green, woodland/shrubland.
Extended Data Table 1 Bivariate regression fits of net primary production on temperature and precipitation data for 1,247 woody plant communities
Extended Data Table 2 Standardized major axis (SMA) regression fits of annual net primary production (NPP) on stand biomass for 1,247 woody plant communities
Extended Data Table 3 Multiple regression fits of metabolic scaling theory for terrestrial net primary production (equations (3) and (4)) to a global compilation of data for root (subscript R; 1,236 stands), aboveground woody (subscript AGW; 1,233 stands) and foliage (subscript F; 1,234 stands) components of net primary production
Supplementary information
PowerPoint slides
Source data
Rights and permissions
About this article
Cite this article
Michaletz, S., Cheng, D., Kerkhoff, A. et al. Convergence of terrestrial plant production across global climate gradients.Nature 512, 39–43 (2014). https://doi.org/10.1038/nature13470
- Received: 23 December 2013
- Accepted: 12 May 2014
- Published: 20 July 2014
- Issue date: 07 August 2014
- DOI: https://doi.org/10.1038/nature13470
This article is cited by
Comments
Commenting on this article is now closed.
- Troy Taylor 9 August 2014, 16:24
I would most like to know the distinct outlier in Fig 1b and 1c – which are probably the same site – that with highest NPP yet at intermediate temp and precip. Floristics, biogeography and phytosociology of this community please? - Sean Michaletz 3 September 2014, 13:27
In the article, reference 33 is incorrect. This reference should have been:
Larjavaara, M. & Muller-Landau, H. C. Temperature explains global variation in biomass among humid old-growth forests. Global Ecol. Biogeogr. 21, 998-1006 (2012).
The authors apologize for any confusion caused to readers. - Sean Michaletz 12 September 2014, 11:36
Hello Troy Taylor,
All of the source data used in the analyses are available at http://www.nature.com/natur....
Best wishes,
Sean Michaletz
Editorial Summary
Plant productivity response to climate
Net primary production is affected by temperature and precipitation, but is this a direct effect on plant metabolism or an indirect ecological effect mediated by changes in growing season length and plant biomass? Here, Sean Michaletz et al. develop metabolic scaling theory to test the relative importance of direct and indirect climate effects. Applying their model to a global data set of plant productivity, the authors conclude that it is indirect effects that explain the influence of climate on productivity. Temperature and water availability are fundamental drivers of plant physiology and ecosystem metabolism at local scales, but at global scales climate influences net primary production indirectly via plant age and stand biomass, which is largely driven by maximum plant size.