1,003 reference genomes of bacterial and archaeal isolates expand coverage of the tree of life (original) (raw)
Main
Systematic surveys of the diversity of cultivated microorganisms have lagged behind improvements in sequencing technologies. Traditionally, most isolate sequencing projects are chosen based on the clinical or biotechnological relevance of the target organisms or their physiology1. In 2015, 43% of sequenced bacterial genomes comprised just ten human pathogenic species. While sequencing different strains of the same species aided our understanding of pathogenesis, the focus on specific bacterial species results in a biased phylogenetic representation of sequence space. This skewed phylogeny narrowed our view of the functional and evolutionary diversity of microbial life. There is a direct correlation between phylogenetic distance and novel function discovery2,3, which suggests that filling the gaps in the phylogenetic tree might result in a substantial increase in new genes, protein families and pathways4.
Reference genomes can fill phylogenetic gaps, but also serve as anchors for the identification of sequence fragments from metagenomic studies. Previous efforts to expand the bacterial and archaeal reference genomes by targeted sequencing of phylogenetically underrepresented lineages have enabled vast improvements in taxonomic assignment in metagenomic data sets5. Furthermore, access to completed genomes enables more accurate whole-genome-based taxonomic assignments6,7 and improved phylogenies8,9.
Bacterial and archaeal type strains are the representative unit of a microbial species, and are chosen when the species name is established. Type strains are maintained in at least two different culture collections and provide easy access to source strain material for subsequent experiments. Typically, a type strain has well-characterized taxonomic and phenotypic data, isolation source metadata, and other criteria, as defined by the International Code of Nomenclature of Prokaryotes (ICNP)[10](/articles/nbt.3886#ref-CR10 "Parker, C.T., Tindall, B.J. & Garrity, G.M. International Code of Nomenclature of Prokaryotes. Int. J. Syst. Evol. Microbiol. http://dx.doi.org/10.1099/ijsem.0.000778
(2015)."). As of December 5, 2015, there were 12,981 bacterial and archaeal species with valid, published names, with 650 new type strains added (on average) every year[11](/articles/nbt.3886#ref-CR11 "Garrity, G.M. A genomics driven taxonomy of Bacteria and Archaea: are we there, yet? J. Clin. Microbiol. 54, 1956–1963 (2016)."),[12](/articles/nbt.3886#ref-CR12 "Kyrpides, N.C. et al. Genomic encyclopedia of bacteria and archaea: sequencing a myriad of type strains. PLoS Biol. 12, e1001920 (2014)."). However, despite their importance, the genomes of only 826 type strains were publicly available at the start of this study.The Genomic Encyclopedia of Bacteria and Archaea (GEBA) pilot project presented the analysis of 56 type-strain genomes and validated the usefulness of a phylogeny-driven 'encyclopedia' of bacteria and archaea3. We now present a substantially expanded data set (GEBA-I) comprising 1,003 reference genomes from 974 bacterial and 29 archaeal type strains. Our objectives were to provide an expanded reference genome catalog of broad phylogenetic and physiological diversity, to determine how this catalog facilitates the discovery of protein families and expands the diversity of known functions, and to ascertain whether these type-strain genomes improve the recruitment and phylogenetic assignment of existing metagenomic sequences.
Results
Increased phylogenetic diversity of microbial genomes
974 bacterial and 29 archaeal genomes (from 579 genera in 21 phyla and 43 classes) were sequenced as part of the GEBA Initiative (GEBA-I), using a phylogeny-based scoring system for strain selection6,13.
Of the 1,003 genomes presented, 396 GEBA-I genomes were the first sequenced representative of a genus (Fig. 1a). The Caldithrixae, Deferribacteres, Synergistetes and Thermodesulfobacteria (Fig. 1a) phyla have the most new genera. The most populous phyla, in terms of numbers of genomes sequenced, were the Proteobacteria (with 330 genomes), Firmicutes (178), Bacteroidetes (163) and Actinobacteria (157). The remaining 175 genomes belonged to 17 additional phyla, including the only sequenced representative of the Caldithrixae phylum (Supplementary Table 1). The GEBA-I strains originate from a multitude of habitats including extreme environments, terrestrial biomes, industrial waste and human body sites (Supplementary Fig. 1) and unsurprisingly have diverse physiology, genome size and average G+C content (Supplementary Fig. 2). GEBA-I is a high-quality reference resource with 99.4% (on average) genome completeness (assessed using CheckM14; Supplementary Table 1). Annotation of the 1,003 GEBA-I genomes resulted in 3,472,483 predicted genes from 3.75 Gbp of assembled sequence data (Supplementary Fig. 3 and Supplementary Table 1). All GEBA-I genomes are publicly available through the Integrated Microbial Genomes with Microbiomes (IMG/M) system15 and GenBank, and the corresponding strains through the respective culture collection (Supplementary Table 1).
Figure 1: GEBA-I strain phylogeny and distribution.

(a) Maximum likelihood tree based on concatenated alignment of 56 conserved protein markers from representative genomes from all cultivated phyla. Phyla containing a GEBA-I genome are colored red, while all other phyla are colored gray. Pie charts represent the fraction of genera contributed by GEBA-I genomes (red) to the total number of genera per phylum (blue). The number of new genera added by GEBA-I per phylum is displayed next to the pie charts. Bootstrap support values ≥50% are shown with small circles on nodes with robust phylogenetic support. (b) Overall increase in 16S rRNA gene diversity relative to all the type strains. Blue denotes the genetic diversity covered by 828 genomes of type strains before GEBA-I, red denotes the diversity covered by the GEBA-I genomes and gray denotes the remaining type strains lacking a genome sequence. Balanced relative phylogenetic diversity (bRPD) was calculated by adding branch lengths between each leaf and root node in the tree followed by proportional downweighting of internal branches6.
To quantify the increase in phylogenetic diversity contributed by GEBA-I genomes compared with all previously available, validly named archaeal and bacterial species (i.e., type strains), we measured the diversity distance of all sequenced type strains in a comprehensive 16S rRNA gene tree6. The GEBA-I genomes increased the phylogenetic distance threefold, expanding the overall diversity of the type-strain sequence space by ∼24% (Fig. 1b). Further, we applied a whole-genome comparative analysis based on the average nucleotide identity to verify the relative novelty of the GEBA-I genomes compared to a set of 14,625 control genomes. We found that the vast majority (845/1,003) of the GEBA-I genomes were 'singletons' on the basis of the proposed criteria for defining a “species group”7, verifying that no other sequenced representative of that species is available.
Expanding the universe of known proteins
A total of 3,402,887 protein-coding sequences were predicted from the 1,003 GEBA-I genomes. We compared this data set with 23,470,984 non-redundant proteins from all available (14,625) control bacterial and archaeal genomes. Clustering ∼26 million total proteins at ∼30% sequence identity over 80% alignment length using KClust resulted in 1.89 million protein clusters (containing at least two sequences) and 2.6 million singletons. Of these, 55,105 clusters and 436,840 singletons were composed of proteins from GEBA-I genomes only (Supplementary Table 2), corresponding to a 10.5% increase in known protein sequence diversity.
To test if this represents a meaningful increase, or a mere continuation of a trend that has been ongoing since the advent of whole genome sequencing, we calculated the growth rate of new protein families (per 1,000 genomes) (Fig. 2a), and the number of protein families added by newly sequenced bacterial and archaeal genomes over time (i.e., in chronological order of their date of release; Fig. 2a, inset). First, we observed that the growth rate of new protein families markedly declined after the first 2,000 sequenced genomes. Addition of the GEBA-I genomes (noted in red) resulted in a dramatic increase in the growth rate of new protein families, equivalent to the protein family novelty initially observed with the first 2,000 genomes. Second, we found that the number of protein families added over time was initially large with the addition of the first 5,000 genomes, but almost plateaued at around 15,000 genomes (Fig. 2a, inset). The addition of GEBA-I genomes led to a substantial increase in the number of added protein families (Fig. 2a, inset). Together, this reinforces the hypothesis that substantial functional gene novelty remains to be discovered within the cultivated genome space and suggests that continued phylogeny-driven sequencing efforts will result in an expanded catalog of diverse protein families.
Figure 2: Protein clusters identified using GEBA-I genomes.
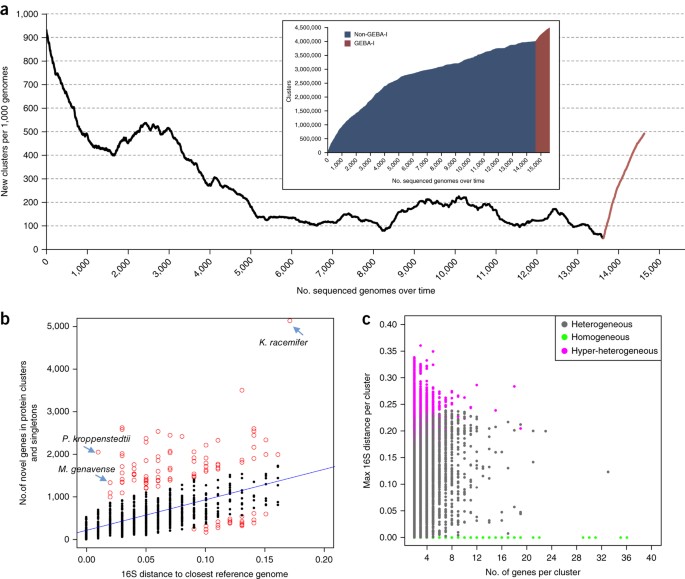
(a) Change in growth rate of protein families identified per 1,000 genomes over the years and increase in number of new protein families over time, as new genomes were sequenced and added to public databases (inset). (b) Relationship between number of genes in protein clusters and singletons and the minimum 16S rRNA distance of each GEBA-I genome to its closest non-GEBA relative. Outliers, defined as points beyond 90% of the data with the smallest absolute residuals with a linear model, are depicted as red open circles. (c) Maximum 16S rRNA distance of genomes contributing a GEBA-I-only protein cluster. Each data point represents a single GEBA-I-only protein cluster and is colored by the cluster type, x axis is the total number of genes in each cluster, and y axis is the maximum 16S distance of genomes contributing to that cluster.
In order to explore whether increased functional novelty is correlated with specific phylogenetic lineages, we examined the minimum 16S rRNA gene distance compared to the total number of new protein clusters for each GEBA-I genome (Fig. 2b). In general, genomes with increased phylogenetic distance (i.e., greatest 16S distance from reference) encoded the greatest number of novel protein families. As expected, many of the genomes with the greatest phylogenetic distance and number of novel genes belonged to phyla for which few or no sequenced representatives were previously available (Fig. 1a). For example, Ktedonobacter racemifer16, a member of the phylum Chloroflexi, contributed 5,102 genes to GEBA-I-only clusters and singletons (Fig. 2b). However, a handful of GEBA-I genomes with closely related reference genomes (i.e., near-identical 16S rRNA gene sequences) also encoded a preponderance of novel genes. The most striking outliers were Mycobacterium genavense ATCC 51234 and Promicromonospora kroppenstedtii RS16, DSM 19349, contributing 1,327 and 2,038 novel genes, respectively (Fig. 2b and Supplementary Table 2). For the M. genavense genome, this observation is explained by the highly conserved nature of the 16S rRNA gene for this group, with other sequenced markers revealing a higher rate of polymorphism, for example, the 16S-23S internal transcribed spacer is preferred for species discrimination17,18. Thus, the close evolutionary relationship for M. genavense implied by this minimum 16S rRNA gene distance (distance = 0.018, Mycobacterium parascrofulaceum) is likely an underestimation, and not a good indicator of actual evolutionary distance for this genome. Conversely, the relatively smaller sizes of genomes with high 16S distance to reference, but few novel genes (e.g., Mycoplasma elephantis, Allofustis seminis, both host-associated) suggests they may have undergone streamlining or genome reduction.
Exploring GEBA-I-only protein clusters
A total of 55,105 clusters were composed exclusively of proteins from GEBA-I genomes. Approximately 25% of these clusters (13,371 in total) contained proteins arising from a single genome (designated here as “homogeneous” or paralogous clusters), and possibly result from lifestyle-specific gene expansion, or from proliferation of integrated elements like phage or transposons (Fig. 2c). For example, the 13.6-Mbp genome of Ktedonobacter racemifer contributed a striking 411 homogeneous clusters, the largest number proportional to genome size of all the analyzed GEBA-I genomes; most of these clusters are implicated in regulatory functions, such as two-component signal transduction systems (TCS) involved in sensing and responding rapidly to environmental stimuli. Although TCS themselves are not novel, the K. racemifer encoded genes (e.g., Histidine Kinase, Cluster ID: 2509672) have a novel domain configuration involving multiple sensory PAS folds19, and high levels of sequence divergence from existing TCS (Supplementary Fig. 4). Four related clusters (Cluster IDs: 2586264, 809557, 4221619, 3082022) from the termite hindgut isolate Sphaerochaeta coccoides may represent another lifestyle-specific expansion20, with some clusters arranged as tandem arrays (Supplementary Fig. 5), suggesting gene expansion by recent gene duplication.
For the remaining 41,734 clusters in GEBA-I genomes (designated as “heterogeneous clusters”), varying levels of “heterogeneity” were identified in terms of membership within the same genus, family, order or class (Fig. 2c). We found a subset of clusters that originated from members of two or more phyla (designated as “hyper-heterogeneous” clusters (Fig. 2c). One of these clusters is a four-protein cluster (66% amino acid identity, Cluster ID: 2968370) present in four disparate species (Thermodesulfobacterium hveragerdense, Thermodesulfobacterium thermophilum, Thermodesulfovibrio thiophilus, Desulfurella acetivorans) from three phyla (Thermodesulfobacteria, Nitrospirae and Proteobacteria) that share a common physiology of thermophilic anaerobic sulfur reduction. While members of these particular genera or their higher taxonomic groups may not be well represented in sequence databases, the lack of cluster membership from genomes of relatively well-saturated phyla such as Proteobacteria is curious, suggesting horizontal gene transfer among these possibly cohabiting species. Further support for this speculation may be the putative function of the proteins themselves—rhodanese-like sulfotransferases, described as versatile proteins using persulfide chemistry to accomplish cellular functions ranging from cell cycle progression to stress resistance to sulfur metabolism21. A case with no apparent unifying theme in terms of known ecological niche or physiology is a co-localized pair of three-gene clusters (Cluster IDs: 4177102 and 4403394 with 49% and 43% amino acid identity, respectively) from two domains of life, namely, Maritalea myrionectae, Cucumibacter marinus (both Proteobacteria) and Methanolobus tindarius (an archaeon), with possible functions in quinolone export.
Hyperheterogeneous clusters are curious instances of phylogenetic discordance, that is, when the phylogenetic history of an individual gene is different from the known species history. Plausible explanations for this observation (as reviewed by Galtier and Daubin22) include: horizontal gene transfer, where the phylogeny is influenced by the number and nature of transfers that have transpired; incomplete lineage sorting due to rapid speciation events, that is, the ancestral polymorphism is not fully resolved into two monophyletic lineages when the second speciation occurs; hidden paralogy—for paralogs, the phylogeny partly reflects the duplication history of the gene independent of species divergence history, or convergent evolution.
The large number of singletons identified in the GEBA-I genomes represents potential new functions and confirms that a large proportion of functional novelty still remains to be captured. One such example is a putative pepsin A encoded by Endozoicomonas elysicola DSM 2238, isolated from the gastrointestinal tract of a mollusk sea slug. Although pepsin-like enzymes are commonly found in eukaryotes, the E. elysicola candidate is the first instance of a secreted bacterial pepsin (based on a signal peptide) containing all the conserved residues of its eukaryotic counterparts (Supplementary Fig. 6). To verify that singletons are not artifacts of gene prediction pipelines, we assessed their size distribution and presence of signaling or other structural motifs (Supplementary Table 2). Based on this, more than 70% of singletons are >100 amino acids in length, and of these, 31% possess either a signal peptide or two or more transmembrane helices.
Biosynthetic clusters for secondary metabolites
Microbial secondary metabolites are organic compounds that are not directly involved in primary growth and development, but rather have auxiliary functions such as defense, communication and other interactions. Genes encoding biosynthetic enzymes for the synthesis of secondary metabolites are typically co-localized on the chromosome and are referred to as “biosynthetic gene clusters” (BCs). While only a few of the selected type strains in this study were known to be prolific producers of secondary metabolites, a large bounty of potential new BCs were predicted in the GEBA-I genomes (Supplementary Table 3).
A total of 23,839 BCs were predicted from 1,003 GEBA-I genomes using the IMG-ABC system23. Three Pseudonocardiaceae genomes (Pseudonocardia acaciae, P. spinosispora and Sciscionella marina) encoded the greatest total number of BCs among all GEBA-I genomes (Fig. 3a). These included numerous nonribosomal peptide synthetases, polyketide synthetases, as well as lantipeptides, bacteriocins, ectoine thiopeptides, and others. We observed a clear correlation between the number of predicted BCs and genome size with an average of 6.41 (±2.4 s.d.) BCs predicted per Mb of sequence (Supplementary Fig. 7). Actinobacterial genomes were outliers with an average of 9.58 (±3.4 s.d.) BCs per Mb. This observation is likely reflective of their particular ecological niches involving multiple (perhaps antagonistic) interactions with cohabiting microbes (e.g., P. acaciae was isolated from a competitive plant rhizosphere environment). While Streptomyces species are known to be prolific producers of antibiotics and other natural products24, genomes from the Nocardiaceae and Pseudonocardiaceae families of Actinobacteria had not been sequenced extensively before this study, and therefore had not been intensively targeted for BC gene discovery. Given that six of the top ten BC-rich genomes in GEBA-I belong to the above two families, future sequencing efforts focused around these clades may prove fruitful for discovering natural products.
Figure 3: Distribution of biosynthetic clusters (BCs) in GEBA-I genomes.
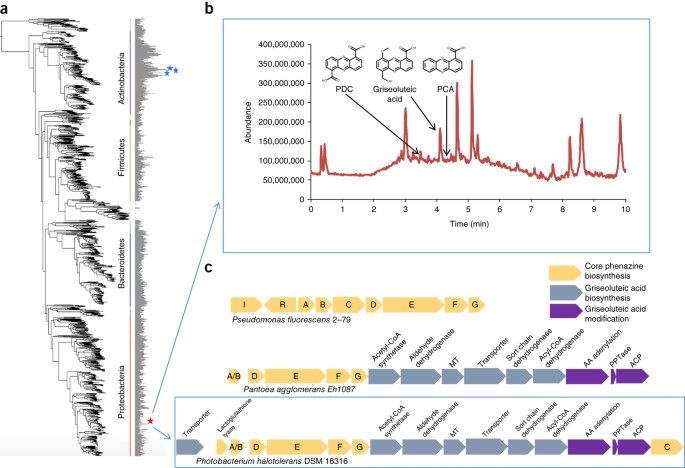
(a) Maximum likelihood phylogenetic tree using 56 conserved single-copy genes with horizontal bars representing the percentage of genome encoding biosynthetic gene clusters. Blue stars highlight GEBA-I genomes with the greatest percentage of BCs per genome. The red star indicates the phylogenetic placement of Photobacterium halotolerans DSM 18316 described in b and c. (b) Liquid chromatography–mass spectrometry (LC/MS) chromatogram from a crude extract of P. halotolerans DSM 18316 with labeled phenazine peaks. (c) Phenazine operon in P. halotolerans DSM 18316 compared to those from Pseudomonas fluorescens 2-79 and Pantoea agglomerans Eh1087.
On average, the GEBA-I genomes devote nearly 10% of their genome to secondary metabolite biosynthesis, with actinobacterial GEBA-I genomes apportioning an average 16.5% (±8% s.d.) of their genome. Among the actinobacterial GEBA-I soil isolates, Actinoalloteichus cyanogriseus and Smaragdicoccus niigatensis encode the greatest fraction of BCs at 39% and 36%, respectively. This is the highest percentage reported so far for any genome, trumping the previous record for Streptomyces bingchenggensis25. Given that Actinobacteria are vigorously pursued for new antimicrobial product discovery26, these two previously unrepresented genera isolated from soil and an oil spring, respectively, might contribute new classes of bioactive compounds.
In addition to predicting biosynthetic gene clusters, we annotated the class of secondary metabolite synthesized by each BC across the GEBA-I genomes. Most of the predicted BC products were unclassified, reflecting both the limited information available for characterized natural products and the rich genomic resource of biosynthetic capabilities contributed by GEBA-I. For example, nine new phenazine pathways with novel operon structures and genes were identified in the GEBA-I genomes23. Phenazines are a large class of nitrogen-containing heterocyclic secondary metabolites that have potent antimicrobial and antifungal activity, and are produced by a wide range of bacteria. The phenazine pathways encoded in the genomes of Microbulbifer variabilis ATCC 700307 and Photobacterium halotolerans DSM 18316 are the first observations of this capability in the families Alteromonadaceae and Vibrionaceae, respectively. A crude extract of P. halotolerans DSM 18316 produced three known phenazines PCA, PDC and griseoluteic acid; however, D-alanylgriseoluteic acid was not observed (Fig. 3b). The phenazine operon in P. halotolerans DSM 18316 included all of the core phenazine genes found across all taxa known to produce the two core phenazines (phenazine 1-carboxylic acid (PCA), and phenazine 1,6 dicarboxylic acid (PDC); Fig. 3c). This operon also contained additional phenazine-modifying genes that exhibited the same pathway architecture found in Pantoea agglomerans Eh1087, a known producer of griseoluteic acid as well as D-alanylgriseoluteic acid27. The three genes known to modify griseoluteic acid to D-alanylgriseoluteic acid in P. agglomerans Eh1087 are present in the P. halotolerans DSM 18316 genome, yet the amino acid incorporated by the amino acid adenylation domain is likely different. Some of the other prominent metabolites (unknown peaks in Fig. 3b) may contain this potentially new phenazine. Furthermore, we also identified the biosynthetic genes likely responsible for the pelagiomicin phenazine antibiotic (structure known) produced by M. variabilis ATCC 700307 (ref. 28) (Supplementary Fig. 8).
Improved taxonomic assignment of metagenomic sequences
The ability to phylogenetically analyze and provide taxonomic classification to metagenomic data is largely dependent upon reference microbial genomes. Previous efforts to expand the genomic reference set through inclusion of phylogenetically underrepresented lineages have yielded dramatic improvement in classification of metagenomic data5. Here, we evaluated whether the GEBA-I genomes could serve as phylogenetic anchors for metagenomic studies. A total of 3,402,887 GEBA-I proteins were compared to 2,664,695,939 non-redundant protein sequences derived from 4,948 metagenomes in the IMG database. The GEBA-I protein set recruited 25,576,559 previously unassigned metagenomic proteins from 4,650 metagenomes (Supplementary Table 4). The majority of newly recruited proteins were derived from metagenomes of terrestrial (32%), aquatic (28%) habitats and plant-associated samples (21%) (Fig. 4a and Supplementary Fig. 9). This finding is primarily attributed to the high proportion of metagenome samples from these particular habitats. Solirubrobacter soli DSM 22325 (ref. 29), a ginseng field soil isolate, recruited the highest number of metagenome proteins (Supplementary Fig. 9); habitat distribution of these new hits were 50% terrestrial, 34% plant host associated, 6.5% aquatic, and a tiny fraction were from termite gut samples.
Figure 4: Recruitment of metagenomic sequences by GEBA-I genomes.
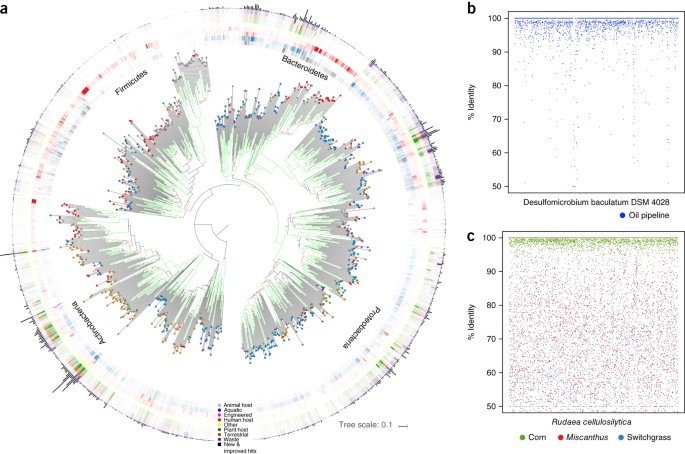
(a) Overview of metagenomic protein sequence recruitment by individual GEBA-I genomes. Phylogenetic analyses of whole genome sequences were conducted using the high-throughput version of the Genome-Blast Distance Phylogeny approach. Internal branch support above 60% is colored in a range from red (60%) to green (100%) The colored dots decorating the terminus of every tree branch indicates the isolation source habitat for the given GEBA-I genome. The outermost circle bearing a black bar chart denotes the total number of metagenomic sequences with protein blast hits to that GEBA-I genome (Supplementary Fig. 7 and Supplementary Table 4). The habitat distribution for these hits is given in the colored concentric circles that follow. The intensity of color is weighted by fraction of total hits to a habitat. (b) Protein recruitment plot showing amino acid percent identity (y axis) of top hits of Desulfomicrobium baculatum DSM 4028 CDS against metagenomic sample from biofilm of a corroded oil pipeline (IMG taxon_oid: 3300002702). CDS are ordered on the x axis by position on one contiguous scaffold available for this genome. (c) Protein recruitment plot showing percent identity (y axis) of Rudaea cellulosilytica DSM 22992 CDS top protein blast hits against metagenomic sample from corn rhizoplane (IMG taxon_oid: 3300001904). For contrast, top hits against two other rhizosphere samples are included (switchgrass (IMG taxon_oid: 3300002128), and Miscanthus (IMG taxon_oid: 3300001991). CDS are ordered on the x axis by position on six discrete scaffolds (which are themselves ordered by descending sequence length) available for this genome.
Although GEBA-I strain selection was based on phylogenetic placement rather than numerical dominance within certain environmental samples, about 282 genomes, designated “top recruiters,” were found to notably recruit protein sequences from 1,204 individual environmental samples. Furthermore, we found evidence that a number of the genomes that significantly recruited metagenomic proteins may serve as important members of the microbial community in terms of abundance and encoded metabolic potential. For example, cellulose-degrading soil isolate, Rudaea cellulosilytica30 preferentially recruits sequences (over 87% coverage of total coding sequence (CDS)) from two corn rhizoplane samples, at high abundance (based on an average read depth of ∼25), but not other plant rhizosphere samples (Fig. 4c). We hypothesize that R. cellulosilytica is an opportunist in senescing corn rhizoplane samples taken from a drought-stressed continuous corn plot (where root decomposition from previous years probably provided plentiful substrate for its growth), because it is not present in samples from unstressed corn in subsequent years (personal communication, James M. Tiedje, Michigan State University). Another notable example is an anaerobic sulfate reducer, Desulfomicrobium baculatum DSM 4028 (over 85% coverage of total isolate CDS), which is abundant in an oil pipeline biofilm sample and likely had a pivotal role in the microbial-induced corrosion that led to failure of the pipeline31 (Fig. 4b).
Overall, we found a correlation between isolation source of the GEBA-I strain and the metagenome sample habitat, as expected. Some interesting exceptions were identified, for example, Inquilinus limosus DSM 16000, a GEBA-I strain isolated from sputum of cystic fibrosis (CF) patients (although not known to cause disease or pathology) showed recruitment of proteins from several plant rhizosphere metagenome samples (e.g., Arabidopsis, corn). We hypothesize that closely related Inquilinus species or strains may be members of the plant root microbial community. Indeed, Inquilinus spp. have been previously reported in 16S rRNA surveys of root nodules of wild legumes32,33. There is mounting evidence that human-pathogenic enteric bacteria such as Salmonella can colonize plant tissues, and use similar mechanisms for infection of animal and plant hosts34,35. Our findings (and additional examples discussed in Supplementary Note) serve to further underscore the impact of broadening the phylogenomic representation of public databases, in this case, in adding to complementary cultivation-independent efforts to explore the breadth of microbial diversity and ecology.
Other investigators have taken advantage of early access to the GEBA-I genomes and discovered prominent member species in their samples, for example, Treponema succinifaciens36 and Treponema brennaborense in the gut microbiomes of non-human primates and traditional hunter-gatherers37, Ktedonobacter racemifer in an enrichment to identify rare soil microbes38, Coraliomargarita akajimensis39 in an Amazon river plume40, Sphaerobacter thermophiles41 in thermophilic switchgrass-adapted compost42.
We also report genome features and a large set of CRISPR–Cas systems comprising more than 28,000 novel spacer sequences (Supplementary Table 5 and Supplementary Fig. 10). These CRISPR–Cas data enabled identification of novel associations between viruses and their hosts43.
Discussion
This Resource data set is the single largest effort (to our knowledge) to increase the phylogenetic coverage of cultivated bacterial and archaeal isolates. We observed that genomes with increased phylogenetic distance encoded the highest number of novel protein families, supporting the rationale for continued phylogeny-driven sequencing efforts aimed at expanding the representation of cultivated microbes.
Recent studies of uncultivated bacteria and archaea using metagenomics or single-cell genomics have revealed immense unexplored phylogenetic diversity and have provided insights into microbial ecology and evolution5,44,45,46,47,48. Those studies have also bolstered gene discovery efforts, particularly for biofuel and biotransformation applications and secondary metabolites49,50,51. New species, strains and clusters arising from the uncultivated majority are now complemented by our Resource of cultivated microbe genomes.
Genomes reconstructed from metagenomic data contain much valuable information. However, a widely perceived problem is that these genomes are characterized by relative low quality. Artifacts arising from highly fragmented, chimeric or contaminated sequences mean that assertions, comparisons and accurate estimations of diversity are difficult. Metagenomic data also contribute to 'homology creep', which results in speculative, sequence-based predictions, particularly for phylogenetically divergent organisms, and underscores the urgent need for biochemical validation52. One path forward, as previously proposed by the research community12, is the development of a saturated collection of isolate reference genomes, which, along with biochemical and genetic characterization, could serve as a solid foundation to support assembly, annotation and interpretation of the exponentially growing amounts of data from uncultivated microorganisms. While our GEBA-I selection of type strains exclusively targeted phylogenetic gaps in the isolate genome space (rather than genomes likely to be present in existing metagenomes), we did observe improvements in recruitment of metagenomic data. In addition, we uncovered potentially important members of microbial communities previously lacking taxonomic identity due to absence of reference genomes.
Unlike genome sequences reconstructed from metagenomes of (as-yet) uncultivated microbial species and strains, the GEBA-I species are all cultivable. We hope that GEBA-I will provide a foundation for an array of experiments, including the development of microbial model systems and analyses of biotechnologically relevant pathways, for years to come.
Methods
Organism selection.
Target organisms were selected based on a score that measures the relative contribution of each species to the total phylogenetic diversity (PD), as inferred from a phylogenetic tree with computed branch lengths6. The All-Species-Living-Tree-Project (LTP)53 phylogenetic tree (available as of 9/2010), comprising 8,029 leaves (species/subspecies) was used as the underlying tree. Species with ongoing or completed genome sequencing projects registered in the Genomes Online Database (GOLD) were excluded and the highest scoring (PD) species were screened for growth conditions that allow the production of sufficient cells for DNA extraction. Analysis was started as soon as a target 1,000 genomes were sequenced and annotated.
Organism growth and DNA isolation.
Most strains (870) from the GEBA-I list were provided by Leibniz Institute DSMZ while the remaining 133 strains were provided by ATCC (Supplementary Table 1). Strains were cultivated using standard protocols as described at the web sites of the centers. Each center generated the cell paste and isolate genomic DNA, which was sent to DOE JGI for sequencing.
Sequencing, assembly and annotation.
All GEBA-I strains were sequenced at the DOE Joint Genome Institute (JGI) using Illumina technology54. For all genomes, we constructed and sequenced an Illumina short-insert paired-end library with an average insert size of 270bp. Majority of the genomes were assembled using Velvet55 and ALLPATHS56 assembly methods. All general aspects of library construction and sequencing performed at the JGI can be found at the JGI website (http://jgi.doe.gov/). Genomes were annotated by the DOE–JGI genome annotation pipeline57,58. Briefly, protein-coding genes (CDSs) were identified using Prodigal59 followed by a round of automated and manual curation using the JGI GenePrimp pipeline60. Functional annotation and additional analyses were performed within the Integrated Microbial Genomes (IMG-ER) platform15. Genome completeness was estimated using the CheckM14 genome quality estimator and individual CheckM completeness scores reported in Supplementary Table 1.
Conserved single-copy gene phylogeny.
A set of 56 universally conserved single-copy proteins in bacteria and archaea61 was used for construction of phylogenetic tree. Marker genes were detected and aligned using hmmsearch and hmmalign included in HMMER3 (ref. 62) using HMM profiles obtained from Phylosift63. Alignments were concatenated and filtered. A phylogenetic tree was inferred using the maximum likelihood methods with RAxML (version 7.6.3). Tree topologies were tested for robustness using 100 bootstrap replicates and the standard LG model. Trees were visualized using FastTree followed by iTOL64. The number of new genomes was calculated based on publicly available genus names from genomes publicly available in IMG as of May 2014, when we began the analysis of the GEBA-I genomes.
Increase in 16S distance of all type strains.
GEBA-I and type strains were mapped to the species and subspecies contained in the last release (s123) from the Living Tree Project (LTP). The contribution of each type strain to the overall phylogenetic diversity was inferred from the LTP 16s rRNA gene tree as balanced Relative Phylogenetic Diversity (bRPD) as described earlier6.
Control set selection for comparative analysis.
As a control set, all non-GEBA high-quality genomes in IMG (14,625) as of May 2014 were used, when we began analysis of GEBA-I genomes. High-quality genomes excluded plasmids, genome fragments, uncultured single cells, genomes from metagenomes and genomes flagged as +low-quality” by the IMG quality control pipeline due to lack of phylum-level taxonomic assignment or if the coding density is less than 70% or greater than 100% or the number of genes per million base pair is less than 300 or greater than 1,200 (ref. 65).
Protein clusters.
26,873,871 non-redundant proteins from 1,003 GEBA-I genomes and 14,625 control genomes were clustered using the kClust algorithm66 using default parameters, which amounts to 20–30% maximum pairwise sequence identity over 80% alignment length with the longest sequence or seed of the cluster. kClust is a fast and sensitive clustering tool that relies on a modified incremental, greedy clustering strategy, where sequences are compared using an alignment-free pre-filter that computes matches between similar k-mers and uses those similarities to rank sequence pairs. A cluster is composed of two or more sequences, although the majority of clusters are much larger. A distribution of cluster sizes and lengths are given in Supplementary Table 2.
Prediction of biosynthetic clusters in GEBA-I.
Putative Biosynthetic clusters (BCs) were predicted and annotated using AntiSMASH version 3.0.4 (ref. 67) with the “inclusive” and the “borderpredict” options. All other options were left as default.
Recruitment of metagenome sequences.
3,402,887 CDS from 1,003 GEBA-I genomes were searched using LAST68 against 2,664,695,939 CDS from 4,948 assembled public metagenomes deposited in the IMG database. A protein from an isolate genome is deemed “recruited” if it has a LAST hit to a metagenome protein with a minimum identity of 30% over 50% alignment length of the longer protein. To establish “new” recruitment, metagenomes were also searched with 14,625 control genomes, and only metagenome CDS that did not previously recruit a protein from the control set (at >30% amino acid identity) were deemed as new recruiters. “Improved recruitment” on the other hand refers to a 20% improvement over a pre-existing hit (suggesting that our isolate reference may be a closer phylogenetic match). For “top recruiters,” only GEBA-I genomes that had over 200 CDS hits at >95% amino acid identity over 70% alignment length to an individual metagenome CDS were considered. The rationale for choosing this hit count was to ensure that the evidence included more than merely housekeeping genes, even though this cutoff of 200 hits could represent as low as 2% coverage of total CDS based on individual genome size. The maximum coverage obtained was 94% and the median coverage for 282 genomes was ∼27%. Where possible, relative abundance of a top recruiter was estimated based on average read depth of the scaffold, however, where read depth information was not available, “abundance” is conjectured based on average assembled length of the scaffolds that the gene resides on—the assumption being that only the most abundant organisms in a sample are likely to produce long scaffolds.
Phylogenetic analyses using Genome-Blast Distance Phylogeny.
Phylogenetic analyses of whole genome sequences were conducted using the high-throughput version69 of the Genome-Blast Distance Phylogeny approach (GBDP)70 in conjunction with BLAST+ (v2.2.30)71 in BLASTP mode with default parameters except an e-value filter of 10−8. GBDP was run with the greedy-with-trimming algorithm, formula d9 and 100 pseudo-bootstrap replicates. Phylogenetic trees were inferred from the intergenomic distance matrices using FastME72, and the tree from the original together with branch support from pseudo-bootstrapping visualized using the ITOL web service.
Data availability.
All available genomic data and annotations are available through the IMG portal (https://img.jgi.doe.gov/). The GEBA-I genomes are also available through The International Nucleotide Sequence Database Collaboration (INSDC). GenBank accession numbers corresponding to each GEBA-I genome are provided in Supplementary Table 1.
Additional information
Publisher's note: Springer Nature remains neutral with regard to jurisdictional claims in published maps and institutional affiliations.
Change history
28 February 2018
In the version of this article initially published, the wrong Creative Commons Attribution license (cc-by-nc rather than cc-by) was inserted. The error has been corrected in the HTML and PDF versions of the article.
References
- Mukherjee, S. et al. Genomes OnLine Database (GOLD) v.6: data updates and feature enhancements. Nucleic Acids Res. 45, D446–D456 (2017).
Article CAS Google Scholar - Kunin, V., Cases, I., Enright, A.J., de Lorenzo, V. & Ouzounis, C.A. Myriads of protein families, and still counting. Genome Biol. 4, 401 (2003).
Article Google Scholar - Wu, D. et al. A phylogeny-driven genomic encyclopaedia of Bacteria and Archaea. Nature 462, 1056–1060 (2009).
Article CAS Google Scholar - Kyrpides, N.C. Fifteen years of microbial genomics: meeting the challenges and fulfilling the dream. Nat. Biotechnol. 27, 627–632 (2009).
Article CAS Google Scholar - Rinke, C. et al. Insights into the phylogeny and coding potential of microbial dark matter. Nature 499, 431–437 (2013).
Article CAS Google Scholar - Göker, M. & Klenk, H.-P. Phylogeny-driven target selection for large-scale genome-sequencing (and other) projects. Stand. Genomic Sci. 8, 360–374 (2013).
Article Google Scholar - Varghese, N.J. et al. Microbial species delineation using whole genome sequences. Nucleic Acids Res. 43, 6761–6771 (2015).
Article CAS Google Scholar - Baltrus, D.A. Divorcing Strain Classification from Species Names. Trends Microbiol. 24, 431–439 (2016).
Article CAS Google Scholar - Klenk, H.-P. & Göker, M. En route to a genome-based classification of Archaea and Bacteria? Syst. Appl. Microbiol. 33, 175–182 (2010).
Article CAS Google Scholar - Parker, C.T., Tindall, B.J. & Garrity, G.M. International Code of Nomenclature of Prokaryotes. Int. J. Syst. Evol. Microbiol. http://dx.doi.org/10.1099/ijsem.0.000778 (2015).
- Garrity, G.M. A genomics driven taxonomy of Bacteria and Archaea: are we there, yet? J. Clin. Microbiol. 54, 1956–1963 (2016).
Article CAS Google Scholar - Kyrpides, N.C. et al. Genomic encyclopedia of bacteria and archaea: sequencing a myriad of type strains. PLoS Biol. 12, e1001920 (2014).
Article Google Scholar - Kyrpides, N.C. et al. Genomic Encyclopedia of Type Strains, Phase I: the one thousand microbial genomes (KMG-I) project. Stand. Genomic Sci. 9, 1278–1284 (2013).
Article Google Scholar - Parks, D.H., Imelfort, M., Skennerton, C.T., Hugenholtz, P. & Tyson, G.W. CheckM: assessing the quality of microbial genomes recovered from isolates, single cells, and metagenomes. Genome Res. 25, 1043–1055 (2015).
Article CAS Google Scholar - Chen, I.-M.A. et al. IMG/M: integrated genome and metagenome comparative data analysis system. Nucleic Acids Res. 45, D507–D516 (2017).
Article CAS Google Scholar - Chang, Y.-J. et al. Non-contiguous finished genome sequence and contextual data of the filamentous soil bacterium Ktedonobacter racemifer type strain (SOSP1-21). Stand. Genomic Sci. 5, 97–111 (2011).
Article CAS Google Scholar - Roth, A. et al. Novel diagnostic algorithm for identification of mycobacteria using genus-specific amplification of the 16S-23S rRNA gene spacer and restriction endonucleases. J. Clin. Microbiol. 38, 1094–1104 (2000).
CAS PubMed PubMed Central Google Scholar - Tortoli, E. Impact of genotypic studies on mycobacterial taxonomy: the new mycobacteria of the 1990s. Clin. Microbiol. Rev. 16, 319–354 (2003).
Article CAS Google Scholar - Taylor, B.L. & Zhulin, I.B. PAS domains: internal sensors of oxygen, redox potential, and light. Microbiol. Mol. Biol. Rev. 63, 479–506 (1999).
CAS PubMed PubMed Central Google Scholar - Abt, B. et al. Complete genome sequence of the termite hindgut bacterium Spirochaeta coccoides type strain (SPN1(T)), reclassification in the genus Sphaerochaeta as Sphaerochaeta coccoides comb. nov. and emendations of the family Spirochaetaceae and the genus Sphaerochaeta. Stand. Genomic Sci. 6, 194–209 (2012).
Article CAS Google Scholar - Cipollone, R., Ascenzi, P. & Visca, P. Common themes and variations in the rhodanese superfamily. IUBMB Life 59, 51–59 (2007).
Article CAS Google Scholar - Galtier, N. & Daubin, V. Dealing with incongruence in phylogenomic analyses. Phil. Trans. R. Soc. Lond. B 363, 4023–4029 (2008).
Article Google Scholar - Hadjithomas, M. et al. IMG-ABC: a knowledge base to fuel discovery of biosynthetic gene clusters and novel secondary metabolites. MBio 6, e00932 (2015).
Article CAS Google Scholar - van Wezel, G.P. & McDowall, K.J. The regulation of the secondary metabolism of Streptomyces: new links and experimental advances. Nat. Prod. Rep. 28, 1311–1333 (2011).
Article CAS Google Scholar - Cimermancic, P. et al. Insights into secondary metabolism from a global analysis of prokaryotic biosynthetic gene clusters. Cell 158, 412–421 (2014).
Article CAS Google Scholar - Bérdy, J. Bioactive microbial metabolites. J. Antibiot. (Tokyo) 58, 1–26 (2005).
Article Google Scholar - Giddens, S.R., Feng, Y. & Mahanty, H.K. Characterization of a novel phenazine antibiotic gene cluster in Erwinia herbicola Eh1087. Mol. Microbiol. 45, 769–783 (2002).
Article CAS Google Scholar - Imamura, N. et al. New anticancer antibiotics pelagiomicins, produced by a new marine bacterium Pelagiobacter variabilis. J. Antibiot. (Tokyo) 50, 8–12 (1997).
Article CAS Google Scholar - Kim, M.K. et al. Solirubrobacter soli sp. nov., isolated from soil of a ginseng field. Int. J. Syst. Evol. Microbiol. 57, 1453–1455 (2007).
Article Google Scholar - Weon, H.-Y. et al. Rudaea cellulosilytica gen. nov., sp. nov., isolated from soil. Int. J. Syst. Evol. Microbiol. 59, 2308–2312 (2009).
Article CAS Google Scholar - An, D. et al. Metagenomic analysis indicates epsilonproteobacteria as a potential cause of microbial corrosion in pipelines injected with bisulfite. Front. Microbiol. 7, 28 (2016).
Article Google Scholar - Deng, Z.S. et al. Diversity of endophytic bacteria within nodules of the Sphaerophysa salsula in different regions of Loess Plateau in China. FEMS Microbiol. Ecol. 76, 463–475 (2011).
Article CAS Google Scholar - Zakhia, F. et al. Diverse bacteria associated with root nodules of spontaneous legumes in Tunisia and first report for nifH-like gene within the genera Microbacterium and Starkeya. Microb. Ecol. 51, 375–393 (2006).
Article Google Scholar - Dong, Y., Iniguez, A.L., Ahmer, B.M.M. & Triplett, E.W. Kinetics and strain specificity of rhizosphere and endophytic colonization by enteric bacteria on seedlings of Medicago sativa and Medicago truncatula. Appl. Environ. Microbiol. 69, 1783–1790 (2003).
Article CAS Google Scholar - Schikora, A. et al. Conservation of Salmonella infection mechanisms in plants and animals. PLoS One 6, e24112 (2011).
Article CAS Google Scholar - Han, C. et al. Complete genome sequence of Treponema succinifaciens type strain (6091). Stand. Genomic Sci. 4, 361–370 (2011).
Article CAS Google Scholar - Obregon-Tito, A.J. et al. Subsistence strategies in traditional societies distinguish gut microbiomes. Nat. Commun. 6, 6505 (2015).
Article CAS Google Scholar - Delmont, T.O. et al. Reconstructing rare soil microbial genomes using in situ enrichments and metagenomics. Front. Microbiol. 6, 358 (2015).
PubMed PubMed Central Google Scholar - Mavromatis, K. et al. Complete genome sequence of Coraliomargarita akajimensis type strain (04OKA010-24). Stand. Genomic Sci. 2, 290–299 (2010).
Article Google Scholar - Satinsky, B.M. et al. The Amazon continuum dataset: quantitative metagenomic and metatranscriptomic inventories of the Amazon River plume, June 2010. Microbiome 2, 17 (2014).
Article Google Scholar - Pati, A. et al. Complete genome sequence of Sphaerobacter thermophilus type strain (S 6022). Stand. Genomic Sci. 2, 49–56 (2010).
Article Google Scholar - D'haeseleer, P. et al. Proteogenomic analysis of a thermophilic bacterial consortium adapted to deconstruct switchgrass. PLoS One 8, e68465 (2013).
Article CAS Google Scholar - Paez-Espino, D. et al. Uncovering Earth's virome. Nature 536, 425–430 (2016).
Article CAS Google Scholar - Yooseph, S. et al. The Sorcerer II Global Ocean Sampling expedition: expanding the universe of protein families. PLoS Biol. 5, e16 (2007).
Article Google Scholar - Rusch, D.B. et al. The Sorcerer II Global Ocean Sampling expedition: northwest Atlantic through eastern tropical Pacific. PLoS Biol. 5, e77 (2007).
Article Google Scholar - Sunagawa, S. et al. Ocean plankton. Structure and function of the global ocean microbiome. Science 348, 1261359 (2015).
Article Google Scholar - Hug, L.A. et al. A new view of the tree of life. Nat. Microbiol. 1, 16048 (2016).
Article CAS Google Scholar - Anantharaman, K. et al. Thousands of microbial genomes shed light on interconnected biogeochemical processes in an aquifer system. Nat. Commun. 7, 13219 (2016).
Article CAS Google Scholar - Guo, C.-J. et al. Discovery of reactive microbiota-derived metabolites that inhibit host proteases. Cell 168, 517–526.e18 (2017).
Article CAS Google Scholar - Li, L.-L., McCorkle, S.R., Monchy, S., Taghavi, S. & van der Lelie, D. Bioprospecting metagenomes: glycosyl hydrolases for converting biomass. Biotechnol. Biofuels 2, 10 (2009).
Article Google Scholar - Voget, S., Steele, H.L. & Streit, W.R. Characterization of a metagenome-derived halotolerant cellulase. J. Biotechnol. 126, 26–36 (2006).
Article CAS Google Scholar - Anton, B.P., Kasif, S., Roberts, R.J. & Steffen, M. Objective: biochemical function. Front. Genet. 5, 210 (2014).
Article Google Scholar - Yarza, P. et al. The All-Species Living Tree project: a 16S rRNA-based phylogenetic tree of all sequenced type strains. Syst. Appl. Microbiol. 31, 241–250 (2008).
Article CAS Google Scholar - Mavromatis, K. et al. The fast changing landscape of sequencing technologies and their impact on microbial genome assemblies and annotation. PLoS One 7, e48837 (2012).
Article CAS Google Scholar - Zerbino, D.R. & Birney, E. Velvet: algorithms for de novo short read assembly using de Bruijn graphs. Genome Res. 18, 821–829 (2008).
Article CAS Google Scholar - Butler, J. et al. ALLPATHS: de novo assembly of whole-genome shotgun microreads. Genome Res. 18, 810–820 (2008).
Article CAS Google Scholar - Huntemann, M. et al. The standard operating procedure of the DOE-JGI Metagenome Annotation Pipeline (MAP v.4). Stand. Genomic Sci. 11, 17 (2016).
Article Google Scholar - Tripp, H.J. et al. Toward a standard in structural genome annotation for prokaryotes. Stand. Genomic Sci. 10, 45 (2015).
Article Google Scholar - Hyatt, D. et al. Prodigal: prokaryotic gene recognition and translation initiation site identification. BMC Bioinformatics 11, 119 (2010).
Article Google Scholar - Pati, A. et al. GenePRIMP: a gene prediction improvement pipeline for prokaryotic genomes. Nat. Methods 7, 455–457 (2010).
Article CAS Google Scholar - Eloe-Fadrosh, E.A. et al. Global metagenomic survey reveals a new bacterial candidate phylum in geothermal springs. Nat. Commun. 7, 10476 (2016).
Article CAS Google Scholar - Mistry, J., Finn, R.D., Eddy, S.R., Bateman, A. & Punta, M. Challenges in homology search: HMMER3 and convergent evolution of coiled-coil regions. Nucleic Acids Res. 41, e121 (2013).
Article CAS Google Scholar - Darling, A.E. et al. PhyloSift: phylogenetic analysis of genomes and metagenomes. PeerJ 2, e243 (2014).
Article Google Scholar - Letunic, I. & Bork, P. Interactive Tree Of Life v2: online annotation and display of phylogenetic trees made easy. Nucleic Acids Res. 39, W475 (2011).
Article CAS Google Scholar - Huntemann, M. et al. The standard operating procedure of the DOE-JGI Microbial Genome Annotation Pipeline (MGAP v.4). Stand. Genomic Sci. 10, 86 (2015).
Article Google Scholar - Hauser, M., Mayer, C.E. & Söding, J. kClust: fast and sensitive clustering of large protein sequence databases. BMC Bioinformatics 14, 248 (2013).
Article Google Scholar - Weber, T. et al. antiSMASH 3.0-a comprehensive resource for the genome mining of biosynthetic gene clusters. Nucleic Acids Res. 43, W237 (2015).
Article CAS Google Scholar - Kiełbasa, S.M., Wan, R., Sato, K., Horton, P. & Frith, M.C. Adaptive seeds tame genomic sequence comparison. Genome Res. 21, 487–493 (2011).
Article Google Scholar - Meier-Kolthoff, J.P., Auch, A.F., Klenk, H.-P. & Göker, M. Highly parallelized inference of large genome-based phylogenies. Concurr. Comput. Pract. Exp. 26, 1715–1729 (2014).
Article Google Scholar - Auch, A.F., Henz, S.R., Holland, B.R. & Göker, M. Genome BLAST distance phylogenies inferred from whole plastid and whole mitochondrion genome sequences. BMC Bioinformatics 7, 350 (2006).
Article Google Scholar - Camacho, C. et al. BLAST+: architecture and applications. BMC Bioinformatics 10, 421 (2009).
Article Google Scholar - Lefort, V., Desper, R. & Gascuel, O. FastME 2.0: a comprehensive, accurate, and fast distance-based phylogeny inference program. Mol. Biol. Evol. 32, 2798–2800 (2015).
Article CAS Google Scholar
Acknowledgements
We thank H. Maughan for critical reading and feedback on the paper. We would also like to thank B.J. Tindall, S. Spring, R. Pukall, E. Lang, S. Gronow and S. Verbarg from Leibniz Institute DSMZ for contributing the cell pastes for the GEBA-I strains, E. Brambilla and B. Trümper, DSMZ, for preparing genomic DNA, B. Beck and T. Lilburn from ATCC, as well as all the JGI staff that contributed to this project including T.B.K. Reddy, I. Pagani, E. Lobos, J. Mallajosyula, M. Isbandi, A. Thomas, D. Stamatis and J. Bertsch for metadata curation, C.-L. Wei for sequencing, J. Han, A. Clum, B. Bushnell and A. Copeland for assembly, K. Mavromatis, M. Huntemann, G. Ovchinnikova and N. Mikhailova for annotation and submission to IMG, A. Chen, K. Chu, K. Palaniappan, M. Pillay, J. Huang, E. Szeto and V. Markowitz for additional annotation and integration into IMG, A. Schaumberg, E. Andersen, S. Hua, H. Nordberg, I. Dubchak, S. Wilson, A. Shahab for NCBI registrations and submission to INSDC, L. Goodwin, N. Shapiro and T. Tatum for project management and J. Bristow and E. Rubin for supporting the project. The use of the bwGRiD cluster for the GBDP analysis is gratefully acknowledged. We also thank J.M. Tiedje at Michigan State University for generously providing metadata specifics for his metagenomic samples. This work was conducted by the US Department of Energy Joint Genome Institute, a DOE Office of Science User Facility, under Contract No. DE-AC02-05CH11231 and used resources of the National Energy Research Scientific Computing Center, which is supported by the Office of Science of the US Department of Energy.
Author information
Author notes
- R Cameron Coates & Amrita Pati
Present address: Present addresses: Zymergen Inc., Emeryville, California, USA (R.C.C.) and Roche Molecular Systems Inc., Pleasanton, California, USA (A.P.)., - Supratim Mukherjee and Rekha Seshadri: These authors contributed equally to this work.
Authors and Affiliations
- Department of Energy, Joint Genome Institute, Walnut Creek, California, USA
Supratim Mukherjee, Rekha Seshadri, Neha J Varghese, Emiley A Eloe-Fadrosh, R Cameron Coates, Michalis Hadjithomas, Georgios A Pavlopoulos, David Paez-Espino, Yasuo Yoshikuni, Axel Visel, Amrita Pati, Natalia N Ivanova, Tanja Woyke & Nikos C Kyrpides - Leibniz Institute DSMZ - German Collection of Microorganisms and Cell Cultures, Braunschweig, Germany
Jan P Meier-Kolthoff & Markus Göker - Department of Microbiology, University of Georgia, Athens, Georgia, USA
William B Whitman - Department of Microbiology and Molecular Genetics, Michigan State University, East Lansing, Michigan, USA
George M Garrity - NamesforLife, LLC, East Lansing, Michigan, USA
George M Garrity - University of California Davis Genome Center, Davis, California, USA
Jonathan A Eisen - Australian Centre for Ecogenomics, The University of Queensland, Brisbane, Queensland, Australia
Philip Hugenholtz - School of Biology, Newcastle University, Newcastle upon, Tyne, UK
Hans-Peter Klenk
Authors
- Supratim Mukherjee
You can also search for this author inPubMed Google Scholar - Rekha Seshadri
You can also search for this author inPubMed Google Scholar - Neha J Varghese
You can also search for this author inPubMed Google Scholar - Emiley A Eloe-Fadrosh
You can also search for this author inPubMed Google Scholar - Jan P Meier-Kolthoff
You can also search for this author inPubMed Google Scholar - Markus Göker
You can also search for this author inPubMed Google Scholar - R Cameron Coates
You can also search for this author inPubMed Google Scholar - Michalis Hadjithomas
You can also search for this author inPubMed Google Scholar - Georgios A Pavlopoulos
You can also search for this author inPubMed Google Scholar - David Paez-Espino
You can also search for this author inPubMed Google Scholar - Yasuo Yoshikuni
You can also search for this author inPubMed Google Scholar - Axel Visel
You can also search for this author inPubMed Google Scholar - William B Whitman
You can also search for this author inPubMed Google Scholar - George M Garrity
You can also search for this author inPubMed Google Scholar - Jonathan A Eisen
You can also search for this author inPubMed Google Scholar - Philip Hugenholtz
You can also search for this author inPubMed Google Scholar - Amrita Pati
You can also search for this author inPubMed Google Scholar - Natalia N Ivanova
You can also search for this author inPubMed Google Scholar - Tanja Woyke
You can also search for this author inPubMed Google Scholar - Hans-Peter Klenk
You can also search for this author inPubMed Google Scholar - Nikos C Kyrpides
You can also search for this author inPubMed Google Scholar
Contributions
N.C.K., J.A.E., P.H., H.-P.K., G.M.G., W.B.W. and T.W. conceived the project. S.M., R.S., N.J.V., E.A.E.-F., J.P.M.-K., M.G., M.H., G.A.P., D.P.-E. and A.P. performed analysis tasks. R.C.C. and Y.Y. performed phenazine biosynthetic cluster experiments. N.N.I., T.W. and N.C.K. validated analysis tasks. A.V. gave project direction and important feedback on the paper. S.M., R.S., E.A.E.-F. and N.C.K. wrote the paper. All authors edited and approved the manuscript.
Corresponding author
Correspondence toNikos C Kyrpides.
Ethics declarations
Competing interests
The authors declare no competing financial interests.
Integrated supplementary information
Supplementary Figure 1 Habitat distribution of GEBA-I genomes.
Phyla comprising GEBA-I genomes are depicted clockwise starting at 12 o’ clock. Habitat isolation source is depicted from 6 o’ clock. Ribbons are colored based on phylum and width of the ribbon is scaled to the number of genomes corresponding to a phylum.
Supplementary Figure 2 Genome size (a) and GC content (b) distribution of GEBA-I genomes per phylum.
Supplementary Figure 3 Distribution of number of scaffolds per phylum within GEBA-I genomes.
Violin plot indicating the number of total assembled scaffolds (y-axis) per phylum within GEBA-I genomes (x-axis). White dots represent median counts.
Supplementary Figure 5 Gene duplication in Sphaerochaeta coccoides as evidenced by presence of tandem repeats of genes (shown in red) coding for alpha-tubulin suppressor.
Genes from four distinct regions in the genome are depicted. IMG gene IDs for alpha-tubulin suppressor (A) 2503956325, 2503956324, 2503956318, 2503956316, 2503956315; (B) 2503957837, 2503957838, 2503957839 (C) 2503956606, 2503956605 and (D) 2503957700, 2503957701, 2503957709, 2503957717.
Supplementary Figure 6 Multiple sequence alignment of Endozoicomonas elysicola pepsin A with the eukaryotic pepsins and the recently characterized pepsin homolog from Shewanella denitrificans.
The conserved active residues are marked with asterisk, hydrophobic-hydrophobic-Gly motif is marked by black arrows and the predicted E. elysicola specific signal peptide cleavage site is indicated by the blue arrow
Supplementary Figure 7 Number of Biosynthetic Clusters (y-axis) in each GEBA-I genome with respect to its genome size (x-axis) in Mbp. Individual genomes are colored by phylum.
Supplementary Figure 8 Biosynthetic genes potentially responsible for the production of pelagiomicin phenazine antibiotic by M. variabilis ATCC 700307
Supplementary Figure 9 Distribution of the percentage of metagenome hits per GEBA-I genome by phylum.
Solirubrobacter soli, Ktedonobacter racemifer and Niastella koreensis represents the top three GEBA-I genomes, which recruited the highest percentage of metagenome proteins. Inset: Habitat of metagenome proteins recruited by GEBA-I genomes.
Supplementary Figure 10 Distribution of various classes of CRISPR-Cas systems and CRISPR spacers across phyla.
The y-axis on the left shows the proportion of a particular class of CRIPR-Cas system within members of a phylum. Number of spacers (green line) is represented on the y-axis on the right.
Supplementary information
Rights and permissions
This article is licensed under a Creative Commons Attribution 4.0 International License, which permits use, sharing, adaptation, distribution and reproduction in any medium or format, as long as you give appropriate credit to the original author(s) and the source, provide a link to the Creative Commons license, and indicate if changes were made. The images or other third party material in this article are included in the article's Creative Commons license, unless indicated otherwise in a credit line to the material. If material is not included in the article's Creative Commons license and your intended use is not permitted by statutory regulation or exceeds the permitted use, you will need to obtain permission directly from the copyright holder. To view a copy of this license, visit http://creativecommons.org/licenses/by/4.0/.
About this article
Cite this article
Mukherjee, S., Seshadri, R., Varghese, N. et al. 1,003 reference genomes of bacterial and archaeal isolates expand coverage of the tree of life.Nat Biotechnol 35, 676–683 (2017). https://doi.org/10.1038/nbt.3886
- Received: 08 November 2016
- Accepted: 21 April 2017
- Published: 12 June 2017
- Issue Date: July 2017
- DOI: https://doi.org/10.1038/nbt.3886