Genome-wide functional screening of miR-23b as a pleiotropic modulator suppressing cancer metastasis (original) (raw)
Introduction
Metastasis is the overwhelming cause of mortality in patients with solid tumours. It is a complex and dynamic process, starting with local invasion, followed by intravasation into the systemic circulation, survival in the circulation, extravasation and establishment at distant tissues, and ultimately vascularization of the resulting tumours. Therefore, a more complete understanding of the molecular mechanism that regulates this process requires a detailed characterization of cell motility, invasion, growth and even angiogenesis. As a new class of signalling modulators, miRNAs have attracted great attention for certain unique features, including multi-target regulation, tissue specificity and evolutionary conservation1,2,3. These small endogenous RNAs are able to interact with many physiologically essential genes, such as c-Myc, TP53 and Ras, and have critical roles in a wide range of biological processes, including cell development, cell proliferation and differentiation, as well as cell migration and cancer metastasis4,5,6,7.
Strikingly, these important modulators are globally dysregulated in human cancer samples8. A small number of miRNAs have been demonstrated to actively participate in the regulation of tumour development9,10,11,12,13. However, an outstanding central question is how many miRNAs functionally participate in cancerogenesis, particularly in cancer metastasis. To address this question, we decided to quantitatively and systematically characterize the capacity of individual miRNAs to regulate cell migration, invasion, and apoptosis. We believe that such a 'function' signature provides an overview of miRNAs regulating the metastasis-related features in cancer, and thus will help in the identification of physiologically important and/or therapeutically promising miRNAs.
However, even though high-throughput cell-based RNA interference (RNAi) screens can be routinely accomplished in a 96- or 384-well plate format, they are not suitable for the analysis of cell migration, because the study of cell motility in parallel is a formidably challenging task. Recently, several groups have focused on developing a new approach14,15. For example, Simpson et al.14 created a robotic-driven pin to deliver a precise scratch in confluent cell monolayers. Although these methods have improved experimental throughput to a certain degree, they are still either technically demanding or only applicable to specific cell lines, thus hampering their application to large-scale screening.
Here, we report the development of a novel self-assembled cell microarray (SAMcell), which is suitable for the high-throughput screening of the genes functionally regulating cell migration. Through the screening of migration regulatory miRNAs, followed by the implementation of invasion or apoptosis assay, an anti-metastatic human miRNA, miR-23b was identified. MiR-23b mediates the various steps in the metastatic process, including tumour growth, invasion and even angiogenesis by repressing a cohort of prometastatic targets.
Results
SAMcell studying cell migration
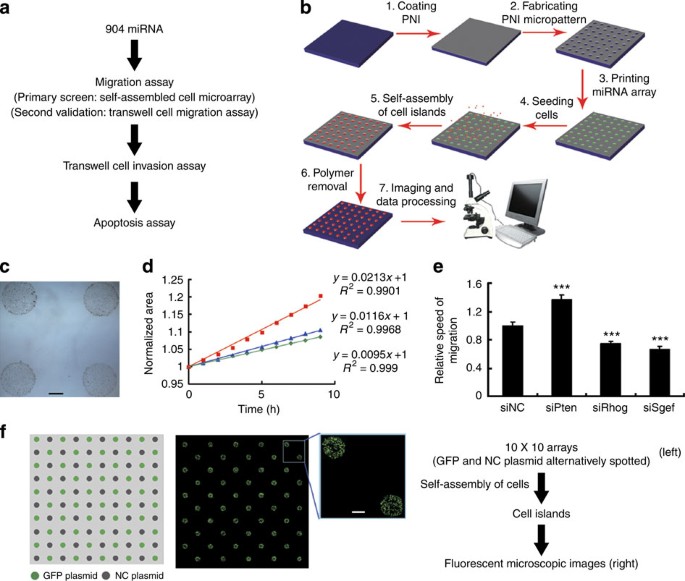
We developed a SAMcell to examine the capacity of miRNA to mediate cell migration (Fig.1a; Supplementary Table S1). The fabrication of a SAMcell is schematically shown in Figure 1b. In brief, a layer of poly-_N_-isopropylacrylamide (PNI), a thermally responsive polymer, is coated on a glass slide. After drying, the polymer is microfabricated via a shadow mask through oxygen plasma etching. Then, each type of miRNA or small-interfering RNA (siRNA) solution is printed on the slide according to the polymer pattern, such as an array of circles. Following a conventional cell culture protocol, we next added culture media mixed with cells on a petri dish containing an siRNA-printed slide, and then incubated the dish at 37 °C for 1–2 days. Cells self-assembled within each circle, as they grew very well on the glass slide, but rather poorly on PNI. PNI has been previously demonstrated to have a sharply lower critical solution temperature, ∼32 °C16. That is, PNI undergoes a solid–liquid phase transition as it is cooled below 32 °C, and dissolves in the surrounding aqueous medium. Therefore, the subsequent removal of the dissolved polymer results in the formation of individual cell islands, enabling them to acquire the freedom to move (Fig. 1c).
Figure 1: SAMcell.
(a) Screening strategy used to perform the functional screen. (b) Fabrication of the (c) Microscopic images of four cell islands upon the removal of PNI. Scale bar, 500 μm. (d) The SAMcell was applied to study the migration of three types of cells, Hela (green), HepG2 (blue) and U2OS (red). (e) Rates of cell migration were changed when various genes were silenced in a Hela cell line. Each experiment was repeated five times. ***P<0.001 (_t_-test). Error bars represented s.d.'s of five independent experiments. (f) No detectable cross-contamination in neighbouring diagonal positions. A green fluorescent protein-expressing plasmid is alternatively spotted on 10×10 arrays in the microarray. Schematic diagram and fluorescent microscopic images are shown in the left and right panels, respectively. Scale bar, 500 μm.
We first investigated the capacity of this microarray to effectively detect cell migration. To minimize the effect of cell proliferation on migration, we did not remove PNI until the cells within a given island had become confluent. The data showed that within a certain period, such as 9 h, the island area increased as a function of time, at least for the five cell lines Hela, HepG2, U2OS, MCF-7 and Panc-1 (Fig. 1d; Supplementary Fig. S1a). Given the facts that PNI patterns were microfabricated on the basis of semiconductor technology, and that the self-assembled cell islands were incubated under the same culture conditions, this assay demonstrates clear advantages in reliability and accuracy over the traditional scratch wound healing assays. Five parallel experiments resulted in no more than a 5% s.d. for each cell line (Supplementary Fig. S1b).
Next, we synthesized a number of siRNAs, each targeting Pten, Rhog or Sgef, as well as a scrambled siRNA, and then printed them on a glass slide. The quantitative real-time RT–PCR results validated the silencing efficiency of these siRNAs (Supplementary Fig. S1c). As expected, the assay showed that both Hela and U2OS cells moved faster when Pten was silenced, whereas both cell types migrated more slowly when either Rhog or Sgef was inhibited (Fig.1e; Supplementary Fig. S1d)17,18. A high-density pattern of siRNA spots, such as 5,000 spots per chip, has been previously demonstrated without any obvious cross-contamination19. We addressed the issue of cross-contamination by adjusting the size and number of siRNA spots before large-scale screening. When a circle had a diameter of ∼800 μm and its centre–centre distance was no less than 2.25 mm, equivalent to 2,000 spots per plate, no detectable cross-contamination was observed (Fig. 1f). Therefore, through the incorporation of RNAi technology, this microarrary is applicable to large-scale screening of the functional genes regulating cell migration.
Screening miRNAs regulating cell invasion and apoptosis
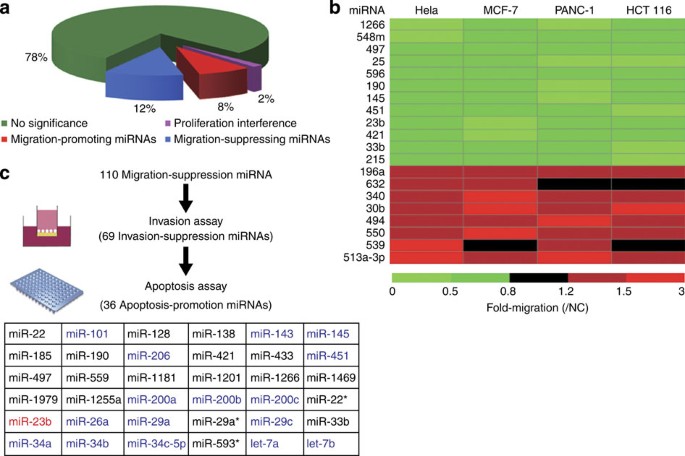
As shown in Figure 1a, the screen started with migration assays including SAMcell for primary screen and transwell migration assay for validation, followed by invasion assay and apoptosis assay. In total, over 900 miRNAs were investigated. The primary screen indicated that 201 miRNA genes are able to regulate cell migration. To assess the quality of our screening method, we validated the false positives through conventional transwell cell migration assay. In total, 182 miRNA genes demonstrated consistent behaviour in both assays (Fig.2a; Supplementary Table S2). Analysis of the 19 miRNAs exhibiting non-concordant behaviour found that 18 of them exerted a potent effect on cell proliferation, that is, less than 2% of the false positive results being due to the influence of proliferation in this assay (Supplementary Table S3). To estimate the false negative rate in our assay, we randomly selected 10 miRNAs incapable of regulating cells migration (negative-representative miRNAs) and individually examined the migratory regulation capability of each miRNA by means of the transwell assay. Unsurprisingly, none of them exhibited any significant change in cell mobility, thus indicating that this assay has a low or possibly even zero false negative rate (Supplementary Fig. S2).
Figure 2: Indentifying miRNAs regulating cancer cell migration and invasion.
(a) Pie diagram showing the distribution of the migratory miRNAs. The 2% false positives are mainly due to proliferation. (b) General regulation of miRNA on the migratory behaviours. Noticeably, no miRNAs exhibited a contrasting migratory regulation capacity. Transwell cell migration assay is used here. (c) Summary of the miRNA functional screen. MiRNAs previously reported to regulate cell migration, invasion or apoptosis are highlighted in blue.
To investigate whether the screening results, including both the negative and positive ones, are applicable to other cells in addition to Hela cells, we first delivered the above-mentioned negative-representative miRNAs into MCF-7 cells. Unsurprisingly, these miRNAs consistently demonstrated an inability to regulate the mobility of MCF-7 (Supplementary Fig. S2). We then randomly selected 20 miRNAs from the screening list as positive-representative miRNAs, and examined their migratory regulation capacity in three other epithelial cancer cell lines, MCF-7, Panc-1 and HCT 116. It was observed that almost all of them exhibited the same regulatory capacity in these three cell lines as in Hela cell line, with the exception of a few miRNAs, which did not have any evident impact (Fig. 2b). Taken together, these results imply that the screening results based on Hela cells may be applicable to other epithelial cancer cell lines, and thus are of potentially general use.
We next concentrated on the migration-suppressing miRNAs and investigated their capacity to regulate cell invasion or apoptosis, as most miRNAs are pathologically downexpressed in cancer samples. The results showed that 69 of these miRNAs significantly suppressed invasion in vitro, among which 36 miRNAs were demonstrated to be capable of inducing apoptosis (Fig. 2c; Supplementary Table S4; Table 1). Importantly, dozens of well-characterized miRNAs, including miR-101, the miR-200 family and Let-7a/b are included in our screening results. Each of the miRNAs was ranked by the capacity to regulate migration, invasion and apoptosis activity. Our data show that miR-23b is capable of not only inhibiting both migration and invasion, but also inducing apoptosis effectively. According to the formula defined in Table 1, miR-23b presents the highest score among all the miRNAs identified.
Table 1 miRNAs capable of downregulating cell migration, invasion and inducing apoptosis.
MiR-23b suppresses metastasis-relevant traits in vitro
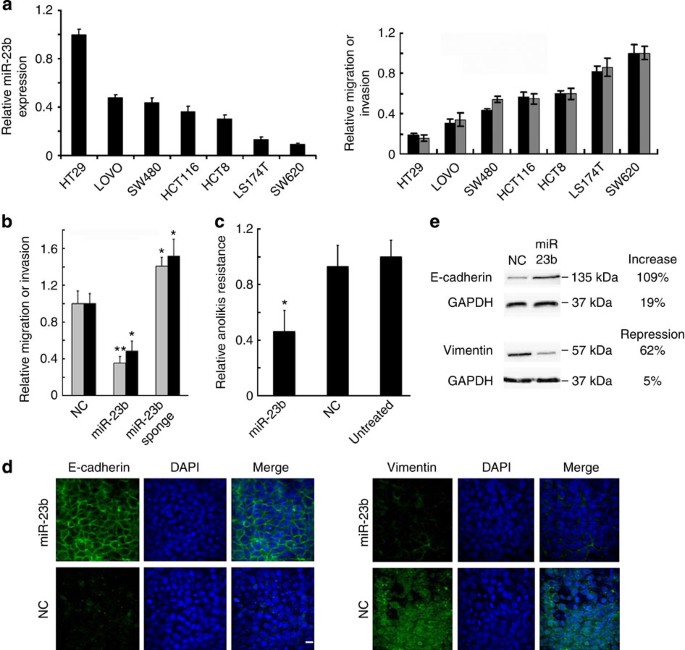
MiR-23b is expressed in diverse colon cell lines. To determine whether the expression levels of miR-23b affect metastasis-relevant activities in human colon cancer, we selected seven human colon cancer cell lines, including HT29, LOVO, SW480, HCT116, HCT8, LS174T and SW620. First, HCT 116 has a lower expression level of miR-23b than HT29, LOVO or SW480, but a higher expression level than HCT29, LS174T or SW620 (Fig. 3a). These cells demonstrated the reverse capability of migration and invasion. We then determined whether miR-23b or its inhibitor could regulate the basal levels of cell invasion. We delivered a lentiviral construct into HCT 116 cells to generate a stable cell line stably expressing miR-23b or its sponge, as well as green fluorescent protein. Ectopic expression of miR-23b produced a potent inhibition of the cell migration and invasion, but its inhibitor increased the migratory and invasive activities by more than 40% (Fig. 3b).
Figure 3: MiR-23b suppresses metastasis-relevant traits in vitro.
(a) MiR-23b levels correlate inversely with mobility ability in human colon cancer cell lines, _n_=3. The migration (black bar) or invasion (grey bar) speed of SW620 was normalized to 1. (b) Migration (black bar) or invasion (grey bar) assays after transfection of HCT 116 cells with the indicated constructs, _n_=3. NC (scramble siRNA). (c) Anoikis assays with HCT 116 cells infected as indicated, _n_=3. NC (scramble siRNA). (d) Manipulation of the miR-23b levels can induce epithelial to mesenchymal transition. E-cadherin and vimentin are used as epithelial to mesenchymal transition markers. DAPI staining was used to detect nuclei. NC (scramble siRNA). Scale bar, 50 μm. (e) Western blot assays showing the expression levels of E-cadherin and vimentin in response to miR-23b. GAPDH is used as loading control. *P<0.05; **P<0.01 (_t_-test). Error bars represented s.d.'s of at least three independent experiments.
Anoikis is a form of programmed cell death, which is induced by anchorage-dependent cells detaching from the surrounding extracellular matrix. Our results showed that miR-23b-expressing cells exhibited 50% diminished resistance to anoikis-mediated cell death (Fig. 3c). Furthermore, we investigated whether miR-23b might regulate epithelial to mesenchymal transition, an event, which is viewed as an essential early step in tumour metastasis. Immunofluorescene visualization suggested that miR-23b expression upregulated E-cadherin and decreased vimentin, suggesting that the miR-23b might promote mesenchymal to epithelial transition in these cells (Fig. 3d,e). These observations reveal that in vitro, the overexpression of miR-23b is sufficient to suppress migration, invasion and anoikis resistance, and may promote mesenchymal to epithelial transition.
MiR-23b expression suppresses metastasis in vivo
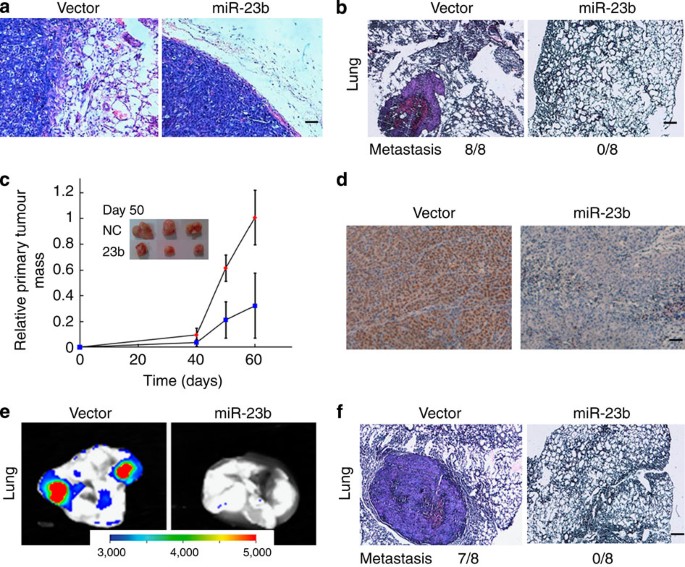
A key question was whether miR-23b would suppress metastatic behaviours in vivo. First, we exploited the capacity of miR-23b to prevent local invasion in vivo. HCT 116 cells stably expressing miR-23b were subcutaneously injected in mice. We found that miR-23b-expressing tumours were well encapsulated and non-invasive (Fig. 4a). Furthermore, examination of the lungs revealed metastatic nodules had developed in the control mice, but not in the mice implanted with miR-23b-expressing cells (Fig. 4b).
Figure 4: MiR-23b expression inhibits metastasis in vivo.
(a) Haematoxylin and eosin (H&E) stain of HCT 116 primary tumours 60 days after subcutaneous injection. Mice were implanted NC or miR-23b stable expressing HCT116 cells subcutaneously for each group, _n_=3. Scale bar, 50 μm. (b) H&E stain of lungs isolated from mice that received subcutaneous injection of miR-23b-transduced or mock-infected HCT 116 cells at 60 days after transplantation. Eight mice were implanted NC or miR-23b stable expressing HCT 116 cells subcutaneously for each group. H&E staining of lungs indicated tumours could be found in all the eight mice implanted NC expressing HCT 116 cells, but not in which implanted miR-23b-expressing HCT116 cells. Scale bar, 50 μm. (c) Primary tumour growth upon subcutaneous implantation of 5.0×10⁵ green fluorescent protein-labelled HCT 116 cells infected with NC (red diamond) or miR-23b plasmid (blue square). The experiment was terminated after 60 days, _n_=3 per group per time point. Error bars represented s.d.'s of three independent experiments. (d) Ki-67-stained sections of primary tumours formed by HCT 116 cells infected as indicated, _n_=3. Scale bar, 50 μm. (e) Images of lungs isolated from mice that received a tail vein injection of miR-23b-transduced or mock-infected green fluorescent protein-labelled HCT 116 cells. Metastatic nodules were measured within a period of 5 weeks after injection, _n_=3. (f) H&E stain of lungs isolated from mice that received a tail vein injection of miR-23b-transduced or mock-infected HCT 116 cells. Eight mice were injected NC or miR-23b stable expressing HCT116 cells from the tail vein for each group. H&E staining of lungs indicated tumours could be found in the seven mice implanted NC HCT116 cells, but not in which implanted miR-23b expressing HCT116 cells. Scale bar, 50 μm.
Noticeably, the tumour weights, which were obtained on days 40, 50 and 60, indicated that miR-23b suppressed primary tumour growth by 70% (Fig. 4c). We performed immunohistochemical analysis with the Ki-67 proliferation marker, and found that the distribution pattern of Ki-67 cells in the miR-23b-overexpressing HCT 116 tumours was distinct from that seen in the control tumours; in the miR-23b-expressing tumours, an even distribution of Ki-67 cells was observed with a lower density, whereas in the control tumours, enriched Ki-67 cells were observed (Fig. 4d). These results are consistent with those in the in vitro cell proliferation assay and apoptosis assay. Mir-23b significantly decreased the cell proliferation rate, whereas the application of an miR-23b inhibitor resulted in a faster proliferation rate in comparison with scramble control (Supplementary Fig. S3a and S3b). Furthermore, both Annexin V and propidium iodide (PI) staining data showed that miR-23b promoted early as well as late apoptosis (Supplementary Fig. S3c). Note, because of this capacity to inhibit proliferation, the effect of miR-23b on metastasis as presented in Figure 4b needs to be characterized in greater details in the future.
We next determined whether the impact of miR-23b on metastasis was also attributable to effects on later steps of the extravasation initiation at distant sites, independent of its influence on local invasion. We injected miR-23b-expressing HCT 116 cells directly into the circulation of severe combined immunodeficient mice. Metastatic nodules developed in the colon, liver, kidney or lungs within a period of 5 weeks after injection in the control mice (Supplementary Fig. S3d). Examination of the lungs revealed 14-fold fewer lung metastases in the mice implanted with the miR-23b-expressing HCT 116 cells (Fig. 4e,f). On the basis of these observations in vivo, we conclude that miR-23b has a critical role in tumour development, especially in the early and late stages of metastasis.
MiR-23b regulates a cohort of prometastatic genes
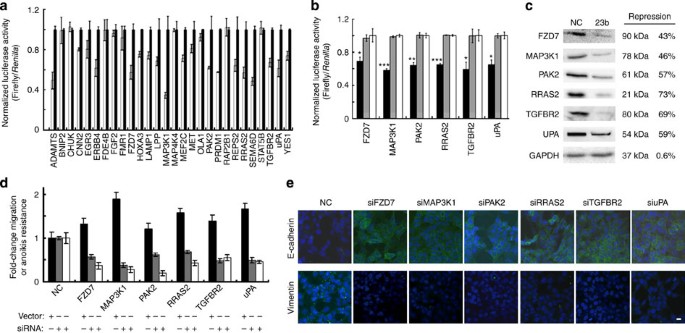
To unveil the molecular mechanism of miR-23b, we used three algorithms that predict the targets of miRNA—PicTar20, TargetScan21 and miRDB22. More than 100 genes could be regulated by miR-23b on the basis of an agreement between at least two algorithms. We cloned the 3′-untranslated region (UTR) of 28 putative miR-23b targets into a luciferase construct and performed quantitative examination of the luciferase activities. Reporter assays with miR-23b-expressing HCT 116 cells revealed that a dozen putative targets were silenced by 35–75% (Fig. 5a). Mutation of the putative miR-23b site(s) in the 3′-UTR of FZD7, MAP3K1 (MEKK1), PAK2, TGFβR2, RRAS2 or uPA resulted in an abrogated responsiveness to miR-23b (Fig. 5b; Supplementary Table S5). The mutation of the miR-23b site(s) lead to an almost identical activity to the wild-type reporters, suggesting the putative site(s) in the UTR of those genes is the main site targeted by miR-23b. Furthermore, the endogenous protein levels of these six genes were assayed in miR-23b-expressing HCT 116 cells. MiR-23b reduced the levels of these proteins by 35–70% (Fig. 5c).
Figure 5: MiR-23b directly regulates a cohort of prometastatic genes.
(a) Luciferase activity in HCT 116 cells infected with miR-23b (white bar) or control vector (black bar) after transfection with the indicated 3′-UTR-driven reporter constructs, _n_=3. (b) Luciferase activity in HCT 116 cells infected with miR-23b or control vector after transfection with the indicated 3′-UTR-driven reporter constructs. Black bar: 3′-UTR+miR-23b; grey bar: mutation 3′-UTR+miR-23b; white bar: 3′-UTR+NC; _n_=3. (c) Immunoblots for endogenous Fzd7, MAP3K1, PAK2, RRAS2, TGF-βR2 and UPA in the indicated HCT 116 cells. GAPDH was use as the loading control. Repression: protein levels in miR-23b-expressing cells relative to vector controls were repressed. (d) Migration rescue (black bar) assays with the miR-23b-expressing HCT 116 cells transfected with individual expression constructs. Migration (grey bar) or anoikis resistance (white bar) assays with the HCT 116 cells transfected with the indicated siRNAs; _n_=3. (e) Images of epithelial to mesenchymal transition markers after transfection of HCT 116 cells infected as indicated. E-cadherin and vimentin are used as epithelial to mesenchymal transition markers. DAPI staining was used to detect nuclei. Scale bar, 50 μm. *P<0.05; **P<0.01; ***P<0.001 (_t_-test). Error bars represented s.d.'s of at least three independent experiments.
To determine whether the in vitro invasion associated with miR-23 bexpression could be reversed via restoration of the FZD7, MAP3K1, PAK2, TGFβR2, RRAS2 or uPA levels, we transfected miR-23b-expressing HCT 116 cells with individual expression constructs as well as a miR-23b sponge expression construct. Clearly, MAP3K1, FZD7, PAK2, TGF-βR2, RRAS2 or uPA, similar to the miR-23b sponge, reversed the miR-23b-imposed migration effects, whereas the siRNAs silencing of each of these genes reduced the motility of HCT 116 cells (Fig. 5d). Interestingly, overexpression of each of these targets appears to over-ride the effect of miR-23b in repressing migration. This result indicates that FZD7, MAP3K1, PAK2, TGF-βR2, RRAS2 or uPA each has a critical role in cell mobility and is under the regulation of the same miRNA, miR-23b.
We next asked whether an inhibition of these effectors would compromise resistance to anoikis. siRNAs against FZD7, MAP3K1, PAK2, TGFβR2, RRAS2 or uPA sensitized HCT 116 cells to anoikis (Fig. 5d). Similarly, siRNAs against FZD7, MAP3K1, PAK2, TGF-βR2, RRAS2 or uPA resulted in the upregulation of E-cadherin, thus repressing epithelial to mesenchymal transition (Fig. 5e). Together, these results showed that FZD7, MAP3K1, PAK2, TGFβR2, RRAS2 or uPA are direct and critical targets regulated by miR-23b. Hence, suppression of FZD7, MAP3K1, PAK2, TGF-βR2, RRAS2, or uPA impaired metastasis-relevant traits in vitro.
MiR-23b inhibits tumour angiogenesis
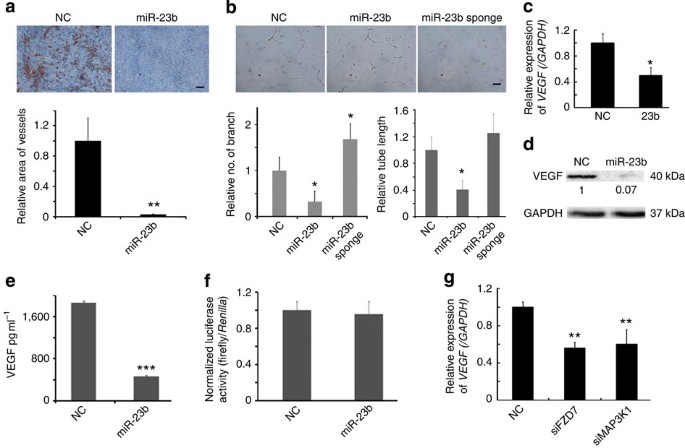
We also assessed the effect of miR-23b on angiogenesis programming during tumour development. After subcutaneous HCT 116 cell injection, neovessels were measured by CD31 staining. MiR-23b resulted in a generation of 30-fold fewer blood vessels (Fig. 6a). To investigate whether miR-23b functions as a dominant determinant of angiogenesis, lentiviral-based constructs expressing miR-23b, miR-23b sponge or negative control (NC) were transfected into human umbilical vein endothelial cells cultured in EBM medium. Twenty-four hours after transfection, HUVECs were plated on Matrigel in the absence of angiogenic stimuli. MiR-23b significantly inhibited tubule elongation and branching, whereas its sponge stimulated them in contrast to NC (Fig. 6b). Recently, Zhou et al.23 showed that miR-23∼27∼24 clusters enhance angiogenesis. However, the anti-miR23 they used is capable of inhibiting both miR-23a and miR-23b, rather than inhibiting only miR-23b. In addition, most of their data showed the combinational effect of miR-23/27.
Figure 6: MiR-23b inhibits tumour angiogenesis.
(a) CD31-stained sections of primary tumours formed by HCT 116 cells infected as indicated (quantification below). Scale bar, 50 μm. (b) Tubule formation of endothelial cells infected as indicated. Shown is a representative image at 24 h after plating. Quantification of tubule branching and tubule length (below). Scale bar, 50 μm. (c) Real-time PCR for endogenous VEGF in the HCT 116 cells infected as indicated. GAPDH was used as the loading control. (d) Immunoblots for endogenous VEGF in the HCT 116 cells infected as indicated. GAPDH was used as the loading control. (e) Enzyme-linked immunosorbent assay for secreted VEGF in the HCT 116 cells infected as indicated. (f) Luciferase activity in HCT 116 cells infected with miR-23b or control vector after transfection of the VEGF 3′-UTR-driven reporter constructs; _n_=3. (g) Real-time PCR for endogenous VEGF in the HCT 116 cells infected as indicated. *P<0.05; **P<0.01; ***P<0.001 (_t_-test). Error bars represented s.d.'s of at least three independent experiments.
Vascular endothelial growth factor (VEGF) is one of the most potent pro-angiogenic factors that are upregulated in human tumours. Thus, we measured the transcriptional and translational levels of VEGF by means of real-time PCR and western blot. When HCT 116 cells were treated with miR-23b mimics, the mRNA level was decreased by up to 50% and the cytoplasmic VEGF expression up to 99% (Fig. 6c,d). Interestingly, secreted VEGF was also decreased by up to 75% when treated with miR-23b (Fig. 6e).
We then investigated whether miR-23b directly regulates the expression of VEGF. We cloned the 3′-UTR of VEGF into a luciferase construct and performed quantitative examination of luciferase activities. The luciferase reporter assay suggested that VEGF is not a target directly regulated by miR-23b (Fig. 6f). FZD7, a receptor for Wnt signalling protein, was previously shown to have a role in neovessel formation, whereas MAP3K1 regulates angiogenesis via activation of the transcription factor AP-1 (refs 24,25). It was observed that siRNAs targeting either FZD7 or MAP3K1 resulted in a decrease in VEGF (Fig. 6g). Thus, miR-23 apparently exerts an effect on angiogenesis by indirectly suppressing VEGF.
Expression patterns of miR-23b in human colon samples
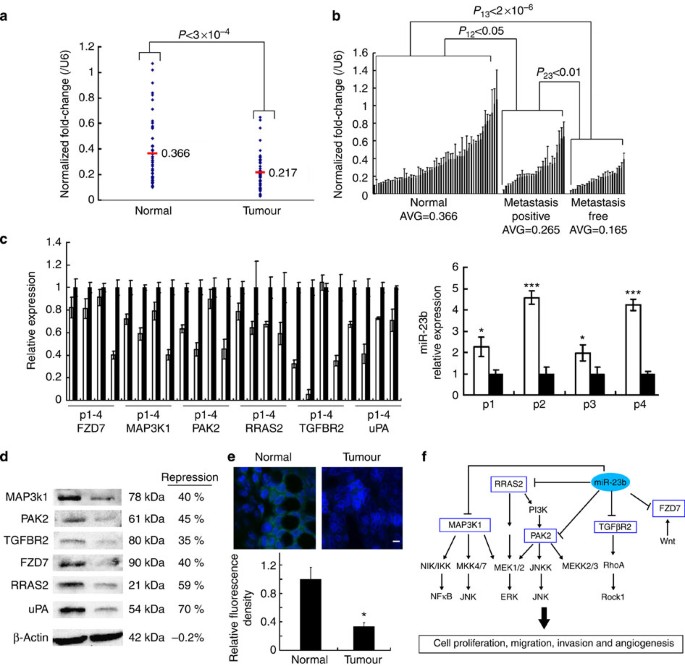
To investigate the expression profile of miR-23b, we collected 50 pairs of human colorectal tumour and normal adjunct tissue samples. Expression analysis of miR-23b in these samples showed a higher mean expression in the normal samples (P<3.0×10⁻⁴; Fig. 7a). Furthermore, when we divided the tumour samples into two groups according to whether they are obtained from metastasis-free or metastasis-positive patients, we found that the mean expression level of miR-23b was twofold lower in the metastatic-free samples than the normal samples (_P_13<2.0×10⁻⁶; Fig. 7b). Unexpectedly, the mean expression of miR-23b was higher in the metastasis-positive samples compared with the metastasis-free samples (_P_23<0.01), although it was still lower compared with the levels in the normal samples (_P_12<0.05). The _P_-value of the metastasis-free samples relative to the normal samples was much lower than the metastatic samples relative to either the normal or metastasis-free ones (that is, _P_13<<P12 or _P_23), thus indicating a significant association between the expression level of miR-23 and the early stage of colon cell progression towards tumour states.
Figure 7: MiR-23b levels correlate inversely with its targets in human colon tumours.
(a) Real-time PCR for miR-23b in 52 pairs of human colon tumours or normal adjunct samples. There was a significant difference in miR-23b expression between these two groups (P<3.0×10⁻⁴; Wilcoxon–Mann–Whitney test). Each sample is repeated three times. (b) The same samples as in 6a were divided into three groups: normal adjunct samples, metastasis-positive cancer sample, and metastasis-free samples. There was a significant difference in miR-23b expression between these three groups (_P_13<2×10⁻⁶, _P_23<0.05, _P_12<0.01; Wilcoxon–Mann–Whitney test). (c) Immunoblots for endogenous FZD7, MAP3k1, PAK2, RRAS2, TGF-βR2 and UPA in four pairs of clinical samples. The expression levels of miR-23b in these patient samples are shown in right. White bar: normal samples; black bar: tumor samples. β-Actin was used as the loading control. *P<0.05; ***P<0.001 (_t_-test). Error bars represented s.d.'s of at least three independent experiments. (d) Western blot assays showing the expression level of MAP3k1, PAK2, TGF-βR2, FZD7, RRAS2 and uPA in the samples from Patient 4. β-Actin was used as the loading control. (e) In situ hybridization for miR-23b (green) in the clinical samples (quantification right); DAPI counterstain (blue). _n_=3. *P<0.05 (_t_-test). Error bars represented s.d.'s of at least three independent experiments. Scale bar, 50 μm. (f) Model of miR-23b-mediated pathways in tumour growth and cancer metastasis. The key proteins directly targeted by miR-23b are highlighted in the pathways of NF-κB, JNK, ERK, PI3K, TGF-βR2 and Wnt.
Finally, we examined whether a concomitant increase in these six proteins was correlated with the repression of miR-23b expression in the clinical colorectal samples. Western blotting results in four pairs of patient samples clearly showed that the expression of all of these six proteins was increased in cancer samples relative to normal tissue (Fig. 7c,d). The real-time PCR result proved that the expression level of miR-23b was decreased in cancer samples. The in situ hybridization data for miR-23b showed that the proportion of cells expressing miR-23b was reduced by 2.5-fold in the colon tumour samples relative to the normal ones (Fig. 7e). Thus, miR-23b expression is inversely correlated with the expression of its targets in clinical colon samples.
Discussion
More and more evidence has accumulated showing that miRNAs participate in cancerogenesis. It has thus become an essential task to identify physiologically relevant and/or therapeutically promising miRNA26,27. In this study we systematically investigated the capacity of individual miRNAs in cancer cell migration, invasion and apoptosis. To perform the migration screening on a large-scale level, we developed a SAMcell. Compared with the traditional transwell assay, this microarray demonstrates certain important advantages, including higher throughput and accuracy. Owing to a thermally responsive polymer, this microarray has additional important features, such as tailored cell patterns, as well as a clear cell boundary, and hence has no interference from neighbouring cells. Thismicroarray may be readily adapted to perform large-scale screens of functional genes regulating other types of cell behaviour, such as apoptosis or cell cycle (Supplementary Fig. S4a).
Through quantitatively examining the impact of all known human miRNAs on cell migration, we found that over 20% miRNAs demonstrated a capacity to regulate cell mobility. What is also noted, these migratory miRNAs exhibit versatility in diverse cell types, including four types of epithelial cells as well as HUVECs (Fig. 2b; Supplementary Fig. S4b), thus being of general functionality. Given the fact that cell migration is a basic biological process, we hypothesize that a general regulation of migratory behaviour seems to be another distinctive feature of miRNAs.
To the best of our knowledge, approximately 20 miRNAs have been described as functionally regulating cell migration or metastasis in previous studies13,27; almost all of which are included in our screening list, and these miRNAs exhibited exactly the same prometastic or antimetastatic activities in our screening assay as reported previously. For example, miR-10b or miR-21 promote cell migration, whereas miR-31 or miR-101 have a suppressive impact11,27,28,29. Further implementation of invasion or apoptosis assays resulted in the identification of 36 miRNAs capable of suppressing cancer cell migration, invasion and growth, among which more than half of them have not been characterized yet. These results suggest that more miRNAs might be identified which have potential as therapeutic reagents against cancer metastasis and development.
Such functional analysis is complementary to the conventional differential expression strategy, in which a candidate miRNA is chosen and investigated mainly based on its distinct expression level in disease samples relative to normal ones. By means of an integration of these approaches, we selected miR-23b, as it exerts a regulatory effect on cell migration, invasion and apoptosis and demonstrates a distinct expression pattern in human colon cancer samples relative to normal ones.
MiR-23b is highly conserved in all vertebrates. Although a few studies recently demonstrated that miR-23b is involved in invasion and metastasis, the molecular mechanism remains to be elucidated30,31. The data reported here demonstrated that miR-23b, which is downregulated in human colon cancer samples, could potently repress cancer cell migration, invasion, growth and angiogenesis both in vitro and in vivo. It directly regulates a cohort of prometastatic genes or oncogenes, including FZD7, MAP3K1, PAK2, TGFβR2, RRAS2 or uPA. Re-expression of these individual targets largely reversed miR-23-imposed invasion, whereas siRNA silencing each target impaired metastasis-relevant traits. Consistent with these findings, the levels of these miR-23b targets correlate with disease progression in human tumours. These six genes participate in certain critical signalling pathways, including the ERK, JNK, NF-κB, PI3K, TGF-β and Wnt pathways (Fig. 7f). To the best of our best knowledge, this is the first demonstration in which so many critical pathways are interconnected in the regulation of metastasis under the control of a single miRNA-miR-23b.
Collectively, the findings of the present study have important implications for the understanding of the universal dysregulation of miRNAs in human cancer progression, especially metastasis. We believe that these findings provide new insight into the physiological and therapeutical importance of miRNAs in cancer.
Methods
siRNA duplex and miRNA mimics
siRNA duplexes and all human miRNA mimics were obtained from the GenePharma. The silence efficiency of these RNAi constructs for their targeted mRNAs was tested by quantitative real-time PCR at 24–48 h after transfection. All reactions were run in triplicates. The sequences of the primers are listed in Supplementary Table S6.
Plasmid and cell culture
The human miR-23b gene from genomic DNA is cloned into the modified pLKO.1 (Addgene). The miR-23b sponge was constructed into pLKO.1 vector backbone, which contains eight tandem 'bulged' miR-23b binding motifs, 5′-CCGGGGTAATCCCTG GCAATGTGATATGGTAATCCCTGGCAATGTGACTCGGTAATCCCTGGCAATGTGATATGGTAATCCCTGGC AATGTGACACGGTAATCCCTGGCAATGTGATATGGTAATCCCTGGCAATGTGATCTGGTAATCCCTGGCAATGT GATATGGTAATCCCTGGCAATGTGAG-3′. For all overexpression experiments, the indicated genes were PCR-amplified from cDNA and cloned into the pcDNA3.1 vector backbone. The sequences of the primers are listed in Supplementary Table S6.
Cell lines including Hela, HepG2, U2OS, MCF-7, PANC-1, and HCT 116 were cultured in Dulbecco's Modified Eagle Medium containing 10% fetal bovine serum, 100 U ml−1 penicillin and 0.1 mg ml−1 streptomycin under humidified conditions in 95% air and 5% CO2 at 37 °C. HUVECs, which are donated by Professor Xingyu Jiang at National Centre for Nanoscience and Technology, China, were cultured for three passages in ECM medium (ScienCell) containing 1% endothelial cell growth supplement, 5% fetal bovine serum and 1% P/S.
To establish stable cell lines, the indicated lentiviral vector was packaged and transfected into HCT 116 cells. After 72 h, enhanced green fluorescent protein-positive cells were collected by FACS.
Fabrication of SAMcell
Glass slides (2.2 cm×2.2 cm) were washed with detergent and miliQ water. After dryness, the slides were covered with poly (_N_-isopropylacrylamide) (Aldrich) dissolved in ethanol (6% (w/v). The slides were etched via a shadow mask by oxygen plasma for 3.5 min at 200 W. The reverse transfection protocol refers to previous description32. In brief, 3 μl of OptiMEM (Invitrogen), containing sucrose and Lipofectamine 2000 (Invitrogen) were transferred to each tube and mixed thoroughly. Then, 1 μl siRNA (100 μM) was added to each tube and the mixture was incubated for 20 min at room temperature. Finally, 7.25 μl of a 0.2% (w/v) gelatin (Sigma, Type B) solution was added to each tube and mixed thoroughly. After ultraviolet sterilization, the reverse transfection reagent was printed either on the chip via a nanolitre microfluidic dispenser we recently created33 or on a commercially available nanodispenser (Phoenix, Art Robbins Instruments). Next, the slides were fixed in a six-well plate by melted wax. About 3 ml 37 °C medium containing 5×10⁵ cells were transferred in each well. About 24–48 h later, the dishes were moved at room temperature for 5 min and washed with PBS for three times to ensure the total removal of the polymer. Then the cell microarray was recorded by a microscope system.
Image capture and analysis
Images for cell migration were taken by Nikon TE2000-E (CCD: Regita 2000R, Qimaging), Nikon TE2000-S (CCD: QHY IMG2P) or ImageXpress Micro (Molecular Devices). Areas of cell islands were measured by the Image J software. Polygon selections were used to recognize the boundary of cells, and both 'Analyse and Measure' were used to calculate the area of the islands. Five repeats were performed in each assay.
When 100s of different miRNAs were tested by our migration chip, Benjamini and Hochberg false discovery rate was used as a correction for multiple testing with a _P_-value cutoff of 0.05 by use of JMP 9.0 software. Only the miRNAs, whose effect was over 10% and _P_-value cutoff was under 0.05, will be selected as candidates.
Transwell assays and cell proliferation assay
For migration assays, cells were seeded into the upper chamber of a Transwell insert (pore size, 8 μm; Costar) in 100 μl serum-free medium per well. Medium (600 μl) containing 10% serum was placed in the lower chamber to function as a chemoattractant. Non-migratory cells were removed from the upper chamber by scraping with a cotton bud. The cells remaining on the lower surface of the insert were fixed with 2% formaldehyde (Sigma) and stained by DAPI (Roche). For invasion assays, cells were seeded in a Matrigel (Bio-Rad)-coated chamber and were incubated at 37 °C. For cell proliferation assay, Hela-transfected cells were seeded in a six-well plate. After 48 h of incubation, the cells were trypsinized, and counted by hemocytometer measurement. Cells were quantified as the number of cells found in 15 random microscope fields in three independent inserts. Error bars represent the s.d.'s. from three separate experiments.
Apoptosis assay
We used Annexin V-FITC Kit (Biosea Biotechnology Co. Ltd) to detect apoptosis of cells. Apoptotic cells were identified by double labelling with Annexin V and PI assay. Cells are incubated with Annexin V solution for 30 min, followed by PI solution for 10 min. Cells at early apoptotic stage were stained by Annexin V, and cells at late apoptotic stage were stained by PI.
Anoikis assay
Anoikis resistance was detected by seeding 5.0×10⁴ cells in ultra-low attachment plates (Corning). After 24 h culture, cells were resuspended in 0.4% trypan blue (Sigma) and cell viability was assessed.
Immunofluorescence
Cells were seeded onto sterile cover slides and allowed to attach overnight. Cells were then fixed with 4% formaldehyde, permeabilized with 0.1% Triton X-100 and blocked in 2% bovine serum albumin for 1 h at room temperature. The expression of E-cadherin or vimentin was examined using their antibodies and visualized using anti-rabbit IgG (H+L), F (ab′)2 fragment (Alexa Fluor 488 Conjugate, Cell Signalling Technology). Immunofluorescence was examined using an Olympus IX70 Confocal microscope (Olympus). The concentrations of the antibodies were 1:200 diluted.
Animal studies and immunohistochemistry
All research involving animals complied with the protocols approved by the Laboratory Animal Centre, Peking University. All BALB/C nude mice were purchased from the animal centre of Peking University. For subcutaneous tumour implantation, HCT116 cells were suspended in PBS and injected into the dorsum of mice. For tail vein tumour cells injection, HCT116 cells were suspended in PBS and injected into the tail vein of mice, and after 5 weeks, the lungs and other tissues were obtained to examine the metastatic nodules.
Immunohistochemistry was accomplished at the Chinese Academy of Medical Sciences. Tissue samples were fixed in 10% buffered formalin for 12 h, followed by a wash with PBS and transferred to 70% ethanol, and then embedded in paraffin, sectioned and stained with haematoxylin and eosin. The immunohistochemistry detection with anti-CD-31 antibodies (BD Biosciences) was performed on paraffin sections.
Luciferase assays
293T cells (4.0×10⁴) were co-transfected with 200 ng of the indicated pGL3 Firefly luciferase construct and 20 ng of a pGL3 Renilla luciferase normalization control. In the meantime, the indicated miRNA expression plasmid or mimics was transfected. The media was changed after 6 h, and luciferase activity was measured after 48 h using the dual luciferase reporter assay system (Promega). The primers used to clone 3′-UTR of the genes are listed in Supplementary Table S6.
Immunoblotting
Lysates were resolved by electrophoresis, transferred to a polyvinylidene difluoride membrane (Millipore Corporation), and probed with antibodies against MEKK1 (Assay Designs), FZD7 (Abcam), TGFBR2 (CST), RRAS2 (Santa Cruz), PAK2 (CST), GAPDH (Santa Cruz), VEGF (Santa Cruz) or β-actin (Santa Cruz). The concentrations of the antibodies were 1:1,000 diluted.
miRNA in situ hybridization
MiRNA expression was assessed from paraffin sections as previously described34. In brief, after 2 h pre-hybridization, a 5′-FITC-labeled miRCURY LNA probe targeting miR-23b (Exiqon) was hybridized to proteinase K-treated 10 mm sections at 37 °C for 12 h. The images are taken and analysed by ImageXpress Micro (Molecular Devices).
In vitro Matrigel angiogenesis assays
In vitro Matrigel angiogenesis assays were performed as previously described35. Briefly, 24 h after infection of miR-23b sponge or NC, HUVECs were seeded on Matrigel (BD Biosciences) in 96-well plate (Sigma). Tube lengths and branches were measured and quantified by Image J software.
Enzyme-linked immunosorbent assay
The concentration of VEGF in culture medium supernatants was determined by enzyme-linked immunosorbent assay. The human VEGF ELISA kits were purchased from R&D Systems. The assay was performed according to the manufacturer's protocol.
Human colon tumour samples
All human colon samples were obtained from the Beijing Cancer Hospital. Before surgery at the centre, all patients provided written informed consent to allow any excess tissue to be used for research studies. Samples were snap-frozen in Optimal Cutting Temperature and stored at −80 °C until use. The pathological status of the specimens was provided by the hospital. The quantitative examination of miRNA expression in those samples follows to previous description36.
All results are expressed as means and _n_=3 from independent experiments. When two groups were compared, Wilcoxon–Mann–Whitney tests (two-tailed) were used. A _P_-value <0.05 was considered significant.
Statistical analysis
For statistical analysis, two-sided unpaired Student's _t_-tests were processed by Excel spreadsheet. A _P_-value<0.05 was considered statistically significant. The symbols * indicate P<0.05; **indicate P<0.01; ***indicate P<0.001. Error bars represented s.d.'s of at least three independent experiments, unless indicated otherwise.
Additional information
How to cite this article: Zhang, H. et al. Genome-wide functional screening of miR-23b as a pleiotropic modulator suppressing cancer metastasis. Nat. Commun. 2:554 doi: 10.1038/ncomms1555 (2011).
