Switch of glycolysis to gluconeogenesis by dexamethasone for treatment of hepatocarcinoma (original) (raw)
Introduction
During a period of fasting, when dietary carbohydrates are unavailable, glucose is generated via gluconeogenesis in the liver to ensure a continuous supply of glucose to vital organs1,2,3. Although most steps in gluconeogenesis are the reverse of those found in glycolysis, in three specific steps unique enzymes are used either to bypass a thermodynamically unfavourable step or to avoid uncontrolled futile cycling. These enzymes in gluconeogenesis, namely phosphoenolpyruvate carboxykinase (PEPCK), fructose-1,6-bisphosphatase and glucose-6-phosphatase (G6Pase), convert oxaloacetate to phosphoenolpyruvate, fructose 1,6-bisphosphate to fructose 6-phosphate and glucose-6-phosphate to glucose, respectively, leading to an effective reversal of glycolysis4,5,6. Recently, metabolism of glucose by cancer cells has been intensively studied and targeting tumour metabolism is highlighted as a potential strategy against cancer7,8,9,10. However, how and whether gluconeogenesis affects tumour metabolism remains unclear.
The phenomenon of enhanced aerobic glycolysis, first observed by Otto Warburg, is recognized as a hallmark of malignant cancer11,12,13,14. This glycolytic phenotype provides a constant supply of metabolic intermediates essential for macromolecule biosynthesis and is necessary for tumour cell growth15. The switch from oxidative phosphorylation to glycolysis is frequently observed in cancer cells and linked to tumour growth and invasion16,17,18. However, whether reversing this glycolytic phenotype via gluconeogenesis is beneficial to tumour suppression remains elusive. Furthermore, although normal liver cells continually produce glucose via gluconeogenesis, whether and how those transformed hepatocytes escape the inhibitory effect of gluconeogenesis on glycolysis19,20,21 remains unclear.
Glucocorticoids (GCs) have a pivotal role in gluconeogenesis in multiple ways5,22. To maintain homeostasis within the body, GCs have to be precisely regulated in different tissues. Besides receptor-based regulation23, prereceptor metabolic regulation by dehydrogenase enzymes is also extremely important24,25,26. 11β-hydroxysteroid dehydrogenase type 1 (11β-HSD1) intracellularly converts inert cortisone in human or dehydrocorticosterone in rodents into the active form, cortisol or corticosterone. By contrast, 11β-HSD2 catalyses 11-hydroxy cortisol to the inert 11-keto form cortisone. To date, it remains unclear whether 11β-HSD1 and11β-HSD2 are involved in the abnormal glucose metabolism in hepatocarcinoma.
In this study we hypothesized that to maintain a high efficient flow of glycolysis, hepatocarcinoma employs an altered pathway to escape gluconeogenesis. Our data show that malignant hepatocytes downregulate the expression of 11β-HSD1 but upregulate the expression of 11β-HSD2, leading to unresponsiveness to endogenous GCs and subsequent loss of gluconeogenesis. However, such loss of gluconeogenesis can be restored by the administration of exogenous dexamethasone (Dex). Thus, this study reveals a fundamental metabolic change in hepatocarcinoma, leading to a potential new strategy for the treatment of hepatocarcinoma.
Results
Loss of gluconeogenesis in murine hepatocarcinoma
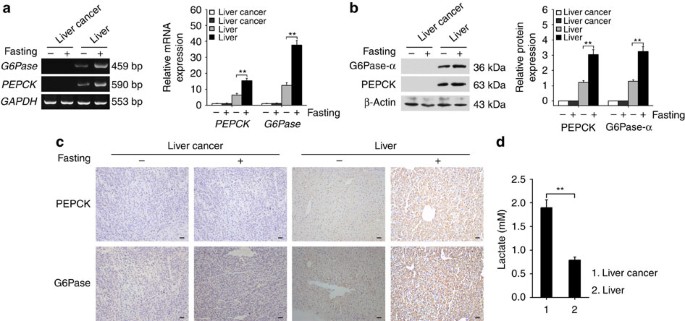
When we used the murine hepatocarcinoma tumour cell line H22 to generate hepatocarcinoma, the expression of PEPCK and G6Pase was found to be strikingly decreased and was unaffected by fasting, as shown by both reverse transcriptase–PCR and western blot (Fig. 1a,b). Moreover, the deficiencies of these two enzymes in fasting tumour tissues were confirmed by immunohistochemical staining (Fig. 1c). In contrast to gluconeogenesis, H22 hepatocarcinoma generated much more lactate, compared with normal liver tissue (Fig. 1d), suggesting the loss of gluconeogenesis and enhancement of glycolysis in malignant hepatocytes.
Figure 1: Loss of gluconeogenesis in murine hepatocarcinoma.
Normal BALB/c mice and H22 hepatocarcinoma-bearing mice were fed or subjected to 24 h fasting. The expression of PEPCK and G6Pase in normal liver and hepatocarcinoma tissues was analysed by reverse transcriptase–PCR (a, left), real-time PCR (a, right), western blot (b) and immunohistochemical staining. (c) Hepatocarcinoma and liver tissues were used to analyse the levels of lactate, scale bar, 20 μm (d). Data shown are representative of three independent experiments and error bars represent means±s.e.m., **P<0.01 (analysis of variance).
Abnormal 11β-HSDs explain the loss of gluconeogenesis
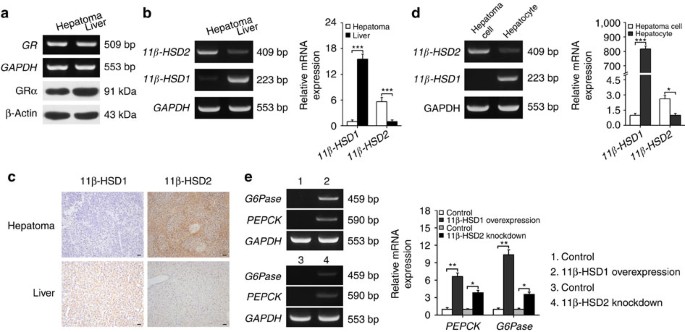
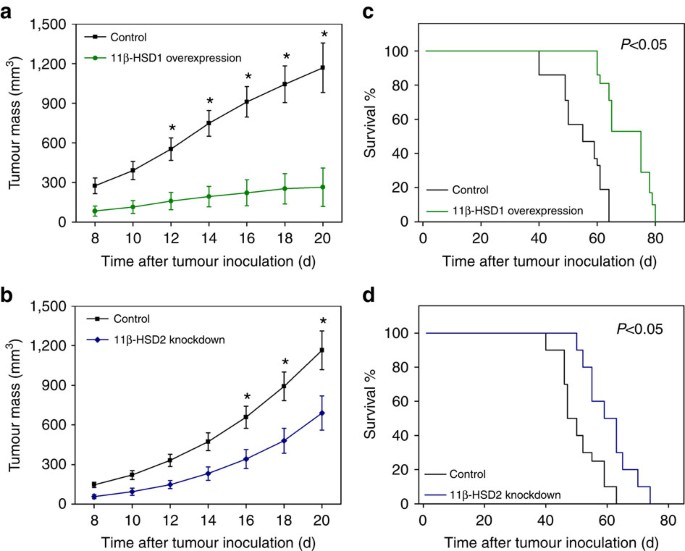
GCs strongly promote hepatocyte gluconeogenesis27. We found that the prototypic receptor GRα that mediates GC signalling was properly expressed by both hepatocarcinoma and normal liver tissues (Fig. 2a), suggesting that GC receptor (GR) might not be the reason for hepatocarcinoma losing its sensitivity to endogenous GC for gluconeogenesis. 11β-HSD1 and 11β-HSD2 are two critical enzymes that regulate the activity of GC24,25,26. In mice, 11β-HSD1 converts inactive dehydroxycorticosterone to active corticosterone, whereas 11β-HSD2 converts corticosterone to dehydroxycorticosterone. Surprisingly, 11β-HSD1 was markedly downregulated and 11β-HSD2 was markedly upregulated in hepatocarcinoma tissues compared with that in normal liver tissues (Fig. 2b). This was further corroborated by immunohistochemical staining (Fig. 2c). In addition, primary hepatocarcinoma cells and normal hepatocytes, isolated from tumour-bearing mice, also showed downregulation of 11β-HSD1 and upregulation of 11β-HSD2 (Fig. 2d). As expected, 11β-HSD1 overexpression or 11β-HSD2 knockdown (Supplementary Fig. S1) both restored gluconeogenesis by upregulating PEPCK and G6Pase in H22 tumour tissues (Fig. 2e). As a result, the inoculation of engineered H22 tumour cells in mice resulted in the inhibition of tumour growth and the corresponding prolonged survival of the mice (Fig. 3a–d). Moreover, a Tet-OFF system to control 11β-HSD1 expression in H22 cells was used in mice. The result showed that the induced expression of 11β-HSD1 by doxycycline-free water decreased the tumour growth significantly (Supplementary Fig. S2). These data together suggest that the abnormal expression of 11β-HSD1 and 11β-HSD2 results in the insensitiveness of hepatocarcinoma tumour cells to endogenous GCs and the rebalancing of 11β-HSD1/11β-HSD2 may generate antitumour consequences.
Figure 2: Abnormal expression of 11β-HSD1 and 11β-HSD2 in mouse hepatocarcinoma.
(a) The expression of GR in hepatocarcinoma and normal liver tissue was detected by reverse transcriptase–PCR (upper) and western blot (bottom). (b) The expression of 11β-HSD1 and 11β-HSD2 in H22 hepatocarcinoma was analysed by reverse transcriptase–PCR (RT–PCR; left) and real-time PCR (right). (c) Immunohistochemical analysis of 11β-HSD1 and 11β-HSD2 in H22 hepatocarcinoma tissue. Scale bar, 20 μm. (d) The expression of 11β-HSD1 and 11β-HSD2 in H22 tumour cells was analysed by RT–PCR (left) and real-time PCR (right). (e) Upregulation of PEPCK and G6Pase by 11β-HSD1 overexpression and 11β-HSD2 knockdown. H22 cell line with 11β-HSD1 overexpression or 11β-HSD2 knockdown was injected to mice. The expression of PEPCK and G6Pase in hepatocarcinoma tissues was detected by RT–PCR (left) and real-time PCR (right). Data shown are representative of three independent experiments and error bars represent means±s.e.m., *P<0.05, ** P<0.01, *** P<0.001 (analysis of variance).
Figure 3: Inhibition of H22 tumour growth by 11β-HSD1 overexpression or 11β-HSD2 knockdown.
H22 cell line with 11β-HSD1 overexpression or 11β-HSD2 knockdown was s.c. injected to mice (_n_=6 per group). (a,b) The tumour growth was analysed by analysis of variance (*P<0.05). (c,d) The long-term survival of mice was analysed by Kaplan–Meier analysis. Data shown are representative of three reproducible experiments. The error bars represent means±s.e.m.
Gluconeogenesis is deficient in human hepatocarcinoma
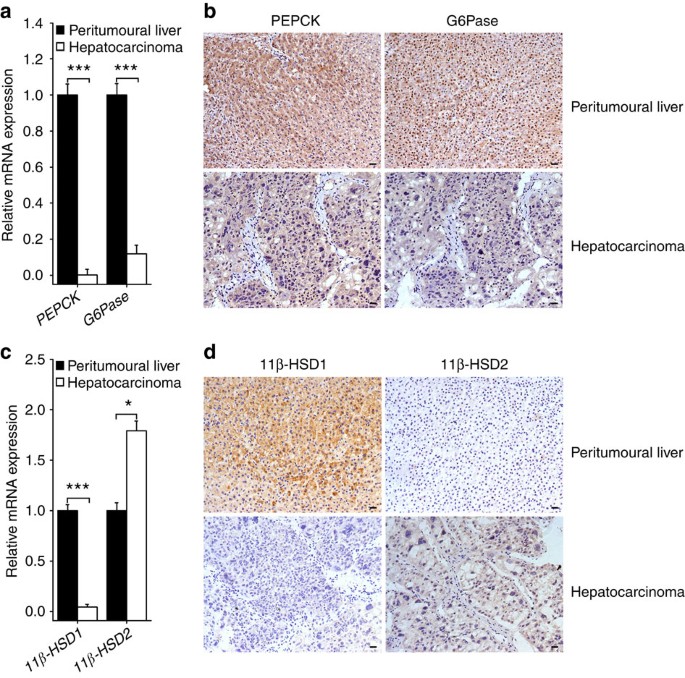
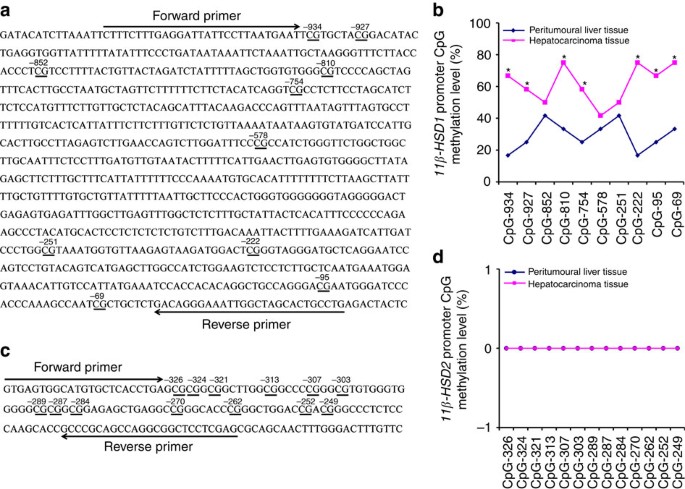
To translate the above findings into a clinical setting, hepatocarcinoma tissues from patients were surgically obtained. Both the transcripts and proteins of PEPCK and G6Pase were strikingly lower in the tumour tissues but much higher in the peritumoural liver tissues, as shown by real-time PCR and immunohistochemical staining (Fig. 4a,b). In line with these results, it was clear that 11β-HSD1 was downregulated but 11β-HSD2 was upregulated in hepatocarcinoma tissues (Fig. 4c,d). The methylation analysis of the 11β-HSD1 promoter (_n_=10) also indicated significant higher methylation levels (CpG-934, CpG-927, CpG-810, CpG-754, CpG-222, CpG-95 and CpG-69) compared with the peritumoural liver tissues (Fig. 5a,b). This could be one explanation for the downregulation of 11β-HSD1. The methylation analysis of 11β-HSD2 did not show CpG methylation (Fig. 5c,d), suggesting other pathway(s) regulate the expression of 11β-HSD2.
Figure 4: Gluconeogenesis is deficient in clinical hepatocarcinoma.
(a) The expression of PEPCK and G6Pase in patients’ hepatocarcinoma tissues (_n_=6) was analysed by real-time PCR. Data shown are representative of three independent experiments and error bars represent means±s.e.m., ***P<0.001 (analysis of variance (ANOVA)). (b) Immunohistochemical analysis of PEPCK and G6Pase in patients’ hepatocarcinoma tissues. Scale bars, 50 μm. Data are representative of six independent experiments. (c) The expression of 11β-HSD1 and 11β-HSD2 in patients’ hepatocarcinoma tissues (_n_=6) was analysed by real-time PCR. Data shown are representative of three independent experiments and error bars represent means±s.e.m., *P<0.05, ***P<0.001 (ANOVA). (d) Immunohistochemical analysis of 11β-HSD1 and 11β-HSD2 in patients’ hepatocarcinoma tissues. Scale bars, 50 μm. Data are representative of six independent experiments.
Figure 5: High methylation in the promoter sequence of 11β-HSD1 in human hepatocarcinomas.
Human hepatocarcinoma tissues and peripheral liver tissues (_n_=10 each) were used for DNA isolation. Methylation of CpG in the promoter region of 11β-HSD1 (a,b) or 11β-HSD2 (c,d) was determined. *P<0.05 (analysis of variance).
11β-HSD1/2 ratio influences patient survival
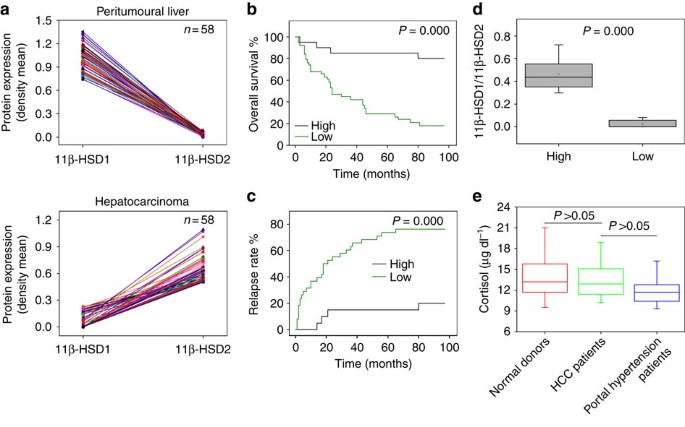
To further clarify the exact situation of 11β-HSD1/11β-HSD2 in hepatocarcinoma patients, 58 human hepatocarcinoma specimens were analysed by immunohistochemistry and the relative expression of 11β-HSD1 and 11β-HSD2 was quantified, which revealed the inverse expression of 11β-HSD1 and 11β-HSD2 in hepatocarcinoma relative to normal liver tissue (Fig. 6a). The ratio of 11β-HSD1/11β-HSD2 was calculated and the patients’ samples were split into two classes (high and low) according to the median value in the set of 58 samples. Kaplan–Meier survival analyses showed that patients with a high ratio had a significant longer survival time and lesser recurrence than those with a low ratio (Fig. 6b,c). In addition, when the high and low ratios were compared, significant differences were found (Fig. 6d). Moreover, the 11β-HSD1/11β-HSD2 ratio was found to be uncorrelated with sex or age (Supplementary Table S1). In addition, we did not find that plasma GC levels were altered in hepatocarcinoma patients compared with that in portal hypertension patients without hepatocarcinoma or normal donors (Fig. 6e). These data suggest that the change in 11β-HSD1/11β-HSD2 profoundly influences the malignancy of patients and, probably, is a useful prognostic marker for the outcome of patients with hepatocarcinoma.
Figure 6: 11β-HSD1/11β-HSD2 ratio is associated with overall survival and relapse in patients with hepatocarcinoma.
(a) The inverse relationship of 11β-HSD1 and 11β-HSD2 in hepatocarcinoma. The embedded human hepatocarcinoma tissues (_n_=58) were immunohistochemically stained with anti-11β-HSD1 or 11β-HSD2 antibody. The relative expression of 11β-HSD1 and 11β-HSD2 was determined by the density mean analysed by Image-Pro Plus software. (b) The Kaplan–Meier method was used to analyse the overall survival for 58 liver cancer patients with high or low 11β-HSD1/11β-HSD2 ratio. (c) The 11β-HSD1/11β-HSD2 ratios were used to analyse their correlation with the relapse of patients with hepatocarcinoma. (d) Comparison of the 11β-HSD1/11β-HSD2 ratio between high group (_n_=29) and low group (_n_=29). (e) Levels of endogenous GCs are not altered in patients with hepatocarcinoma. Plasma derived from hepatocarcinoma patients (_n_=12), normal donors (_n_=12) and portal hypertension patients without hepatocarcinoma (_n_=12) was used to determine the levels of GCs with a kit. In the box and whisker plots, the box contains 50% of the data. Twenty-five per cent of the data are greater than the top of the box and 25% of the data are less than the bottom of the box. The line in the box represents the median.
Dex restores gluconeogenesis in murine hepatocarcinoma
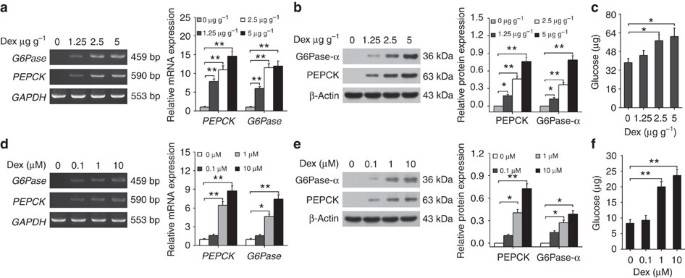
All the above data hinge around one key point. Could an agent be found to bypass the abnormal regulation of 11β-HSD1/11β-HSD2 and thereby lead to reversal of tumour growth? Dex, a prehydroxylated, synthetic, active form of GC was tested here. The mice were subcutaneously (s.c.) injected with 3 × 10⁵ H22 cells for 4 days, and then treated with intraperitoneal (i.p.) injection of different concentrations of Dex (1.25, 2.5 and 5 μg g−1) or saline once per day for 16 days. As shown in Fig. 7a–c, Dex treatment resulted in an increase in PEPCK and G6Pase expression, and tissue glucose levels in all mice compared with saline controls. In line with these in vivo results, the in vitro Dex-treated H22 tumour cells also showed an upregulation of PEPCK and G6Pase expression at 1 and 10 μM (Fig. 7d,e). Consistently, the levels of intracellular glucose were also found to be increased (Fig. 7f). Besides PEPCK and G6Pase, FBP1, an enzyme catalysing the hydrolysis of fructose 1,6-bisphosphate to fructose 6-phosphate, was also increased after Dex treatment; however, peroxisome proliferator-activated receptor coactivator 1α (PGC1α), a transcriptional coactivator that regulates the genes involved in glucose metabolism, was not found to be altered (Supplementary Fig. S3). To support the above data, 5-aza-2′-deoxycytidine, a methylation inhibitor, was used to inhibit highly methylated 11β-HSD1. We found that the addition of 5-aza-2′-deoxycytidine resulted in the upregulation of 11β-HSD1 expression, as well as PEPCK and G6Pase expression, in H22 tumour cells (Supplementary Fig. S4a). As a result, the levels of intracellular glucose were also increased (Supplementary Fig. S4b).
Figure 7: Dex upregulates gluconeogenesis in vivo and in vitro.
BALB/c mice were s.c. inoculated with H22 cells and i.p. treated with 0, 1.25, 2.5 or 5 μg g−1 Dex. The expression of PEPCK and G6Pase in hepatocarcinomas was analysed by reverse transcriptase–PCR (RT–PCR; a, left) and real-time PCR (a, right), or analysed by western blot (b). Meanwhile, 10 mg murine hepatocarcinomas tissues were lysed in 100 μl lysate and the concentration of glucose in the solution was measured (c). H22 cells were treated with 0, 0.1, 1 or 10 μM Dex for 7 days. The expression of PEPCK and G6Pase was determined by RT–PCR (d, left), real-time PCR (d, right) and western blot (e). Treated H22 cells (106) were lysed in 2 ml H2O and the concentration of glucose in the solution was measured (f). Data shown are representative of three independent experiments and error bars represent means±s.e.m., *P<0.05, **P<0.01 (analysis of variance).
Dex is a potential agent to treat hepatocarcinoma
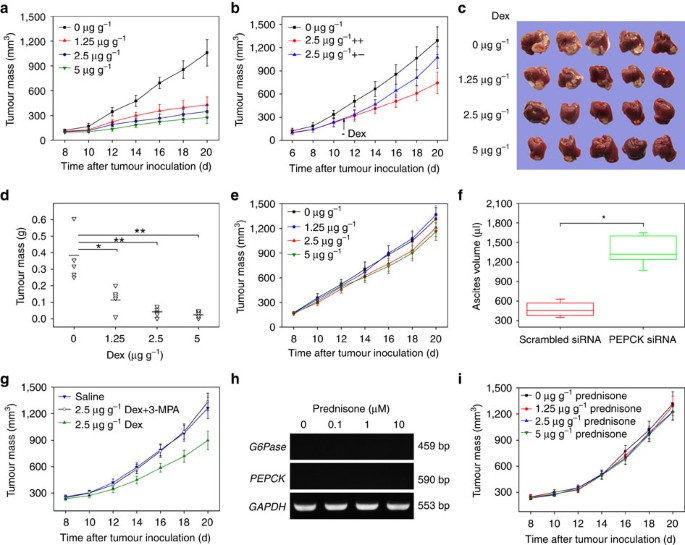
We then examined the antitumour effects of Dex-induced gluconeogenesis restoration. Mice were s.c. injected with 3 × 10⁵ H22 cells for 4 days and then treated with i.p. injection of different concentrations of Dex or saline once per day for 16 days. Dex treatment, monitored from day 8, showed significant inhibition of ectopic H22 tumour growth (Fig. 8a). However, the withdrawal of Dex from day 11 resulted in a rebound tumour growth (Fig. 8b). Orthotopic H22 tumour growth was also inhibited by Dex (Fig. 8c,d), which excluded the possible influence of different inoculation sites on the results. Nevertheless, when 3 × 10⁵ non-liver-derived B16 melanoma tumour cells were tested by s.c. injected into C57BL/6 mice for 4 days and then treated with different concentrations of Dex, Dex did not significantly suppress tumour growth and only produced marginal effects (Fig. 8e). This suggests a relative selectivity of Dex for hepatocarcinoma but not non-liver cancers. To support this, the downregulation of the 11β-HSD1 expression was only found in H22 tumour cells but not in B16, EL4 lymphoma or 4T1 breast tumour cells (Supplementary Fig. S5). In addition, in vitro, we found that Dex appeared not to affect H22 cell proliferation but induced H22 cell apoptosis (Supplementary Fig. S6).
Figure 8: Dex represses H22 hepatocarcinoma.
(a) Dex inhibited the growth of ectopic hepatocarcinoma. BALB/c mice were inoculated with H22 cells into the right flank and treated with 0, 1.25, 2.5 or 5 μg g−1 Dex. The growth of tumour was monitored (_n_=6, each group). (b) BALB/c mice were inoculated with H22 cells and treated with 0 or 2.5 μg g−1 Dex on day 4, once per day for 7 days. On day 11, Dex treatment was withdrawn in half of the treated mice and the remaining mice were continued with 2.5 μg g−1 Dex treatment. The growth of tumour was monitored (_n_=6, each group). (c,d) Dex inhibited the growth of orthotopic hepatocarcinoma. BALB/c mice liver were inoculated with H22 cells and treated with 0, 1.25, 2.5 or 5 μg g−1 Dex. The typical size of tumours (c) and tumour weight (d) on day 16 were shown (_n_=5, each group). (e) Dex did not affect the growth of B16 melanoma. C57BL/6 mice were inoculated with B16 cells into the right flank and treated with 0, 1.25, 2.5 and 5 μg g−1 Dex. The growth of tumour was monitored (_n_=6, each group). (f) Knockdown of PEPCK promoted the formation of H22 tumour ascites. H22 tumour cells (1 × 10⁵) were i.p. injected to mice. Two days later, mice were treated with 2.5 μg g−1 Dex. At the same time, the chemically modified 2′-_O_-methyl, 5′-cholesterol siRNA for PEPCK and scrambled siRNA (10 nmol in 0.2 ml saline buffer, each) were also i.p. injected to the mice once per 3 days. Ten days later, mice were killed and the ascites were measured (_n_=6, each group). *P<0.001. In the box and whisker plots, the box contains 50% of the data. Twenty five per cent of the data are greater than the top of the box and 25% of the data are less than the bottom of the box. The line in the box represents the median. (g) 3-MPA impaired the inhibitory effect of Dex on H22 hepatocarcinoma. BALB/c mice were inoculated with H22 cells into the right flank and treated with 2.5 μg g−1 Dex or 2.5 μg g−1 Dex+30 μg g−1 3-MPA. The growth of tumours was monitored (_n_=6, each group). (h,i) Prednisone does not influence the expression of PEPCK and G6Pase and tumour growth. H22 tumour cells were treated with 0, 0.1, 1 and 10 μM prednisone for 7 days. The expression of PEPCK and G6Pase was analysed by reverse transcriptase–PCR (h). Mice were inoculated with H22 cells and treated with 0, 1.25, 2.5 or 5 μg g−1 prednisone. The tumour growth was monitored (i). Data shown are representative of three independent experiments and error bars represent means±s.e.m., *P<0.05, **P<0.01 (analysis of variance (ANOVA)).
To confirm that the antitumour effect of Dex is dependent on the gluconeogenetic pathway, we first inoculated mice with G6Pase and PEPCK-overexpressing H22 tumour cells, and found that the overexpression of either PEPCK or G6Pase resulted in the inhibition of tumour growth (Supplementary Fig. S7). We further used small interfering RNA (siRNA) technology to knock down PEPCK in combination with Dex treatment in a peritoneal H22 tumour model. Tumour cells (1 × 10⁵ H22) were i.p. injected into mice, and 2 days later mice were treated with 2.5 μg g−1 Dex. At the same time, the chemically modified 2′-_O_-methyl, 5′-cholesterol siRNA against PEPCK and scrambled siRNA (10 nmol in 0.2 ml saline buffer) were also i.p. injected to the mice, respectively. Compared with the scrambled siRNA group, the knockdown of PEPCK significantly promoted tumour ascites formation (Fig. 8f). In addition, 3-mercaptopicolinic acid (3-MPA), a PEPCK-selective inhibitor28, was also studied and it was found that the intragastric administration of 3-MPA effectively counteracted the inhibitory effects of Dex on H22 tumour (Fig. 8g). To further verify Dex as a potential agent in the treatment of hepatocarcinoma, prednisone, a dehydrogenated inactive form of GCs, was additionally tested in H22 tumour cells in vitro and H22 tumour-bearing mice in vivo. Unlike Dex and its efficacy, prednisone did not show the upregulation of PEPCK and G6Pase (Fig. 8h), and an antitumour effect (Fig. 8i).
Dex attenuates dimethylnitrosamine-induced hepatocarcinogenesis in mice
Fifteen-day-old BALB/c mice were i.p. injected with dimethylnitrosamine (DMN) twice: 25 mg kg−1 DMN on the first week and 10 mg kg−1 on the third week. DMN-treated mice were treated with 0 or 2.5 μg g−1 Dex once per day on the third and fifth weeks, respectively. On the sixth week, mice were killed and their livers were analysed by haematoxylin and eosin staining. The result showed that DMN administration resulted in inflammatory infiltrates, increased local cytoplasmic volume, enlarged nuclear hyperchromasia and marked atypia; however, a relative normal liver histology was observed in the Dex group (Supplementary Fig. S8). In a parallel experiment, the above Dex-treated DMN mice were further treated with Dex on the 7th, 9th and 11th week. On the 12th week, mice were killed and their livers were analysed. Seventy-five per cent mice (_n_=8) with hepatocarcinoma was found in the DMN group, but only 12.5% mice (_n_=8) was found in the Dex group.
Dex affects tumour glycolysis by regulating LDHA and GPD1
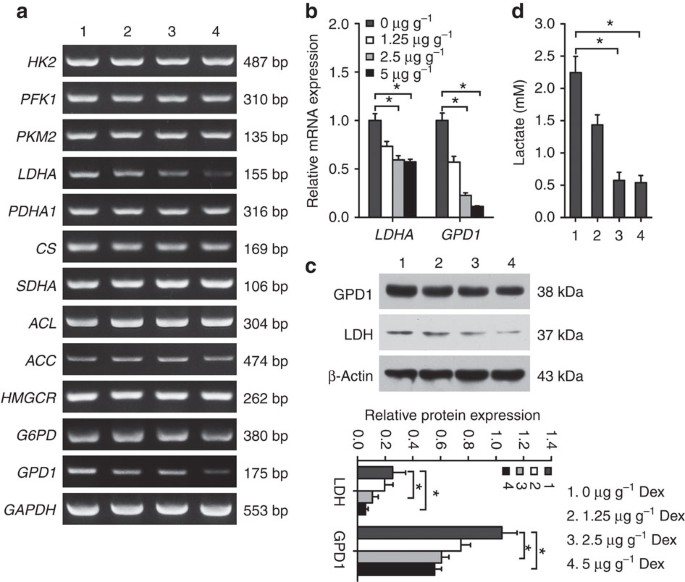
Finally, the molecular basis of Dex affecting the glucose metabolism of hepatocarcinoma was further investigated. We first measured the glucose metabolism by using positron emission tomography (PET) technology. Mice were s.c. injected with 3 × 10⁵ H22 cells. Four days later, the mice were treated with different concentrations of Dex once per day for 7 days. The glucose metabolism in mice was determined by 18F-fluoro-deoxyglucose (18F-FDG) PET. It was found that compared with the control, Dex treatment resulted in a decreased FDG PET signal in tumours (Supplementary Fig. S9), suggesting that Dex inhibits the use of glucose by hepatocarcinoma cells. A panel of metabolism-related genes in tumour tissues was analysed by reverse transcriptase–PCR, including hexokinase 2, phosphofructokinase 1, pyruvate kinase M2 and lactate dehydrogenase A (LDHA) for the glycolysis pathway; pyruvate dehydrogenase α1, citrate synthase and succinate dehydrogenase for tricarboxylic acid cycle; ATP citrate lyase, acetyl-CoA carboxylase and 3-hydroxy-3-methylglutaryl-CoA reductase for fatty acid and cholesterol biosynthesis; glucose-6-phosphate dehydrogenase for pentose–phosphate pathway; and glycerol-3-phosphate dehydrogenase 1 (GPD1) for glyceroneogenesis. Most genes tested did not show differential expression; however, LDHA and GPD1 were downregulated after Dex treatment (Fig. 9a–d). To clarify whether the effects of Dex on glycolysis is mediated through a GR-dependent pathway, we constructed GRα knockdown H22 cells (Supplementary Fig. S10) and found that the knockdown of GRα resulted in Dex losing its effect on the expression of PEPCK, FBP1, G6Pase, or LDHA and GPD1, as well as the alteration of intracellular glucose levels in H22 tumour cells (Supplementary Fig. S10). These data suggest that Dex employs GR-dependent pathway to regulate the glucose metabolism of hepatocarcinoma cells.
Figure 9: The expression of LDHA and GPD1 is downregulated by Dex in vivo.
Mice (_n_=6) were inoculated with H22 tumour cells and treated with 0, 1.25, 2.5 or 5 μg g−1 Dex. A panel of metabolic genes in tumour tissues was analysed by reverse transcriptase–PCR (a). LDHA and GPD1 in tumour tissues were analysed by real-time PCR (b) and western blot (c). The tumour tissues were also used to analyse the levels of lactate (d). Data shown are representative of three independent experiments and error bars represent means±s.e.m., *P<0.05 (analysis of variance).
Discussion
A distinctive feature of hepatocarcinoma relative to other tumour types may be its unique metabolism, considering the inherent metabolic functions of hepatocytes. Understanding those unusual metabolic pathways may open doors to new therapeutic strategies against hepatocarcinoma. This study shows that the loss of gluconeogenesis is an important event for the altered metabolism in hepatocarcinoma, which may be partially due to alteration in the two enzymes, 11β-HSD1 and 11β-HSD2.
11β-HSD1 is an NADPH-dependent enzyme highly expressed in key metabolic tissues, including the liver, adipose tissue and the central nervous system, where it reduces inactive forms of GCs to active ones, subsequently leading to activating the receptors involved24,25,26. By contrast, 11β-HSD2 is an NAD+-dependent enzyme expressed in aldosterone-selective epithelial tissues such as the kidney, colon and sweat glands, where it inactivates GCs24,25,26. In this study, the downregulation of 11β-HSD1 and upregulation of 11β-HSD2 were both found to be significant in hepatocarcinoma. Of the 58 patients with hepatocarcinoma that were analysed, there was a very clear inverse association between 11β-HSD1 and 11β-HSD2, which can serve as markers for the prognosis of the cancer. This inverse relationship between 11β-HSD1 and 11β-HSD2 in malignant hepatocytes implicates that during the transformation, hepatic cells choose 11β-HSD1 and 11β-HSD2 to remodel or reconstruct new metabolic networks. In line with these data, public databases, such as Oncomine29 and Oncogenomic Database30, show the significant decrease of 11β-HSD1 messenger RNA expression in hepatocarcinoma31,32,33. However, a key issue is the mechanism through which transformed hepatocytes target 11β-HSD1 and 11β-HSD2 to favour the malignancy. Although non-coding RNAs such as microRNAs are important in regulation, they usually exert their effect at the post-transcriptional level34. This is not inconsistent with the present results in which altered transcripts were found. Recent studies highlight the critical role of epigenetic modification of DNA and histones, such as methylation and acetylation, in the regulation of gene expression35,36. We indeed found that the promoter region of 11β-HSD1 was highly methylated but no methylation of 11β-HSD2 was found in hepatocarcinoma. Besides the epigenetic mechanism, extrinsic signals, oncogenes and transcription factors may also alter the expression of 11β-HSD1 and 11β-HSD2. The transcription factor CCAAT/enhancer-binding protein C/EBP family is a key mediator of metabolic and inflammatory signalling. It has been reported that dehydroepiandrosterone caused the upregulation of C/EBP-β but did not affect C/EBP-α, whereas C/EBP-α is a strong activator of 11β-HSD1, and C/EBP-β acts in an opposite way and preferentially stimulates 11β-HSD2 expression37. Notably, dehydroepiandrosterone-mediated stimulation of 11β-HSD2 involves the activation of phosphoinositide 3-kinase (PI3K)/Akt pathway. Given that the PI3K/Akt pathway is usually activated in human cancers, including hepatocarcinoma, it is possible to speculate that extrinsic signals and/or oncogenes may activate the PI3K/Akt pathway, leading to the upregulation of C/EBP-β and consequent 11β-HSD2 expression. However, a deeper study is required to fully elucidate the underlying molecular basis of this phenomenon.
GCs, possibly the most important class of hormones in our body, affect perhaps around 5% of the genome38. One of the purposes of GCs is to induce glucose synthesis via the gluconeogenesis pathway, which may lead to a common side effect of high blood glucose levels in treated patients. PEPCK and G6Pase are two key enzymes that respond to GC signalling during gluconeogenesis. PEPCK catalyses oxaloacetate to phosphoenolpyruvate, whereas G6Pase hydrolyses G6P to glucose. In this study, the expression of PEPCK and G6Pase was found to be highly downregulated in both murine and human hepatocarcinoma. These data are consistent with a previous report39, together suggesting impaired or even loss of gluconeogenesis in hepatocarcinoma. However, the downregulation of PEPCK and G6Pase in hepatocarcinoma appears to be regulated by abnormal 11β-HSD1 and 11β-HSD2, as the forced overexpression of 11β-HSD1 or knockdown of 11β-HSD2 can independently restore the expression of PEPCK and G6Pase in hepatocarcinoma (Fig. 2). Therefore, our findings suggest that the downregulation of 11β-HSD1 and upregulation of 11β-HSD2 might generate a profound effect on gluconeogenesis in malignant hepatocytes via regulating GC activities. Recently, Lavery et al.40 found that hepatic PEPCK and G6Pase were expressed in the liver-specific 11β-HSD1 knockout mice, implicating that the loss of 11β-HSD1 does not have a profound effect on gluconeogenesis. However, this discrepancy might be attributable to a compensatory production of corticosterone by other tissues and a downregulation of 11β-HSD2 by the liver. In fact, the authors detected around 40% cortisol levels in knockout mice relative to control mice after cortisone challenge40. In addition, Dex has been reported to render non-haematological cancer cells more resistant to anti-tumour drugs41,42,43,44. However, clinical evidence for this drug resistance induction remains unclear. In fact, Dex in combination with chemotherapeutic drugs has been trialed in the clinic through hepatic arterial infusion. The results show reduced toxicity while maintaining an excellent response rate and survival45,46. In these multidrug clinical trials, Dex possibly enhances the resistance of tumour cells to one or two drugs, but increases the sensitivity of tumour cells to other drugs.
Given the intrinsic inactivation of GCs in hepatocarcinoma, we wondered whether extrinsic means could rescue this defect. In this study, we found that Dex effectively induced gluoneogenesis in malignant hepatocytes both in vitro and in vivo by upregulating PEPCK and G6Pase expression. To dissect the influence of restored gluoneogenesis on metabolism of malignant hepatocytes, we additionally analysed a large number of genes involved in metabolic pathways from glycolysis to tricarboxylic acid cycle, to fatty acid and cholesterol biosynthesis, and to pentose–phosphate pathway and glyceroneogenesis. Two candidate genes, Ldha and glycerol-3-phosphate dehydrogenase (GPDH), were found to be downregulated after Dex treatment. LDHA may catalyse the conversion of pyruvate and NADH to lactate and NAD+ (ref. 47), thus facilitating the carbon flow for glycolysis, as NAD+ is necessary for glyceraldehyde 3-phosphate dehydrogenase (GAPDH) to catalyse glyceraldehyde 3-phosphate to 1, 3-bisphosphoglycerate48. On the other hand, GPDH reduces dihydroxyacetone phosphate into glycerol 3-phosphate and allows the prompt dephosphorylation of glycerol 3-phosphate into glycerol, thus having a major role in glyceroneogenesis49. Importantly, the products glycerol 3-phosphate and glycerol act as a backbone for lipid biosynthesis50. Therefore, recovering the sensitivity of malignant hepatocytes to GCs not only results in gluconeogenesis but also impairs the glycolytic pathway and lipid biosynthesis. The latter two may be the direct result of recovered gluconeogenesis, but they may also be a parallel event. There has been evidence that the transcriptional co-activator, PGC1α, is a major regulator of PEPCK and G6Pase, and consequently gluconeogenesis51. Besides that, forkhead transcription factor FoxO1 also has a critical role in regulating glucose metabolism. Both PGC1α and FoxO1 can be induced by Dex52. However, this study did not find the regulation of PGC1α by Dex. Thus, although the molecular regulation of Ldha and GPDH is not identified in the present study, whether their expression are regulated by PGC1α and FoxO1 is worthy of further study.
Potentially important clinical values can be drawn from the present study, not only in prognosis but also in treatment. Dex, the synthetic active form of GCs, is much more potent than synthetic prednisone and endogenous cortisol. This has been explained by the 11-ketodexamethasone as a human GR agonist53. Dex is currently used to treat many inflammatory and autoimmune disorders, as well as haematological malignancies. In some patients with hepatocellular carcinoma, Dex is used to counteract certain side effects of chemotherapy or ameliorate the patients’ symptoms such as anorexia, nausea and anxiety. This study goes further in considering the potential applications of Dex in hepatocellular carcinoma and focuses on direct tumour attack rather than the use of Dex as a supplementary drug. In fact, the present study has shown that Dex treatment is efficacious against hepatocarcinoma, which may be mediated through the gluconeogenesis pathway, as PEPCK inhibitor may abrogate this effect. However, the administration of Dex may induce stomach and duodenum ulceration in hepatocarcinoma patients54. Recently, we demonstrated that tumour cell-derived microparticles can deliver drugs to tumour cells in vivo without side effect55. This new delivery technology may be helpful in overcoming the limitations of Dex in hepatocarcinoma patients. Currently, the delivery of high-dose Dex by microparticles to treat murine hepatocarcinoma is under study.
In summary, the data in this study clearly show that the loss of gluconeogenesis in hepatocarcinoma, by virtue of the downregulation of 11β-HSD1 and upregulation of 11β-HSD2, discloses a fundamental metabolic change, leading to potential prognostic markers and treatment strategies against hepatocarcinoma.
Methods
Mice and cell lines
Female BALB/c and C57BL/6 mice, 6- to 8-week-old, were purchased from the Center of Medical Experimental Animals of Hubei Province (Wuhan, China) for studies approved by the Animal Care and Use Committee of Tongji Medical College. Murine hepatocarcinoma H22, melanoma B16, lymphoma EL4 and breast 4T1 cell lines were purchased from the China Center for Type Culture Collection (Wuhan, China) and cultured according to the guidelines given.
Patient samples
This study included 58 patients’ samples for immunohistochemical analysis and ten fresh hepatocarcinoma samples for DNA methylation analysis. The diagnosis of hepatocarcinoma was confirmed with histopathological method in all cases. The detailed information of 58 patients was described in Supplementary Table S2. The hepatocarcinoma tissues and their peripheral normal tissues were obtained from diagnosed patients after informed consent and with approval of the Clinical Research Ethics Board of the Tongji Medical College.
Recombinant plasmids
Murine 11β-HSD1 complementary DNA was inserted into eukaryotic expressing vector pIRES2-DsRed-Express2 (Clontech, USA). Murine PEPCK and G6Pase cDNAs were inserted into eukaryotic expressing vector pcDNA3.1, respectively. The recombinant vector and mock plasmid were transfected into H22 hepatocarcinoma cells using Lipofectamine 2000 (Invitrogen, Carlsbad, CA). The 11β-HSD1, PEPCK and G6Pase-overexpressing subclones were selected respectively with 320 μg ml−1 G418.
In parallel, chemically synthesized short hairpin RNA oligonucleotides targeting 11β-HSD2, (5′-TAGCACTGCTTATGGACAC-3′), GRα (5′-GGAAGGTCTGAAGAGCCAAGA-3′) or negative control short hairpin RNA oligonucleotides were annealed and ligated into pGPU6/GFP/Neo plasmid (Genepharma, Shanghai). The plasmids were transfected into H22 cells with Lipofectamine 2000 and stably expressing cell line was selected with G418.
Tumour model
H22 or B16 cells (3 × 10⁵) were s.c. injected into the right flank of BALB/c or C57BL/6 mice to generate individual tumours. In some cases, 10 μl of a suspension of 1 × 10⁷ H22 cells in PBS were directly injected to the liver to generate the orthotopic liver cancer.
For the treatment, 4 days after tumour cell inoculation mice were i.p. injected with 0, 1.25, 2.5 or 5 μg g−1 Dex. Subcutaneous tumour growth was monitored by measuring the length (L) and width (W) of tumours using vernier calipers, and the volume (V) of the tumour was calculated by formula _V_=(L × _W_2)/2. For orthotopic liver cancer, mice were killed and hepatocarcinomas were separated and weighed.
Primary hepatocyte isolation
Mouse primary hepatocytes were isolated by in-situ collagenase perfusion of the liver and further purified by a Percoll gradient centrifugation56. Hepatocytes were resuspended and plated onto collagen-coated plates at 3 × 10⁵ cells per well in a six-well plate in William E medium with 5% fetal bovine serum. The non-adhering cells were removed by replacing the medium after 2 h incubation.
To isolate mouse hepatocarcinoma cells, tumour tissues were cut into small pieces and digested in 10 ml RPMI-1640 medium containing 500 μg ml−1 hyaluronidase III, 320 μg ml−1 type V collagenase and 5 U ml−1 DNase I for 1.5 h at 37 °C. The solution was filtered with 200-mesh filter after grinding with frosted slides. Single cells were suspended in 10 ml cold Hank’s balanced salt solution with 0.5% fetal bovine serum and maintained on ice for 5 min. After centrifugation of 2 min at 500 r.p.m., the spun tumour cells were collected.
Measurement of cellular and tissue glucose
H22 cells or hepatocarcinoma tissues were collected and washed three times with PBS. After lysis, the lysate was centrifugated at 14,000 g for 15 min at 4 °C. The supernatant was used for the glucose measurement by glucose assay kit (GAGO-20, Sigma).
Lactate assay
To measure lactate in tumour tissue, H22 tumour-bearing mice were killed and the tumour tissues were grinded in ice. After centrifugation at 14,000_g_ for 15 min at 4 °C, lactate in the supernatant was measured by EnzyChrom lactate assay kit (BioAssay Systems).
Semi-quantitative PCR and real-time quantitative PCR
Total RNA extracted from tissues and cell lines with TRIzol reagent (Invitrogen) was used for semi-quantitative and real-time quantitative PCR. Total RNA (1 μg) was reverse-transcribed into cDNA using the Reverse Transcription System (Promega, USA). Real-time PCR was performed with a FastStart Universal SYBR Green Master Kit (Roche, USA) on an ABI 7900 system. mRNA levels was normalized to GAPDH. The primer sequences were as follows: mouse GAPDH, sense 5′-GTGGAGATTGTTGCCATCAACG-3′, antisense 5′-CAGTGGATGCAGGGATGATGTTCTG-3′; mouse PEPCK, sense 5′-AAGAGCAGAGAGACACAGTG-3′, antisense 5′-CAAGTTAGTCTTCCCACAGG-3′; mouse G6Pase, sense 5′-GCCTTCTATGTCCTCTTTCC-3′, antisense 5′-AGTTTCAGCCACAGCAATGC-3′; mouse 11β-HSD1, sense 5′-AACCACATCACTCAGACCTC-3′, antisense 5′-ACCCATCCAGAGCAAACTTG-3′; mouse 11β-HSD2, sense 5′-GAGGTGAACTTCTTTGGTGC-3′, antisense 5′-TGATGGCATCTACAACTGGG-3′; mouse Nr3c1 (GR), sense 5′-GTCAAGGTTTCTGCGTCTTC-3′, antisense 5′-AAGGTGCT TTGGTCTGTGG-3′; mouse hexokinase 2, sense 5′-TGGGTTTCACCTTCTCGTTC-3′, antisense 5′-TTCACCAGGATGAGTCTGAC-3′; mouse phosphofructokinase 1, sense 5′-TGGACTGGTCAAGGTGGTTC-3′, antisense 5′-CTGCTGCAGACTGCTTGATTC-3′; mouse pyruvate kinase M2, sense 5′-CGCCTGGACATTGACTCTG-3′, antisense 5′-GAAATTCAGCCGAGCCACATT-3′; mouse LDHA, sense 5′-TGTCTCCAGCAAAGACTACTGT-3′, antisense 5′-GACTGTACTTGACAATGTTGGGA-3′; mouse pyruvate dehydrogenase α1, sense 5′-AGGACGAAGAGGAGGTTGTG-3′, antisense 5′-TTTGTAGTAGTCCGTGCTGG-3′; mouse citrate synthase, sense 5′-AGGCTAGACTGGTCACACAAT-3′, antisense 5′-AGGACAGGTAAGGGTCTGAAAG-3′; mouse succinate dehydrogenase, sense 5′-GAACACTCCAAAAACAGACCTGC-3′, antisense 5′-TCCACCACTGGGTATTGAGTAG-3′; mouse ATP citrate lyase, sense 5′-CATCATTGGAGGCAGCATTG-3′, antisense, 5′-AAGGAGGAAGTTGGCAGTGT-3′; mouse ACACA, sense 5′-TGAGGAAGTTGGCTATCCAG-3′, antisense 5′-GCAGGAAGATTGACATCAGC-3′; mouse 3-hydroxy-3-methylglutaryl-CoA reductase, sense 5′-CTTCCAGTTCCAGAACCTAC-3′, antisense 5′-CAGGATTGCCATTCCACGAG-3′; mouse glucose-6-phosphate dehydrogenase, sense 5′-ATGTGGAGAATGAACGGTGG-3′, antisense 5′-CAGCAGTGGTGTGAAGATAC-3′; and mouse GPD1, sense 5′-ATGGCTGGCAAGAAAGTCTG-3′, antisense 5′-CGTGCTGAGTGTTGATGATCT-3′. The full gels are shown in Supplementary Fig. S11.
Western blot
Cell lysates or tissue homogenates and prestained molecular weight markers were separated by SDS–PAGE, followed by transfer onto nitrocellulose membranes. The membranes were blocked in TBST (Tris-buffered saline with 0.5% Triton X-100) containing 5% non-fat milk and probed with specific anti-PEPCK1 (1:200 dilution, Cayman Chemical), anti-G6Pase-α (1:500 dilution, Santa Cruz), anti-GRα (1:1,000 dilution, Cell Signaling Technology), anti-LDH (1:100,000 dilution, Abcam), anti-GPD1 (1:200 dilution, Santa Cruz), anti-11β-HSD1 (1:200 dilution, Cayman Chemical) or anti-11β-HSD2 antibody (1:200 dilution, Cayman Chemical) overnight at 4 °C. The membranes were washed three times and incubated with horseradish peroxidase-conjugated secondary antibodies. The immunoreactivity was visualized by enhanced chemiluminescence according to the manufacturer’s protocol (ECL kit, Thermo Scientific). The full blots are shown in Supplementary Fig. S11.
Immunohistochemistry
Tissues were fixed in 4% paraformaldehyde in 0.2 M phosphate buffer (pH 7.4) for 48 h, followed by embedding into paraffin sections (4 μm). The endogenous peroxidase activity was inactivated in a solution containing 3% hydrogen peroxide (H2O2) in methanol. Then, the sections were blocked for 2 h at room temperature with 1.5% blocking serum. Sections were incubated with anti-PEPCK (1:200, Cayman Chemical), anti-G6Pase (1: 400, Santa Cruz), anti-11β-HSD1 (1:200, Cayman Chemical) or anti-11β-HSD2 (1:200, Cayman Chemical) antibody overnight at 4 °C. Labelled horseradish peroxidase was applied for 30 min at room temperature, followed by application of diaminobenzidine solution until colour developed. Slides were counterstained with haematoxylin. Negative control slides were performed without primary antibody. The sums of integrated optical density, that is, the area sum of 11β-HSD1 and 11β-HSD2, were quantified by Image-Pro Plus software and the density mean was calculated by integrated optical density sum/area sum.
Methylation analysis of human 11β-HSD1 and 11β-HSD2 promoters
Genomic DNA was extracted from human hepatocarcinoma tissues and their peritumoural tissues with ZR Genomic DNA-Tissue MiniPrep (Zymo Research, Orange, CA). The extracted genomic DNAs were treated with the bisulphite reagent. Bisulphite-specific PCR primers (11β-HSD1, sense 5′-TTTTTTTTGAGGATTATTTTTTAATGAAT-3′, antisense 5′-TAACCAATTTCCCTATCAAAACAAC-3′; and 11β-HSD2, sense 5′-GTGAGTGG TATGTGTTTATTTGAG-3′, antisense 5′-TCGAAAAACCGCCTAACTACGAAC-3′) or unmethylated PCR primers (11β-HSD1, sense 5′-CTTTCTTTGAGGATTATTCCTTAATGAAT-3′, antisense 5′-TAGCCAATTTCCCTGTCAGAGCAGC-3′; and 11β-HSD2, sense 5′-GTGAGTGGCATGTGCTCACCTGAG-3′, antisense 5′-TCGAGGAGCCGCCTGGCTGCGGGC-3′) were designed using the MethPrimer programme for bisulphite-treated or originally genomic DNA amplification, respectively. The PCR products were sequenced to determine the methylation of CpG islands.
Measurement of plasma GC levels
After informed consent and approval by the Clinical Research Ethics Board of the Tongji Medical College, the peripheral blood were collected from normal donors, hepatocarcinoma patients and portal hypertension patients without hepatocarcinoma. The plasma was prepared for GC measurement by the EIA Kit (Cayman Chemical).
FDG–PET analysis
Tumour-bearing mice were injected 18F-FDG intravenously after 24 h fasting. After 20 min of 18F-FDG uptake, mice were anaesthetized with chloral hydrate and imaged for 10 min by a microPET scanner (Vista DR, GE Healthcare).
Construction of 11β-HSD1 Tet-Off H22 tumour cell line
Tet-responsive 11β-HSD1 expression constructs were made by cloning the cDNA of murine 11β-HSD1 into pPrP-tet (a gift from Professor Jianmin Zhang, Chinese Academy of Medical Sciences). 11β-HSD1 construct was then transfected into tTA-expressing H22 cells. Single colonies were obtained by limiting dilution with 320 μg ml−1 G418 selection.
H22 hepatocarcinoma ascites model
H22 tumour cells (1 × 10⁵ ) were i.p. injected to mice. Two days later, mice were treated with the i.p. injection of 2.5 μg g−1 Dex. Meanwhile, the chemically modified 2′-_O_-methyl, 5′-cholesterol PEPCK siRNA and scrambled siRNA (10 nmol in 0.2 ml saline buffer each) were also i.p. injected to the mice, respectively. Ten days later, mice were killed and the ascites were measured.
Cell proliferation and apoptosis assay
H22 cells were treated with 0, 0.1, 1 or 10 μM Dex for 7 days, then cells were stained with fluorescein isothiocyanate-conjugated Ki67 or with fluorescein isothiocyanate-conjugated Annexin V and propidium iodide for flow cytometric analysis. All the agents were purchased from BD Biosciences.
Statistical analysis
Results were expressed as mean values±s.e.m. and interpreted by repeated-measure analysis of variance. Differences were considered to be statistically significant when the _P_-value<0.05.
Additional information
How to cite this article: Ma, R. et al. Switch of glycolysis to gluconeogenesis by dexamethasone for treatment of hepatocarcinoma. Nat. Commun. 4:2508 doi: 10.1038/ncomms3508 (2013).
References
- Owen, O. E., Reichard, G. A. Jr., Patel, M. S. & Boden, G. Energy metabolism in feasting and fasting. Adv. Exp. Med. Biol. 111, 169–188 (1979).
Article CAS Google Scholar - Wolf, G. The effect of fasting and fructose and glucose infusion on gluconeogenesis and triose phosphate flux in rats in vivo. Nutr. Rev. 53, 299–301 (1995).
Article CAS Google Scholar - Rhee, J. et al. Regulation of hepatic fasting response by PPARgamma coactivator-1alpha (PGC-1): requirement for hepatocyte nuclear factor 4alpha in gluconeogenesis. Proc. Natl Acad. Sci. USA 100, 4012–4017 (2003).
Article CAS ADS Google Scholar - Hers, H. G. & Hue, L. Gluconeogenesis and related aspects of glycolysis. Annu. Rev. Biochem. 52, 617–653 (1983).
Article CAS Google Scholar - Pilkis, S. J., el-Maghrabi, M. R. & Claus, T. H. Hormonal regulation of hepatic gluconeogenesis and glycolysis. Annu. Rev. Biochem. 57, 755–783 (1988).
Article CAS Google Scholar - Lemaigre, F. P. & Rousseau, G. G. Transcriptional control of genes that regulate glycolysis and gluconeogenesis in adult liver. Biochem. J. 303, 1–14 (1994).
Article CAS Google Scholar - Stein, M. et al. Targeting tumor metabolism with 2-deoxyglucose in patients with castrate-resistant prostate cancer and advanced malignancies. Prostate 70, 1388–1394 (2010).
Article CAS Google Scholar - Birsoy, K., Sabatini, D. M. & Possemato, R. Untuning the tumor metabolic machine: Targeting cancer metabolism: a bedside lesson. Nat. Med. 18, 1022–1023 (2012).
Article CAS Google Scholar - Clendening, J. W. & Penn, L. Z. Targeting tumor cell metabolism with statins. Oncogene 31, 4967–4978 (2012).
Article CAS Google Scholar - Meijer, T. W., Kaanders, J. H., Span, P. N. & Bussink, J. Targeting hypoxia, HIF-1, and tumor glucose metabolism to improve radiotherapy efficacy. Clin. Cancer Res. 18, 5585–5594 (2012).
Article CAS Google Scholar - Gatenby, R. A. & Gillies, R. J. Why do cancers have high aerobic glycolysis? Nat. Rev. Cancer 4, 891–899 (2004).
Article CAS Google Scholar - Hanahan, D. & Weinberg, R. A. Hallmarks of cancer: the next generation. Cell 144, 646–674 (2011).
Article CAS Google Scholar - Koppenol, W. H., Bounds, P. L. & Dang, C. V. Otto Warburg’s contributions to current concepts of cancer metabolism. Nat. Rev. Cancer 11, 325–337 (2011).
Article CAS Google Scholar - Ward, P. S. & Thompson, C. B. Metabolic reprogramming: a cancer hallmark even Warburg did not anticipate. Cancer Cell 21, 297–308 (2012).
Article CAS Google Scholar - Vander Heiden, M. G., Cantley, L. C. & Thompson, C. B. Understanding the Warburg effect: the metabolic requirements of cell proliferation. Science 324, 1029–1033 (2009).
Article CAS ADS Google Scholar - Levine, A. J. & Puzio-Kuter, A. M. The control of the metabolic switch in cancers by oncogenes and tumor suppressor genes. Science 330, 1340–1344 (2010).
Article CAS ADS Google Scholar - Landor, S. K. et al. Hypo- and hyperactivated Notch signaling induce a glycolytic switch through distinct mechanisms. Proc. Natl Acad. Sci. USA 108, 18814–18819 (2011).
Article CAS ADS Google Scholar - Dang, C. V. Links between metabolism and cancer. Genes Dev. 26, 877–890 (2012).
Article CAS Google Scholar - Cairns, R. A., Harris, I., McCracken, S. & Mak, T. W. Cancer cell metabolism. Cold Spring Harb. Symp. Quant. Biol. 76, 299–311 (2011).
Article CAS Google Scholar - Liu, X. et al. Warburg effect revisited: an epigenetic link between glycolysis and gastric carcinogenesis. Oncogene 29, 442–450 (2010).
Article CAS Google Scholar - Chen, M. et al. Promoter hypermethylation mediated downregulation of FBP1 in human hepatocellular carcinoma and colon cancer. PLoS One 6, e25564 (2011).
Article CAS ADS Google Scholar - Feliu, J. E., Hue, L. & Hers, H. G. Hormonal control of pyruvate kinase activity and of gluconeogenesis in isolated hepatocytes. Proc. Natl Acad. Sci. USA 73, 2762–2766 (1976).
Article CAS ADS Google Scholar - Yudt, M. R. & Cidlowski, J. A. The glucocorticoid receptor: coding a diversity of proteins and responses through a single gene. Mol. Endocrinol. 16, 1719–1726 (2002).
Article CAS Google Scholar - Lloyd-MacGilp, S. A. et al. 11beta-hydroxysteroid dehydrogenase and corticosteroid action in lyon hypertensive rats. Hypertension 34, 1123–1128 (1999).
Article CAS Google Scholar - Seckl, J. R. 11beta-hydroxysteroid dehydrogenases: changing glucocorticoid action. Curr. Opin. Pharmacol. 4, 597–602 (2004).
Article CAS Google Scholar - Tomlinson, J. W. et al. 11beta-hydroxysteroid dehydrogenase type 1: a tissue-specific regulator of glucocorticoid response. Endocr. Rev. 25, 831–866 (2004).
Article CAS Google Scholar - Kim, Y. D. et al. Metformin inhibits hepatic gluconeogenesis through AMP-activated protein kinase-dependent regulation of the orphan nuclear receptor SHP. Diabetes 57, 306–314 (2008).
Article CAS Google Scholar - Yamauchi, T. et al. Targeted disruption of AdipoR1 and AdipoR2 causes abrogation of adiponectin binding and metabolic actions. Nat. Med. 13, 332–339 (2007).
Article CAS Google Scholar - Rhodes, D. R. et al. ONCOMINE: a cancer microarray database and integrated data-mining platform. Neoplasia 6, 1–6 (2004).
Article CAS Google Scholar - Su, W. H. et al. OncoDB.HCC: an integrated oncogenomic database of hepatocellular carcinoma revealed aberrant cancer target genes and loci. Nucleic Acids Res. 35, D727–D731 (2007).
Article CAS Google Scholar - Xu, X. R. et al. Insight into hepatocellular carcinogenesis at transcriptome level by comparing gene expression profiles of hepatocellular carcinoma with those of corresponding noncancerous liver. Proc. Natl Acad. Sci. USA 98, 15089–15094 (2001).
Article CAS ADS Google Scholar - Chen, X. et al. Gene expression patterns in human liver cancers. Mol. Biol. Cell 13, 1929–1939 (2002).
Article CAS Google Scholar - Roessler, S. et al. Integrative genomic identification of genes on 8p associated with hepatocellular carcinoma progression and patient survival. Gastroenterology 142, 957–966 (2012).
Article CAS Google Scholar - Esquela-Kerscher, A. & Slack, F. J. Oncomirs—microRNAs with a role in cancer. Nat. Rev. Cancer 6, 259–269 (2006).
Article CAS Google Scholar - Baylin, S. B. & Jones, P. A. A decade of exploring the cancer epigenome—biological and translational implications. Nat. Rev. Cancer 11, 726–734 (2011).
Article CAS Google Scholar - Dawson, M. A. & Kouzarides, T. Cancer epigenetics: from mechanism to therapy. Cell 150, 12–27 (2012).
Article CAS Google Scholar - Balazs, Z., Schweizer, R. A., Frey, F. J., Rohner-Jeanrenaud, F. & Odermatt, A. DHEA induces 11β-HSD2 by acting on CCAAT/enhancer-binding proteins. J. Am. Soc. Nephrol. 19, 92–101 (2008).
Article CAS Google Scholar - Wyrwoll, C. S., Holmes, M. C. & Seckl, J. R. 11beta-hydroxysteroid dehydrogenases and the brain: from zero to hero, a decade of progress. Front. Neuroendocrinol. 32, 265–286 (2011).
Article CAS Google Scholar - Wang, B., Hsu, S. H., Frankel, W., Ghoshal, K. & Jacob, S. T. Stat3-mediated activation of microRNA-23a suppresses gluconeogenesis in hepatocellular carcinoma by down-regulating glucose-6-phosphatase and peroxisome proliferator-activated receptor gamma, coactivator 1 alpha. Hepatology 56, 186–197 (2012).
Article CAS Google Scholar - Lavery, G. G. et al. Lack of significant metabolic abnormalities in mice with liver-specific disruption of 11beta-hydroxysteroid dehydrogenase type 1. Endocrinology 153, 3236–3248 (2012).
Article CAS Google Scholar - Rutz, H. P. Effects of corticosteroid use on treatment of solid tumours. Lancet 360, 1969–1970 (2002).
Article CAS Google Scholar - Herr, I. & Pfitzenmaier, J. Glucocorticoid use in prostate cancer and other solid tumours: implications for effectiveness of cytotoxic treatment and metastases. Lancet Oncol. 7, 425–430 (2006).
Article CAS Google Scholar - Chen, Y. X. et al. Dexamethasone enhances cell resistance to chemotherapy by increasing adhesion to extracellular matrix in human ovarian cancer cells. Endocr. Relat. Cancer 17, 39–50 (2010).
Article CAS Google Scholar - Ge, H. et al. Dexamethasone reduces sensitivity to cisplatin by blunting p53-dependent cellular senescence in non-small cell lung cancer. PLoS One 7, e51821 (2012).
Article CAS ADS Google Scholar - Kemeny, N. et al. Phase II study of hepatic arterial floxuridine, leucovorin, and dexamethasone for unresectable liver metastases from colorectal carcinoma. J. Clin. Oncol. 12, 2288–2295 (1994).
Article CAS Google Scholar - Kemeny, N. et al. Phase I trial of adjuvant hepatic arterial infusion (HAI) with floxuridine (FUDR) and dexamethasone plus systemic oxaliplatin, 5-fluorouracil and leucovorin in patients with resected liver metastases from colorectal cancer. Ann. Oncol. 20, 1236–1241 (2009).
Article CAS Google Scholar - Le, A. et al. Inhibition of lactate dehydrogenase A induces oxidative stress and inhibits tumor progression. Proc. Natl Acad. Sci. USA 107, 2037–2042 (2010).
Article CAS ADS Google Scholar - Ying, W. NAD+/NADH and NADP+/NADPH in cellular functions and cell death: regulation and biological consequences. Antioxid. Redox Signal. 10, 179–206 (2008).
Article CAS Google Scholar - Beale, E. G., Hammer, R. E., Antoine, B. & Forest, C. Glyceroneogenesis comes of age. FASEB J. 16, 1695–1696 (2002).
Article CAS Google Scholar - Reshef, L. et al. Glyceroneogenesis and the triglyceride/fatty acid cycle. J. Biol. Chem. 278, 30413–30416 (2003).
Article CAS Google Scholar - Yoon, J. C. et al. Control of hepatic gluconeogenesis through the transcriptional coactivator PGC-1. Nature 413, 131–138 (2001).
Article CAS ADS Google Scholar - Arumugam, R. et al. The interplay of prolactin and the glucocorticoids in the regulation of beta-cell gene expression, fatty acid oxidation, and glucose-stimulated insulin secretion: implications for carbohydrate metabolism in pregnancy. Endocrinology 149, 5401–5414 (2008).
Article CAS Google Scholar - Rebuffat, A. G. et al. The 11-ketosteroid 11-ketodexamethasone is a glucocorticoid receptor agonist. Mol. Cell. Endocrinol. 214, 27–37 (2004).
Article CAS Google Scholar - Ottonello, G. A. & Primavera, A. Gastrointestinal complication of high-dose corticosteroid therapy in acute cerebrovascular patients. Stroke 10, 208–210 (1979).
Article CAS Google Scholar - Tang, K. et al. Delivery of chemotherapeutic drugs in tumour cell-derived microparticles. Nat. Commun. 3, 1282 (2012).
Article Google Scholar - Lee, P., Peng, H., Gelbart, T. & Beutler, E. The IL-6- and lipopolysaccharide-induced transcription of hepcidin in HFE-, transferrin receptor 2-, and beta 2-microglobulin-deficient hepatocytes. Proc. Natl Acad. Sci. USA 101, 9263–9265 (2004).
Article CAS ADS Google Scholar
Acknowledgements
We thank Professors Yonghong Wan (McMaster University) and Ning Wang (University of Illinois at Urbana–Champaign) for helpful discussion and assistance in editing this article. We acknowledge funding from the National Basic Research Program of China (2012CB932500), National Science Fund for Distinguished Young Scholars of China (81225021) and Soundny (Sheng-Qi-An) Biotech (Wuhan, China).
Author information
Author notes
- Ruihua Ma, Wanguang Zhang and Ke Tang: These authors contributed equally to this work
Authors and Affiliations
- Department of Biochemistry and Molecular Biology, Tongji Medical College, Huazhong University of Science and Technology, Wuhan, 430030, China
Ruihua Ma, Huafeng Zhang, Yi Zhang, Dapeng Li, Yong Li, Pingwei Xu, Shunqun Luo, Wenqian Cai, Tiantian Ji, Foad Katirai & Bo Huang - Department of Surgery of Tongji Hospital, Tongji Medical College, Huazhong University of Science and Technology, Wuhan, 430030, China
Wanguang Zhang - Department of Pathophysiology, Tongji Medical College, Huazhong University of Science and Technology, Wuhan, 430030, China
Ke Tang & Duyun Ye - National Key Laboratory of Medical Molecular Biology, Chinese Academy of Medical Sciences, Beijing, 100730, China
Bo Huang
Authors
- Ruihua Ma
You can also search for this author inPubMed Google Scholar - Wanguang Zhang
You can also search for this author inPubMed Google Scholar - Ke Tang
You can also search for this author inPubMed Google Scholar - Huafeng Zhang
You can also search for this author inPubMed Google Scholar - Yi Zhang
You can also search for this author inPubMed Google Scholar - Dapeng Li
You can also search for this author inPubMed Google Scholar - Yong Li
You can also search for this author inPubMed Google Scholar - Pingwei Xu
You can also search for this author inPubMed Google Scholar - Shunqun Luo
You can also search for this author inPubMed Google Scholar - Wenqian Cai
You can also search for this author inPubMed Google Scholar - Tiantian Ji
You can also search for this author inPubMed Google Scholar - Foad Katirai
You can also search for this author inPubMed Google Scholar - Duyun Ye
You can also search for this author inPubMed Google Scholar - Bo Huang
You can also search for this author inPubMed Google Scholar
Contributions
B.H. conceived the project. R.M., W.Z., H.Z., Y.Z., D.L., K.T., Y.L., S.L., P.X. and W.C. performed the experiments. F. K., D.Y. and B.H. analysed the results. R.M. and B.H. wrote the manuscript.
Corresponding author
Correspondence toBo Huang.
Ethics declarations
Competing interests
B. Huang was supported by Soundny (Sheng-Qi-An) Biotech. The remaining authors declare no competing financial interests.
Supplementary information
Rights and permissions
About this article
Cite this article
Ma, R., Zhang, W., Tang, K. et al. Switch of glycolysis to gluconeogenesis by dexamethasone for treatment of hepatocarcinoma.Nat Commun 4, 2508 (2013). https://doi.org/10.1038/ncomms3508
- Received: 16 June 2013
- Accepted: 27 August 2013
- Published: 22 October 2013
- DOI: https://doi.org/10.1038/ncomms3508
