Genome-wide identification of microRNA expression quantitative trait loci (original) (raw)
Introduction
MicroRNAs (miRNAs), a class of small noncoding RNAs, serve as key post-transcriptional regulators of gene expression and mRNA translation1,2. miRNAs are increasingly recognized as mediators in a variety of biological processes including cardiovascular development and disorders3,4. Highly specific miRNA expression patterns have been reported in association with heart failure5,6, myocardial infarction7 and cancer8. However, the influence of genetic variation on miRNA expression and function still remains unclear.
Recently, many genome-wide expression quantitative trait locus (eQTL) mapping studies have revealed common genetic loci associated with mRNA expression levels of many genes9,10,11,12. These eQTL analyses have demonstrated that transcript levels of many mRNAs behave as heritable quantitative traits. In contrast to more extensive investigations of mRNA eQTLs in multiple tissues13 such as blood9, brain10, fat11 and liver12, there are relatively few studies of miRNA eQTLs (miR-eQTLs) and those that have been published to date are based on modest sample sizes (n<200)14,15,16,17,18. These studies have identified relatively few _cis_-miR-eQTLs; uncertainty persists regarding the number of miR-eQTLs in humans and their relations to regulatory elements in the human genome.
We conduct a genome-wide miR-eQTL study by utilizing genome-wide genotypes and miRNA expression profiling of whole blood derived RNA from 5,239 Framingham Heart Study (FHS) participants. We analyze the associations of ~10 million 1000 Genomes Project19 imputed single nucleotide polymorphisms (SNPs) (at minor allele frequency (MAF) >0.01 and imputation quality ratio >0.1) with whole blood-derived miRNA expression levels of 280 mature miRNAs expressed in >200 individuals, representing 11% of all discovered human miRNAs to date (2,576 mature miRNAs have been reported in miRbase v20: www.mirbase.org). We calculate both cis- and _trans-_miR-eQTLs genome wide, and identify _cis_-miR-eQTLs with concordant effects in two pedigree independent study groups. By cross-linking _cis_-miR-eQTLs SNPs with regulatory SNPs annotated by the ENCODE project20 and with complex trait-associated SNPs identified in prior genome-wide association studies (GWAS)21,22, and by linking _cis_-miR-eQTL miRNAs with differentially expressed miRNAs for complex traits, we sought to dissect the genetic regulation of miRNA expression and explore the extent to which _cis_-miR-eQTLs may affect interindividual phenotype variability.
Results
Heritability of global miRNA expression in peripheral blood
The demographic and clinical characteristics of the 5,239 FHS participants included in our analysis are shown in Supplementary Data 1. The pedigree structure formed by these participants is shown in Supplementary Data 2. We detected 280 mature miRNAs that were expressed in >200 participants (these miRNAs were used for identification of miR-eQTLs and unless specifically stated, miRNAs mentioned in the results and discussion refers to mature miRNAs), of these 247 miRNAs were expressed in >1,000 participants (Supplementary Fig. 1). The distribution of narrow-sense heritability of miRNA expression for the 247 miRNAs expressed in >1,000 participants is shown in Supplementary Fig. 2, with an average heritability estimate ( ) of 0.11; 133 miRNAs (54%) had
  and 9 miRNAs (miR-100-5p, miR-668, miR-133a, miR-127-3p, miR-409-3p, miR-20a-3p, miR-941, miR-191-3p and miR-1303) had
  (details in Supplementary Data 3).
Cell type effects and reproducibility of miR-eQTLs
To evaluate whether blood cell type proportions significantly influence miR-eQTLs, we compared miR-eQTLs identified in 2,138 FHS third generation cohort participants (in whom differential cell counts and proportion data were available) with and without adjustment for measured blood cell counts and cell type proportions (see Methods). Cell types did not appreciably influence miR-eQTLs (Supplementary Fig. 3), however, we cannot exclude the possibility of small cell type effects. In the subsequent sections, we focus on miR-eQTLs from analyses that were unadjusted for cell counts of 5,239 individuals (Supplementary Data 4). The miR-eQTLs from the model that adjusted for imputed cell counts in the larger set of 5,024 participants are provided in Supplementary Data 5.
To evaluate the reproducibility of detected miR-eQTLs, we split our overall sample set 1:1 into two sets by pedigrees creating separate discovery and replication sets, and identified cis- and _trans-_miR-eQTLs in each set. At discovery false discovery rates (FDRs) of <0.1, <0.05 and <0.01, the replication rates for _cis_-miR-eQTLs were 53%, 56% and 68% respectively, at a replication FDR<0.1, and 100% showed allele-specific directional effect concordance between the discovery and replication sets (Fig. 1a,b). In contrast, no _trans_-miR-eQTLs replicated (at FDR<0.1), although 91% of _trans_-miR-eQTLs showed allele-specific directional effect concordance in the discovery and replication sets (Supplementary Fig. 4). Therefore, in the subsequent sections, we mainly report _cis_-miR-eQTLs identified in the overall FHS set (unadjusted for cell counts).
Figure 1: Genome-wide identification of _cis_-miR-eQTLs.
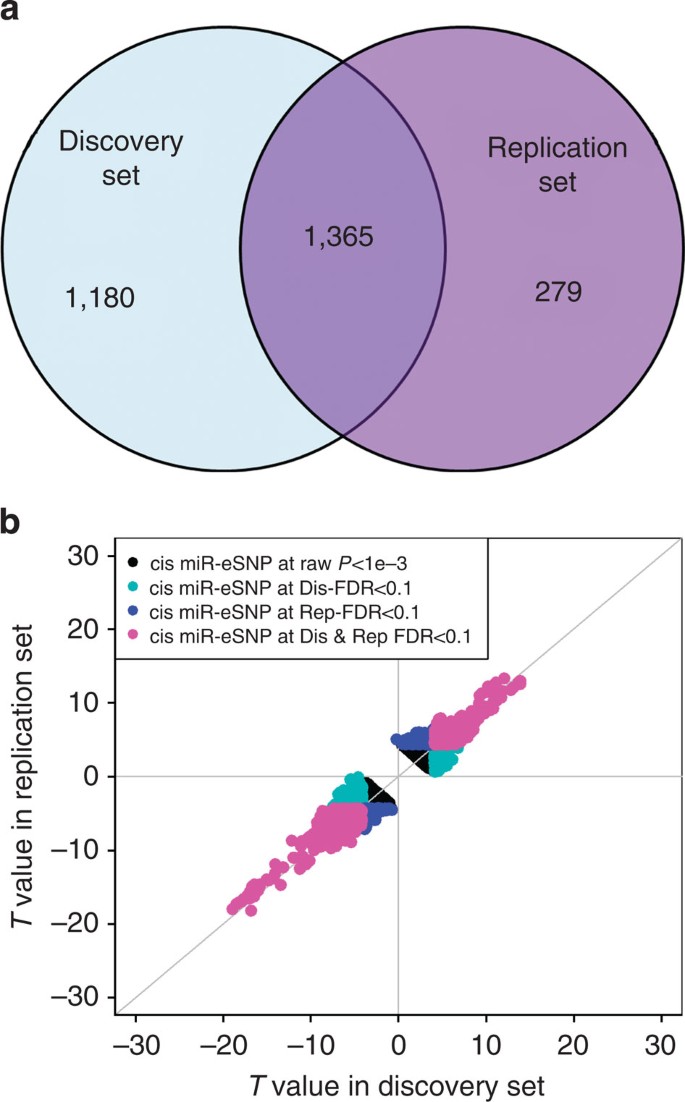
(a) Venn diagram of _cis_-miR-eQTLs identified in pedigree independent discovery (_n_=2,671) and replication sets (_n_=2,658). The number indicated _cis_-miR-eQTLs identified in discovery, replication or both at FDR<0.1. (b) T values of _cis_-miR-eQTLs between discovery and replication groups.
Genome-wide identification of miR-eQTLs
At FDR<0.1 (corresponding P value threshold is 6.6 × 10⁻⁵), we identified 5,269 _cis-_miR-eQTLs for 76 miRNAs (27% of interrogated expressed miRNAs) (Fig. 2). These _cis-_miR-eQTLs were further pruned by removing redundant _cis-_miR-eQTLs with high linkage disequilibrium (LD). At a series of LD r 2 thresholds, that is, r _2_=0.2, 0.5, 0.7, 0.9 and 1, there were 283, 572, 982, 1,602 and 2,727 _cis-_miR-eQTLs retained. We further narrowed down the list to 52 peak _cis_-miR-eQTLs representing the single top _cis_-miR-eQTL for each miRNA or miRNA cluster shown in Supplementary Data 6. Table 1 shows 16 of the 52 peak _cis_-miR-eQTLs with GWAS SNPs in the NHGRI GWAS Catalogue and the NHLBI GRASP data set21,22. A miRNA cluster is defined as a group of miRNAs located within 10 kb in the same chromosome (using the criteria described in www.mirbase.org). miRNAs with higher heritability estimates were more likely to have _cis_-miR-eQTLs. All of the nine miRNAs with  were found to have _cis_-miR-eQTLs. The top _cis_-miR-eQTLs tended to explain a greater proportion of the variance in the respective miRNA transcript as a function of increasing
  (Fig. 3). When the heritability of miRNA transcripts
  increased from (0 to 0.1) to (0.3 to 1), the proportion of variance of the miRNA transcript explained by single _cis_-miR-eQTLs (
 ) increased from 0.02 to 0.08 on average.
Figure 2: Manhattan plot of _cis_-miR-eQTLs.
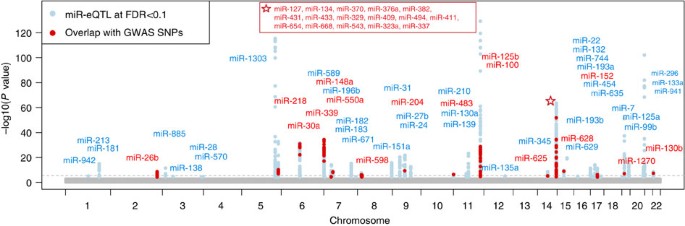
Genome-wide −log10 (P) value plots are shown for every interrogated miRNA (280 expressed miRNAs). Seventy six miRNAs having _cis_-miR-eQTLs are labelled in this figure (for 52 unique peak loci). The horizontal dotted line indicates FDR<0.1 (corresponding to P<6.6 × 10⁻⁵). _cis_-miR-eQTL SNPs overlapping with GWAS SNPs reported in NHGRI GWAS Catalogue (http://www.genome.gov/gwastudies/)21 and NHLBI GRASP database (http://apps.nhlbi.nih.gov/grasp/)22 are shown in red.
Table 1 Summary association results for 16 peak _cis-_miR-eQTLs having supporting GWAS evidence.
Figure 3: The variance proportion of miRNA expression explained by single _cis-_miR-eQTLs at different heritability levels.
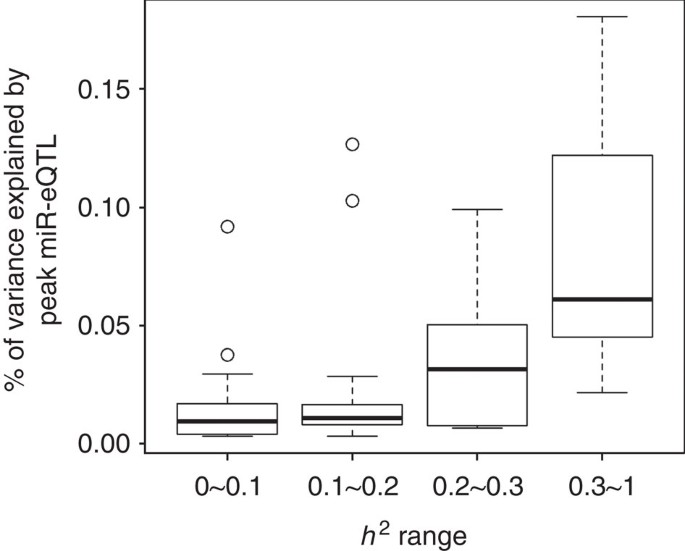
This figure was plotted by the boxplot function in the R library. The boxes indicate the interquartile range (IQR) of data between 75% (Q3) and 25% (Q1). The bars below and above each box indicate the data in Q1−1.5 × IQR and Q3+1.5 × IQR, respectively.
At FDR<0.10 (corresponding P value threshold is 1.0 × 10⁻⁸), we identified 270 _trans-_miR-eQTLs for 15 miRNAs (5% of interrogated expressed miRNAs). Supplementary Figure 5 showed two-dimensional regional plot of cis- and _tran-_miR-eQTLs genome widely (unadjusted cell counts). Supplementary Data 7–8 showed _trans-_miR-eQTLs at FDR<0.1 identified in the overall samples of adjusted and unadjusted cell counts, respectively. We acknowledged those _trans_-miR-eQTLs that need to be validated in independent cohorts.
_cis_-miR-eQTLs showing 5′ positional bias for miRNAs
Among the 76 mature miRNAs with _cis_-miR-eQTLs, 49 (64%) were intragenic, located within annotated protein-coding genes (located in exons, introns or untranslated regions of the host genes) and 27 (36%) were intergenic. We discovered a marked positional bias of _cis_-miR-eQTLs, with many _cis_-miR-eQTLs located in the 5′-upstream region of the corresponding miRNA rather than within miRNA coding regions or the 3′-downstream regions.
Among the 982 non-redundant (LD r 2<0.7) _cis-_miR-eQTLs (representing 1,984 SNP-miRNA pairs), the relative distance of _cis-_miR-eQTLs to the corresponding mature miRNAs is shown in Fig. 4 and the relative distance of _cis-_miR-eQTLs to the transcriptional start site (TSS) is shown in Supplementary Fig. 6. Specifically, for intragenic miRNAs, 418 _cis-_miR-eQTLs (493 SNP-miRNA pairs, 58%) were located in the 5′-upstream region of the corresponding primary miRNAs and 432 _cis-_miR-eQTLs (536 SNP-miRNA pairs, 63%) were in the region defined by 200 kb upstream to 100 kb downstream of the TSS. In contrast, for intergenic miRNAs, 238 _cis-_miR-eQTLs (825 SNP-miRNA pairs, 83%) were located in the 5′-upstream region of the corresponding primary miRNAs, and 125 _cis-_miR-eQTLs (487 SNP-miRNA pairs, 49%) were in the region defined by 500 to 300 kb upstream of the TSS (Supplementary Data 9). There were 207 _cis-_miR-eQTLs (247 SNP-miRNA pairs, 29%) for intragenic miRNAs and 99 _cis-_miR-eQTLs (129 SNP-miRNA pairs, 13%) for intergenic miRNAs located within ±50 kb of the TSS of the corresponding miRNAs.
Figure 4: The distribution of distance between _cis_-miR-eQTLs and miRNA position.
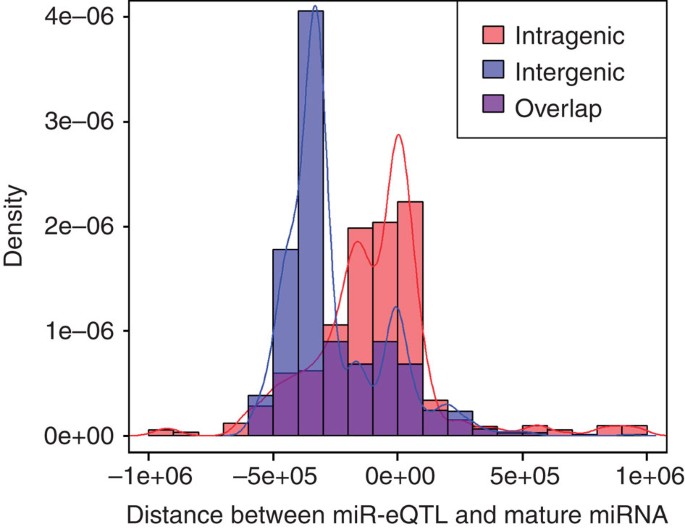
_cis_-miR-eQTLs for intergenic miRNAs are generally located further upstream than for intragenic miRNAs. The position of the first nuclear acid of the mature miRNA is marked as 0. The distribution statistics are based on 982 unique _cis_-miR-eQTLs with LD r 2<0.7.
Genomic features of _cis_-miR-eQTLs
Most of the detected _cis_-miR-eQTLs are not located in protein-coding regions, that is, 39% of eQTLs in intronic and 57% in intergenic regions (Supplementary Data 10). We found significant enrichment of _cis_-miR-eQTLs with expression regulatory elements (Table 2, Supplementary Data 11 and Supplementary Fig. 7), including CpG islands (2%), promoters (9%), enhancers (35%) and transcription factor (TF) binding regions (15%). We also found that _cis_-miR-eQTLs were enriched for miRNA mediated/targeted gene regulatory regions23,24.
Table 2 Summary of human genome regulatory features of _cis-_miR-eQTLs.
There were 1,066 (20%) _cis-_miR-eQTLs that overlapped with _cis-_mRNA-eQTLs identified in whole blood (enrichment P<1e−300 by hypergeometric test)9,25. An example is shown in Supplementary Fig. 8; 132 _cis-_miR-eQTLs (36%) for 12 intergenic mature miRNAs were also _cis-_mRNA-eQTLs for upstream protein-coding genes. We overlapped the 1 Mb region flanking the 132 _cis-_miR-eQTLs (chr14: 100.5–102.5 Mb) with the regulatory feature tracks downloaded from UCSC Genome Browser (genome.ucsc.edu). Supplementary Figure 8 showed that the nearby regions of the 132 _cis-_miR-eQTLs for those 12 miRNAs overlap with Enhancer active region (chr14:101,100 kb–101,200 kb, H3K4Me1 and H2K27AC track, marked in lightyellow rectangle). The highly unmethylated status of GM12878, K562, HeLa-S3 and HepG2 cell lines are in chr14:101,400 kb–101,600 kb upstream of those _cis-_mRNA-eQTL miRNAs (CpG Methylation by Methy450K Bead Arrays from ENCODE/HAIB track, marked by pink colour).
We also discovered 11 intragenic mature miRNAs share _cis-_eQTLs with their host mRNA genes (Supplementary Data 12). For _cis-_miR-eQTLs that overlapped with _cis-_mRNA-eQTLs, we performed conditional analysis to test if the associations between SNPs and miRNAs remained significant when conditioning on the corresponding mRNA expression levels using results from 5024 FHS participants with genotype, and miRNA, and mRNA expression data. As show in Supplementary Data 13, we found 923 _cis-_miR-eQTLs for 3,384 miRNA-SNP association pairs (87%) that remained significant at FDR<0.1 (corresponding P<6.6 × 10⁻⁵) when conditioning on mRNA expression levels. These findings indicate that cis genetic variants may affect expression levels of neighbouring miRNAs and mRNAs.
_cis_-miR-eQTLs and miRNA signatures for complex traits
We linked the _cis_-miR-eQTLs with GWAS SNPs in the NHGRI GWAS Catalogue and the NHLBI GRASP data set21,22. Among 5,269 _cis_-miR-eQTLs, 243 _cis_-miR-eQTLs (for 31 miRNAs) overlapped with GWAS SNPs, including SNPs associated with multiple complex traits (Table 1, Fig. 2, and regional association plots for several traits including height, menarche, platelet count and lipid levels are shown in Supplementary Fig. 9).
For miRNAs with _cis_-miR-eQTLs showing association with complex traits in GWAS, we further tested if expression of these miRNAs in FHS participants was associated with the corresponding traits. We discovered a number of miRNAs that showed differential expression in relation to the complex traits that correspond to the traits associated with their eQTLs in GWAS (Table 1). For example (Fig. 5a,b), among _cis_-miR-eQTLs of miR-100-5p and miR-125b-5p, we found 28 _cis_-miR-eQTLs (that is, GWAS SNPs) that were associated in GWAS with lipid traits (high-density lipoprotein (HDL) cholesterol, low-density lipoprotein (LDL) cholesterol, total cholesterol (TC) and triglycerides (TGs)), 1 (rs7941030) with multiple sclerosis and 1 (rs1216554) with rheumatoid arthritis. These eQTLs are located ~519 kb upstream of their two associated miRNAs. We also found that miR-125b-5p showed differential expression in relation to plasma TC (_P_=0.005, by linear regression tests, see Methods) and HDL cholesterol (_P_=1.68e−5) and miR-100-5p showed differential expression in relation to HDL cholesterol (_P_=0.039). Another example (Fig. 5c,d) is for miR-339-3p and miR-339-5p, which are located in an intron of c7orf50. Among the 282 _cis_-miR-eQTLs SNPs of miR-339-3p and 279 _cis_-miR-eQTLs of miR-339-5p, 8 were associated with TC and 3 with LDL cholesterol. We also found that expression of miR-339-3p was associated with TC (_P_=2.5e−7). These results establish links between SNPs affecting both miRNA expression levels and complex traits. Mendelian randomization (MR) tests provided evidence that four _cis_-miR-eQTLs SNPs (rs6951245, rs11763020, rs1997243 and rs2363286) alter the expression levels of miR-339-3p and miR-339-5p, and in turn affect interindividual variability of TC levels (causal P<0.05).
Figure 5: Regional association plot of _cis_-miR-eQTLs that were associated with GWAS SNPs.
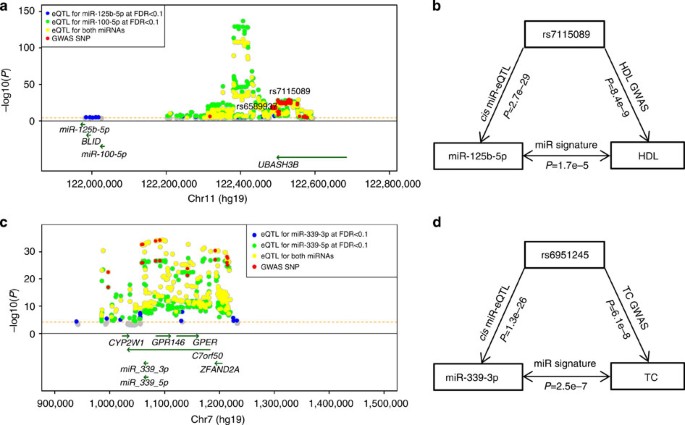
(a) miR-eQTLs for intergenic miRNAs miR-100-5p and miR-125b-5p, with GWAS SNPs for lipid traits, multiple sclerosis and rheumatoid arthritis. The highlighted SNP, rs7115089, is associated with both HDL and total cholesterol at GWAS P<5 × 10⁻⁸ by linear regression tests50; (b) the triangular relationships between SNP (that is, rs7115089), miRNA (that is, miR-125b-5p) and HDL cholesterol; (c) miR-eQTLs for intragenic miRNAs miR-339-3p and miR-339-5p, with GWAS SNPs for TC and LDL; (d) the triangular relationships between SNP (that is, rs6951245), miRNA (that is, miR-339-3p) and TC. –log10(P) indicates the –log10 transformed miRNA-SNP association P values.
Discussion
On the basis of extensive integrated analyses of miRNA expression and genetic variants genome wide in 5,239 individuals, we established a clear pattern of heritability of blood miRNA expression, and identified a substantial number of miRNAs that are controlled by cis genetic regulatory elements. Our results for _cis_-miR-eQTLs were highly replicable; in contrast, _trans_-miR-eQTLs were not replicable. Previously reported miR-eQTLs were identified in studies with small sample sizes (n<200) and revealed a few miR-eQTLs. For example, Borel et al.14 using umbilical cord blood from 180 newborns, identified only 12 _cis_-miR-eQTLs at FDR<0.5. In another study, no _cis_-miR-eQTLs were found in 176 lymphoblastoid cell lines from European and African ancestry samples15. Proxy SNPs of two _cis_-miR-eQTLs that we identified (rs2187519 for miR-100 and rs7797405 for miR-550) were reported by Borel et al.14 (rs10750218 as a proxy for rs2187519 and rs12670233 for rs7797405 are in modest LD at r _2_=0.29 and r _2_=0.48, respectively).
As our data are from a well-powered multi-generation study, we were able to assess narrow sense heritability ( ) of each miRNA expression trait. By comparing the overall heritability of the miRNAs and single _cis_-miR-eQTLs, we discovered that miRNAs with higher heritability were more likely to have _cis_-miR-eQTLs. When the heritability of miRNA transcripts
  increased, the proportion of variance of the miRNA transcript explained by single _cis_-miR-eQTLs (
 ) increased as well. Our heritability study of mRNA expression traits revealed single _cis_-mRNA-eQTLs that explained 33–53% of variances in corresponding mRNA expression levels26. In contrast, single _cis_-miR-eQTLs explained much less proportion of variances in corresponding miRNA expression levels (~1.3% on average).
In contrast to the functional annotation of _cis-_mRNA-eQTLs, most of which are within ~250 kb of mRNA TSS and without 5′ or 3′ positional bias13, we discovered that most _cis_-miR-eQTLs (58% for intragenic miRNAs and 83% for intergenic miRNAs) are located upstream of mature/primary miRNAs. For intergenic miRNAs, a significant fraction of _cis_-miR-eQTLs are quite far upstream (~300–500 kb). Distal regulatory elements can interact with the proximal elements that regulate miRNA expression27. In our results, we found that a significant fraction of _cis_-miR-eQTLs are distal, suggesting that variants in far upstream regions may play important roles in miRNA transcription. In addition, our results revealed that distal _cis_-miR-eQTLs explained a modest proportion (~1.3% on average) of variance in miRNA expression levels. We speculate that the mild effects of _cis_-miR-eQTLs on miRNA expression result from evolutionary selection to stabilize the biological functions mediated by miRNAs.
Genetic variants that modify chromatin accessibility and transcription factor binding are a major mechanism through which genetic variation leads to expression differences for protein-coding genes in humans28. The investigation of regulatory mechanisms of miRNA transcription is still evolving. Genomic feature analyses of _cis_-miR-eQTLs reveal that a large proportion of _cis_-miR-eQTLs are located in regulatory elements such as CpG islands (2%), promoters (9%), enhancers (35%) and TF binding regions (15%). We also discovered that _cis_-miR-eQTLs show a significant enrichment for mRNA-eQTLs and 87% of _cis_-miR-eQTLs that are also mRNA-eQTLs remained significant when conditioning on the corresponding mRNA expression levels. For example, as shown in Supplementary Fig. 8, 132 _cis_-miR-eQTLs (36%) for 12 intergenic miRNAs were also _cis_-mRNA-eQTLs for upstream protein-coding genes. This finding suggests that genetic variants may influence the expression of both miRNAs and nearby protein-coding genes. These eQTL regulatory effects may act via modified chromatin accessibility, transcription factor binding affinity or DNA methylation.
The mechanisms of transcriptional regulation of intragenic miRNAs are more complex than intergenic miRNAs, as intragenic miRNAs may mirror the regulatory mechanisms of their host genes, or be transcribed independently as a consequence of their unique promoter regions29. We identified 11 mature miRNAs from intragenic miRNAs that share cis eQTLs with their host protein coding genes (Supplementary Data 12). Among the _cis_-mRNA-eQTL miRNAs, 15 miRNAs have alternative intronic promoters (alternative intronic promoters were from ref. 29). We overlapped the _cis_-miR-eQTLs and expression regulatory elements annotations from ENCODE nearby regions of each miRNA (±50 kb). We found, in some examples (Supplementary Fig. 10), _cis_-miR-eQTLs near alternative intronic promoter regions demonstrated promoter and enhancer activities and were highly un-methylated in some cell lines. Our findings provide a guide for further functional studies of transcriptional elements of miRNAs.
We identified numerous _cis_-miR-eQTLs that are associated with complex diseases/traits in GWAS (Table 1). Equally noteworthy, we found several examples in which the miRNAs associated in cis with these GWAS SNPs were associated with the corresponding trait (for example, three-way association of HDL cholesterol with its GWAS SNP, rs7115089 and with the corresponding miR-125b-5p). A single miRNA may target hundreds of protein-coding genes. Therefore, the effect of genetic variants on miRNAs can play an important regulatory role in mediating the targeted protein-coding genes, as well as complex phenotypes. We speculate that some of the protein-coding genes targeted by miRNAs may also be involved in the cellular pathways related to the trait. For example, miR-125b-5p expression was associated with HDL cholesterol (_P_=1.7 × 10⁻⁵, by a linear regression test). In a parallel project focusing on differentially expressed mRNAs in association with lipid levels, we found 17 genes targeted by miR-125b-5p (9% of miR-125b-5p targeted genes in miRTarBase24) that showed differential expression in association with HDL cholesterol (at P<0.05 corrected for ~18,000 genes, by a linear regression test)30. Some of these genes are involved in metabolic processes, for example, PRDX2, which was downregulated in association with HDL cholesterol (_P_=1.1 × 10⁻¹⁵, by a linear regression test). Further studies and biological experiments are needed to investigate whether these _cis-_miR-eSNPs affect the corresponding miRNA targeting genes.
In summary, our genome-wide miR-eQTL mapping study provides new insights into the genetic regulation of miRNA transcription and the roles of miRNAs in complex diseases. Our findings may help to identify new opportunities for drug treatment or diagnosis of human diseases.
Methods
Study populations
The FHS is a community-based study that began enroling participants in 1948. In 1971, the offspring and offspring spouses (the offspring cohort) of original FHS cohort participants were recruited and they have been examined every 4 to 8 years31. From 2002 to 2005, the adult children of the offspring cohort participants (the third generation cohort) were recruited and examined32. In this study, we investigated 2,272 offspring cohort attendees at examination cycle 8 (2005–2008) and 3,057 third generation cohort attendees at examination cycle 2 (2008–2010). This study was approved under the Boston University Medical Center protocol H-27984. Written informed consent was obtained from each participant.
miRNA expression profiling
miRNAs were measured from venous blood samples obtained from participants after overnight fasting. Whole blood samples (2.5 ml) were collected in PAXgene Blood RNA tubes (Qiagen, Valencia, CA, USA) and frozen at −800 °C. Total RNA was isolated from the frozen PAXgene Blood RNA tubes (Asuragen, Inc. Austin, TX, USA) and a 2100 Bioanalyzer Instrument (Agilent, Santa Clara, CA, USA) was used for RNA quality assessment. Isolated RNA samples were converted to complementary DNA using TaqMan miRNA Reverse Transcription Kit and MegaPlex Human RT Primer Pool Av2.1 and Pool Bv3.0. (Life Technologies, Foster City, CA, USA) in a 384-well Thermal Cycler. The complementary DNA samples were PreAmplified using TaqMan PreAmp Master Mix and PreAmp Primers, Human Pool A v2.1 and Pool B v3.0 (Life Technologies).
Quantitative reverse transcription PCR (qRT–PCR) reactions were performed with the BioMark System using (Fluidigm, South San Francisco, CA, USA) TaqMan miRNA Assays (Life Technologies). As described in the published literature, measurement of RNA by qRT–PCR is reliable and has high specificity and sensitivity33,34,35,36. The initial miRNA list encompassed all commercially available TaqMan miRNA assays obtainable at the start of the project (754 mature miRNAs). These miRNAs were initially assayed for measurement feasibility in RNA samples from 450 FHS participants. All qRT–PCR reactions were performed in the BioMark Real-Time PCR system using the following protocol: 10 min at 95 °C, 15 s at 95 °C and 1 min at 60 °C for 30 cycles. Single copy can be detected with BioMark system at 26–27 cycle thresholds. For replicates >95% of the data points had coefficients of variation <10% (mean ~4%).
miRNA normalization
We normalized miRNA expression using a model that adjusts raw miRNA cycle threshold (Ct) values for 4 technical variables: isolation batch (50 batches), RNA concentration, RNA quality (defined as RNA integrity number) and RNA 260/280 ratio (ratio of absorbance at 260 and 280 nm; measured using a spectrophotometer). Histograms (Supplementary Fig. 11) show that this model explains 20–60% of variability of raw miRNA measurements for 80% of miRNAs
Genotyping
DNA was isolated from buffy coat or from immortalized lymphoblast cell lines. Genotyping was conducted with the Affymetrix 500 K mapping array and the Affymetrix 50 K gene-focused MIP array, using previously described quality control procedures37. Genotypes were imputed to the 1000 Genomes Project panel 19 of ~36.3 million variants using MACH38. We filtered out SNPs with MAF<0.01 and imputation quality ratio <0.1 (the imputation quality ratio is denoted by the ratio of the variances of the observed and the estimated allele counts), resulting in 9.8 × 10⁶ SNPs (~10 million SNPs) that were eligible for further miR-eQTL testing.
miR-eQTL mapping
Because of the computational burden of running linear mixed effects (LMEs) models for ~10 million (SNPs) × 280 miRNAs (miRNAs expressed in >200 samples), we adapted a two-step analysis strategy. Step 1: linear regression was used to model the association between miRNA Ct values ( ) and the imputed SNP genotypes—adjusted for age, sex, cohort and technical covariates—yielding results for roughly 280 miRNAs × 10 million SNPs, as shown in Equation (1). Associated SNP–miRNA pairs residing within 1 Mb of the mature miRNA (cis) and those residing more than 1 Mb away (trans) were identified separately. We chose liberal P value thresholds to pre-filter the miR-eQTLs, at P<1 × 10⁻³ for cis and P<1 × 10⁻⁵ for trans. These P value thresholds were chosen to ensure that miR-eQTLs at a FDR <0.1 were not omitted as a result of this pre-filtering step. Step 2: we used a linear mixed model39 to recalculate the associations of SNPs and miRNA expression levels for the pre-selected eQTLs from step 1, adjusted for age, sex and technical covariates as fixed effects and a familial correlation matrix (FAM) as the random effect using the lmekin() function of Kinship Package (http://cran.r-project.org/web/packages/kinship/)39, as shown in Equation (2). In Equations (1) and (2), ε is the error term for each independent observation.


Genome coordinate annotation for miRNAs used miRbase v20 (mirbase.org), and for SNPs we used the February 2009 assembly of the human genome (hg19, GRCh37 Genome Reference Consortium Human37). Based on the coordinates of 280 mature miRNAs and 9.8 × 10⁶ SNPs, we estimated there were 13,935,272 (1.4 × 10⁷) potential SNP-miRNA pairs, where the SNP was located within 1 Mb on either side of the corresponding mature miRNA. We estimated there were 1.4 × 10⁷ potential cis SNP–miRNA pairs, and 2.7 × 10⁹ (that is, 280 × 9.8 × 106−1.4 × 10⁷) potential trans SNP–miRNA pairs. We used the Benjamini–Hochberg method40 to calculate FDR for cis- and _trans-_miR-eQTLs by correcting for 1.4 × 10⁷ potential cis SNP–miRNA pairs and 2.7 × 10⁹ potential trans SNP–miRNA pairs, respectively. We selected an FDR threshold of 0.1, corresponding to P<6.6 × 10⁻⁵ for cis- and P<1.0 × 10⁻⁸ for _trans-_miR-eQTLs.
For identified _cis-_miR-eQTLs at FDR<0.1, we used Fragmented Exhaustive Search for TAgSNPs (FESTA)41 to select non-redundant miR-eQTLs based on a series of LD _r_ _2_ thresholds 0.2, 0.5, 0.7 0.9 and 1. FESTA used a mixture of search techniques to partition the whole SNP set into disjointed precincts and selected a tag SNP for each SNP block, which represented a set of SNPs at a LD _r_ _2_ >threshold41.
To estimate the replicability of miR-eQTLs, we split the overall sample set at a 1:1 ratio into discovery and replication sets. The discovery and replication sets represent independent pedigrees to ensure that individuals in the two sets were unrelated. We used the methods described above to identify miR-eQTLs in the discovery and replication sets separately. We evaluated the concordance of effect sizes of _cis_- and _trans_-miR-eQTLs in the discovery and replication sets. We identified eQTLs at FDR<0.1 in the discovery set, and attempted to replicate them in the replication set.
mRNA expression data
Whole blood samples (2.5 ml) were collected in PAXgene tubes by Asuragen, Inc. (PreAnalytiX, Hombrechtikon, Switzerland). Total RNA was isolated according to the company’s standard operating procedures for automated isolation of RNA from 96 samples in a single batch on a KingFisher 96 robot. Then 50 ng RNA samples were amplified using the WT-Ovation Pico RNA Amplification System (NuGEN, San Carlos, CA, USA) as recommended by the manufacturer in an automated manner using the genechip array station. RNA expression was conducted using the Affymetrix Human Exon Array ST 1.0 (Affymetrix, Inc., Santa Clara, CA, USA). The core probe sets were annotated using the Affymetrix annotation files from Netaffx (www.netaffx.com,HuEx-1\_0-st-v2.na29.hg18.probeset.csv).
The raw gene expression data were at first preprocessed by quartile normalization. Then the robust multi-array average values of every gene (17,318 measured genes) were adjusted for a set of technical covariates, for example, chip batch by fitting LME models. Imputed blood cell counts (that is white blood cell (WBC), red blood cell (RBC), platelet, lymphocyte, monocyte, eosinophil, and basophil) (Joehanes R, in preparation) were also evaluated as covariates and adjusted if deemed significant, as detailed below. The residuals were retained for further analysis.
Matching _cis-_miR-eQTLs with _cis-_mRNA-eQTLs
We overlapped the _cis-_miR-eQTLs at FDR<0.1 reported in this study with _cis-_mRNA-eQTLs at FDR<0.1 identifed by refs 9, 25. Hypergeometric test was used to evaluate if _cis-_miR-eQTLs were significantly enriched for _cis-_mRNA-eQTLs. For those overlap eQTLs, that is, _cis-_miR-eQTLs that were also _cis-_mRNA-eQTLs, we used the same linear mixed regression model as described in ‘miR-eQTL mapping’ section to re-analyze the associations between genotypes and miRNA expression levels but conditional regression on corresponding mRNA expression levels.
Estimating effects of cell counts in the miR-eQTLs
Since the miR-eQTLs in whole blood may be driven by cellular composition, we compared the miR-eQTLs in 2,138 individuals with measured cell counts before and after correction for cell count effects (Supplementary Fig. 3). Differential cell counts and proportions in whole blood were measured in 2,138 individuals in the FHS third generation cohort, including seven cell types, WBC, RBC, platelet, neutrophil, lymphocyte, monocyte, eosinophil and basophil. The cell counts and proportions for 5,024 FHS participants were estimated using mRNA expression values by partial least squares regression prediction. The estimated cell count proportion values are highly consistent with the measured cell counts proportion values (Joehanes R, unpublished data, 2014).
We did not find any evidence that cell counts affected the miR-eQTLs; however, we cannot exclude small effects from cell counts. Therefore, we report miR-eQTLs unadjusted for cell counts in our main results, and secondarily report miR-eQTLs adjusted for imputed cell counts (that is, WBC, RBC, platelets, lymphocytes, monocytes, eosinophils and basophils) in Supplementary Data 5. Please note that there were 215 samples without mRNA expression data; therefore, the maximum sample size of analyses unadjusted for cell counts is 5,239 and the maximum sample size of analyses adjusted for cell counts is 5,024.
Estimating the heritability of miRNA expression levels
To estimate the narrow-sense heritability of the expression for a specific miRNA (denoted as  ), we used the model as shown in Equation (3).

Here age, sex and technical covariates were included as fixed effects, FAM was the familial correlation matrix included as the random effect. FAM-represented additive polygenic genetic effects39. ε is the error term for each independent observation.
 was the proportion of the additive polygenic genetic variance (
 ) among the total phenotypic variance
  of miRNA expression:
  . We estimated
  for every miRNA expression trait (247 miRNAs expressed in >1,000 samples) using the lmekin() function of Kinship package (http://cran.r-project.org/web/packages/kinship/)39.
Estimating proportion of variance in miRNAs attributable to miR-eQTLs
To estimate the proportion of variance in a single miRNA trait that is attributable to a single miR-eQTL (denoted as  ), we used the following two models:
Full model:

Null model:

Here age, sex, cohort (offspring cohort and the third generation cohort in the FHS) and technical covariates were included as fixed effects, FAM was the familial correlation matrix included as the random effect. ε is the error term for each independent observation. The proportion of variance in a single miRNA trait that is attributable to a single miR-eQTL was denoted as  and was calculated as follows:

where  was the total phenotypic variance of a miRNA expression trait;
  and
and  were the polygenic and error variances, respectively, when modelling with the tested miR-eQTL;
  and
and  were the polygenic and error variances, respectively, when modelling without the tested miR-eQTL. The lmekin() function in the Kinship package39 was used to estimate
  .
.
Identification of differentially expressed miRNAs for complex traits
We used the NHGRI GWAS Catalogue (http://www.genome.gov/gwastudies/)21 and NHLBI GRASP database (http://apps.nhlbi.nih.gov/grasp/)22 to annotate complex trait associated miR-eQTLs. The _cis_-miR-eQTLs identified in this study were compared with SNPs in the NHGRI GWAS Catalogue and NHLBI GRASP GWAS results for SNPs at P<1 × 10⁻⁵.
For the complex traits that could be mapped with _cis_-miR-eQTLs (and also were measured in the FHS), including menarche, lipids (HDL cholesterol, TG and TC), type II diabetes mellitus (T2D) and glucose level, we used linear mixed models to test their association with miR-eQTL miRNAs in FHS individuals. These phenotypes were ascertained at examinations 8 and 2 for the offspring and the third generation cohorts, respectively. We identified differentially expressed miRNAs associated with HDL cholesterol, TC, TG, T2D and glucose after accounting for age, sex, cell counts and technical covariates (see ‘miRNA normalization’ in methods) and family structure in LME models implemented in the lmekin function39. Differentially expressed miRNA associated with age at menarche were tested in LME models (lmekin) after accounting for birth year, cell counts, technical covariates and family structure.
miRNA TSS and promoter regions
The transcriptional regulatory mechanisms affecting miRNA expression are unclear. There are technical barriers to the precise identification of primary miRNAs, TSSs and promoter regions for most mature miRNAs29. Recently, Marsico et al.29 and Chen et al.42 predicted miRNAs TSSs. Their results were incorporated with the results from previous similar studies43. However, by comparing the TSS positions identified by these two studies, there was, on average, 55 kb distance difference between TSSs positions to the corresponding mature miRNAs. Therefore, in our analysis, we annotated the miRNA TSSs collected and predicted by these two studies. The predicted promoter annotations for miRNAs were obtained from Marsico et al.29 which were screened within ±50 kb from the TSSs for each miRNA.
Functional annotation of _cis_-miR-eQTLs
We annotated the genomic features _cis_-miR-eQTLs (_n_=5,269) using HaploReg44, which integrates results from ENCODE20. The overlap of _cis_-miR-eQTLs with ENCODE annotated SNPs in promoter, enhancer and TF binding sites were retrieved (Supplementary Data 11).
For enrichment tests of functional SNPs in _cis_-miR-eQTLs identified in this study, we downloaded regulatory tracks contained in the UCSC Genome Browser, including ENCODE histone modification sites, and TF and CTCF binding sites in lymphoblastoid cell lines (GM12878), Open Regulatory Annotation (ORegAnno)45, UCSC CpG islands and long intergenic non-coding RNA46. We also downloaded other regulatory tracks, including experimentally validated miRNA targets from TARbase47, and experimentally supported miRNA-mediated gene regulatory sites from Patrocles23. Binominal tests were used to evaluate if the identified _cis_-miR-eQTLs set (5,269 _cis_-miR-eQTLs) showed enrichment for regulatory SNPs for each track (methods described by ref. 13).
We further determined whether or not the detected _cis_-miR-eQTLs SNPs were enriched for promoter, enhancer or protein binding regions on the genome. To do so, we annotated all _cis_-miR-eQTLs (_n_=5,269) using HaploReg44, which integrates results from ENCODE20. We examined enrichment in nine different cell lines (that is, GM12878, H1-hESC, HepG2, HMEC, HSMM, HUVEC, K562, NHEK and NHLF). The null distributions of eQTLs were generated using a permutation strategy by randomly selecting equal number of SNPs (_n_=5,269) 100 times. The pools of candidate SNPs for the permutation were from 1000-genomes imputed SNPs with MAF >0.01 and imputation quality ratio >0.1. To match the distribution of MAFs of the permutation SNPs (the permutation-SNPs set) with the _cis_-miR-eQTLs SNPs (the tested-SNPs set), we categorized MAF into four categories: MAF of (0.01, 0.05), (0.05, 0.1), (0.1, 0.2) and (0.2, 0.5). For each MAF category, we kept the proportion of SNPs in the permutation-SNPs set equal to the proportion of SNPs in the tested-SNPs set. In the four MAF categories, the proportions of SNPs are 3%, 7%, 19% and 71% respectively. The average of the overlap between permutation and regulatory region SNPs (that is SNPs in promoter, enhancer and protein binding regions) was compared with the overlap between the tested SNPs and regulatory region SNPs.
MR test
We used a two-stage least squares (2SLS) MR method48 to estimate the causal relationships between miRNAs and complex traits measured in FHS participants; the traits analyzed included menarche, lipids (HDL, TG and TC), T2D and glucose, using _cis-_miR-eQTLs as instrumental variables. MR was only performed in the pre-filtered SNP-miRNA-trait pairs, when a SNP was a _cis-_miR-eQTL and also present in NHGRI GWAS Catalogue (http://www.genome.gov/gwastudies/)21 or in the NHLBI GRASP database (http://apps.nhlbi.nih.gov/grasp/)22, and the miRNA showed differential expression in relation to the corresponding trait at P<0.05 in FHS participants.
To determine the strength of the genetic instrument, an F-statistic in a linear regression model was derived from the proportion of variation in the miRNA expression levels (miRNA Ct values) that was explained by the corresponding _cis-_miR-eQTL, by modelling age, sex, family structure and four technical variables as covariates (see in the miRNA normalization section). _cis-_miR-eQTLs with an F-statistic <10, indicating a weak instrument, were excluded. The first stage of the 2SLS method involves using a linear regression of the modifiable exposure (miRNA) on the instrumental variable (SNP) and covariates, and saving the predicted miRNA values. In the second stage, the outcome (complex trait) is regressed on the predicted miRNA values. The regression coefficient obtained in the second stage can be interpreted as being the causal effect of the exposure (miRNA) on the outcome (complex trait). The Durbin–Wu–Hausman test49 is used to estimate whether the estimates derived from the first and second stage of the 2SLS are consistent.
Additional information
Accession codes: The mRNA and microRNA expression data of patient samples have been deposited in dbGaP (http://www.ncbi.nlm.nih.gov/gap) under the accession number phs000007.
How to cite this article: Huan, T. et al. Genome-wide identification of microRNA expression quantitative trait loci. Nat. Commun. 6:6601 doi: 10.1038/ncomms7601 (2015).
References
- Lee, R., Feinbaum, R. & Ambros, V. A short history of a short RNA. Cell 116, S89–S92 (2004) .
Article CAS Google Scholar - Lee, R. C. & Ambros, V. An extensive class of small RNAs in Caenorhabditis elegans. Science 294, 862–864 (2001) .
Article CAS ADS Google Scholar - Cordes, K. R. & Srivastava, D. MicroRNA regulation of cardiovascular development. Circ. Res. 104, 724–732 (2009) .
Article CAS Google Scholar - Small, E. M. & Olson, E. N. Pervasive roles of microRNAs in cardiovascular biology. Nature 469, 336–342 (2011) .
Article CAS ADS Google Scholar - Thum, T. et al. MicroRNAs in the human heart: a clue to fetal gene reprogramming in heart failure. Circulation 116, 258–267 (2007) .
Article CAS Google Scholar - Tijsen, A. J. et al. MiR423-5p as a circulating biomarker for heart failure. Circ. Res. 106, 1035–1039 (2010) .
Article CAS Google Scholar - Fiedler, J. & Thum, T. MicroRNAs in myocardial infarction. Arterioscler. Thromb. Vasc. Biol. 33, 201–205 (2013) .
Article CAS Google Scholar - Lu, J. et al. MicroRNA expression profiles classify human cancers. Nature 435, 834–838 (2005) .
Article CAS ADS Google Scholar - Westra, H.-J. et al. Systematic identification of trans eQTLs as putative drivers of known disease associations. Nat. Genet. 45, 1238–1243 (2013) .
Article CAS Google Scholar - Zhang, B. et al. Integrated systems approach identifies genetic nodes and networks in late-onset Alzheimer's disease. Cell 153, 707–720 (2013) .
Article CAS Google Scholar - Emilsson, V. et al. Genetics of gene expression and its effect on disease. Nature 452, 423–428 (2008) .
Article CAS ADS Google Scholar - Schadt, E. E. et al. Mapping the genetic architecture of gene expression in human liver. PLoS Biol. 6, e107 (2008) .
Article Google Scholar - Zhang, X. et al. Synthesis of 53 tissue and cell line expression QTL datasets reveals master eQTLs. BMC Genomics 15, 532 (2014) .
Article Google Scholar - Borel, C. et al. Identification of cis- and trans-regulatory variation modulating microRNA expression levels in human fibroblasts. Genome Res. 21, 68–73 (2011) .
Article CAS Google Scholar - Gamazon, E. R. et al. Genetic architecture of microRNA expression: implications for the transcriptome and complex traits. Am. J. Hum. Genet. 90, 1046–1063 (2012) .
Article CAS Google Scholar - Civelek, M. et al. Genetic regulation of human adipose microRNA expression and its consequences for metabolic traits. Hum. Mol. Genet. 22, 3023–3037 (2013) .
Article CAS Google Scholar - Somel, M. et al. MicroRNA, mRNA, and protein expression link development and aging in human and macaque brain. Genome Res. 20, 1207–1218 (2010) .
Article CAS Google Scholar - Siddle, K. J. et al. A genomic portrait of the genetic architecture and regulatory impact of microRNA expression in response to infection. Genome Res. 24, 850–859 (2014) .
Article CAS Google Scholar - Abecasis, G. R. et al. An integrated map of genetic variation from 1,092 human genomes. Nature 491, 56–65 (2012) .
Article ADS Google Scholar - Birney, E. et al. Identification and analysis of functional elements in 1% of the human genome by the ENCODE pilot project. Nature 447, 799–816 (2007) .
Article CAS ADS Google Scholar - Hindorff, L. A. et al. Potential etiologic and functional implications of genome-wide association loci for human diseases and traits. Proc. Natl Acad. Sci. USA 106, 9362–9367 (2009) .
Article CAS ADS Google Scholar - Leslie, R., O'Donnell, C. J. & Johnson, A. D. GRASP: analysis of genotype-phenotype results from 1390 genome-wide association studies and corresponding open access database. Bioinformatics 30, i185–i194 (2014) .
Article CAS Google Scholar - Hiard, S., Charlier, C., Coppieters, W., Georges, M. & Baurain, D. Patrocles: a database of polymorphic miRNA-mediated gene regulation in vertebrates. Nucleic Acids Res. 38, D640–D651 (2010) .
Article CAS Google Scholar - Hsu, S. D. et al. miRTarBase: a database curates experimentally validated microRNA-target interactions. Nucleic Acids Res. 39, D163–D169 (2011) .
Article CAS Google Scholar - Joehanes, R. et al. Genome-wide Expression Quantitative Trait Loci: Results from the NHLBI s SABRe CVD Initiative. in the American Society of Human Genetics (ASHG) Conference (Boston, MA, USA, (2013) .
- Huan, T. et al. A systematic heritability analysis of the human whole blood transcriptome. Human genetics 134, 343–358 (2015) .
Article CAS Google Scholar - Cesana, M. et al. A long noncoding RNA controls muscle differentiation by functioning as a competing endogenous RNA. Cell 147, 358–369 (2011) .
Article CAS Google Scholar - Degner, J. F. et al. DNase I sensitivity QTLs are a major determinant of human expression variation. Nature 482, 390–394 (2012) .
Article CAS ADS Google Scholar - Marsico, A. et al. PROmiRNA: a new miRNA promoter recognition method uncovers the complex regulation of intronic miRNAs. Genome Biol. 14, R84 (2013) .
Article Google Scholar - Chen, B. H. et al. Transcriptome-wide association study of circulating lipid levels. Circulation 129, A35–A35 (2014) .
Article Google Scholar - Feinleib, M., Kannel, W. B., Garrison, R. J., McNamara, P. M. & Castelli, W. P. The Framingham Offspring Study. Design and preliminary data. Prev. Med. 4, 518–525 (1975) .
Article CAS Google Scholar - Splansky, G. L. et al. The third generation cohort of the national heart, lung, and blood institute's Framingham heart study: design, recruitment, and initial examination. Am. J. Epidemiol. 165, 1328–1335 (2007) .
Article Google Scholar - Chen, C., Tan, R., Wong, L., Fekete, R. & Halsey, J. Quantitation of microRNAs by real-time RT-qPCR. Methods Mol. Biol. 687, 113–134 (2011) .
Article CAS Google Scholar - Chen, C. et al. Real-time quantification of microRNAs by stem-loop RT-PCR. Nucleic Acids Res. 33, e179 (2005) .
Article Google Scholar - Jensen, S. G. et al. Evaluation of two commercial global miRNA expression profiling platforms for detection of less abundant miRNAs. BMC Genomics 12, 435 (2011) .
Article CAS Google Scholar - Jang, J. et al. Quantitative miRNA expression analysis using fluidigm microfluidics dynamic arrays. BMC Genomics 12, 144 (2011) .
Article CAS Google Scholar - Levy, D. et al. Genome-wide association study of blood pressure and hypertension. Nat. Genet. 41, 677–687 (2009) .
Article CAS Google Scholar - Trapnell, C., Pachter, L. & Salzberg, S. L. TopHat: discovering splice junctions with RNA-Seq. Bioinformatics 25, 1105–1111 (2009) .
Article CAS Google Scholar - Almasy, L. & Blangero, J. Multipoint quantitative-trait linkage analysis in general pedigrees. Am. J. Hum. Genet. 62, 1198–1211 (1998) .
Article CAS Google Scholar - Benjamini, Y. & Hochberg, Y. Controlling the false discovery rate: a practical and powerful approach to multiple testing. J. R. Stat. Soc. Ser. B 57, 289–300 (1995) .
MathSciNet MATH Google Scholar - Qin, Z. S., Gopalakrishnan, S. & Abecasis, G. R. An efficient comprehensive search algorithm for tagSNP selection using linkage disequilibrium criteria. Bioinformatics 22, 220–225 (2006) .
Article CAS Google Scholar - Chen, D. et al. Dissecting the chromatin interactome of microRNA genes. Nucleic Acids Res. 42, 3028–3043 (2014) .
Article CAS Google Scholar - Chien, C. H. et al. Identifying transcriptional start sites of human microRNAs based on high-throughput sequencing data. Nucleic Acids Res. 39, 9345–9356 (2011) .
Article CAS ADS Google Scholar - Ward, L. D. & Kellis, M. HaploReg: a resource for exploring chromatin states, conservation, and regulatory motif alterations within sets of genetically linked variants. Nucleic Acids Res. 40, D930–D934 (2012) .
Article CAS Google Scholar - Griffith, O. L. et al. ORegAnno: an open-access community-driven resource for regulatory annotation. Nucleic Acids Res. 36, D107–D113 (2008) .
Article CAS Google Scholar - Cabili, M. N. et al. Integrative annotation of human large intergenic noncoding RNAs reveals global properties and specific subclasses. Genes Dev. 25, 1915–1927 (2011) .
Article CAS Google Scholar - Vergoulis, T. et al. TarBase 6.0: capturing the exponential growth of miRNA targets with experimental support. Nucleic Acids Res. 40, D222–D229 (2012) .
Article CAS Google Scholar - Lawlor, D. A., Harbord, R. M., Sterne, J. A., Timpson, N. & Davey Smith, G. Mendelian randomization: using genes as instruments for making causal inferences in epidemiology. Stat. Med. 27, 1133–1163 (2008) .
Article MathSciNet Google Scholar - Baum, C. F., Schaffer, M. E. & Stillman, S. IVENDOG: Stata module to calculate Durbin-Wu-Hausman endogeneity test after ivreg. Statistical Software Components, Department of Economics, Boston College (2007) .
- Teslovich, T. M. et al. Biological, clinical and population relevance of 95 loci for blood lipids. Nature 466, 707–713 (2010) .
Article CAS ADS Google Scholar
Acknowledgements
The Framingham Heart Study is funded by the National Institutes of Health contract N01-HC-25195. The laboratory work for this investigation was funded by the Division of Intramural Research, National Heart, Lung, and Blood Institute, the National Institutes of Health. The analytical component of this project was funded by the Division of Intramural Research, the National Heart, Lung, and Blood Institute, and the Center for Information Technology, the National Institutes of Health, Bethesda, MD, USA. This study utilized the high-performance computational capabilities of the Biowulf Linux cluster at the National Institutes of Health, Bethesda, MD, USA (http://biowulf.nih.gov).
Author information
Authors and Affiliations
- The Framingham Heart Study, Framingham, 01702, Massachusetts, USA
Tianxiao Huan, Chunyu Liu, Xiaoling Zhang, Roby Joehanes, Brian H. Chen, Joanne M. Murabito, Chen Yao, Paul Courchesne, Christopher J. O’Donnell, Andrew D. Johnson, Martin G. Larson & Daniel Levy - Division of Intramural Research, The Population Sciences Branch, National Heart, Lung, and Blood Institute, Bethesda, 20824, Maryland, USA
Tianxiao Huan, Chunyu Liu, Roby Joehanes, Brian H. Chen, Chen Yao, Paul Courchesne & Daniel Levy - Department of Mathematics and Statistics, Boston University, Boston, 02118, Massachusetts, USA
Jian Rong & Martin G. Larson - Division of Intramural Research, Cardiovascular Epidemiology and Human Genomics Branch, National Heart, Lung and Blood Institute, Bethesda, 20824, Maryland, USA
Xiaoling Zhang, Christopher J. O’Donnell & Andrew D. Johnson - Department of Medicine, University of Massachusetts Medical School, Worcester, 01655, Massachusetts, USA
Kahraman Tanriverdi & Jane E. Freedman - Mathematical and Statistical Computing Laboratory, Center for Information Technology, National Institutes of Health, Bethesda, 20824, Maryland, USA
Roby Joehanes & Peter J. Munson - Harvard Medical School, Harvard University, Boston, 02115, Massachusetts, USA
Roby Joehanes - Hebrew SeniorLife, Boston, 02131, Massachusetts, USA
Roby Joehanes - Department of Medicine, Section of General Internal Medicine, Boston University School of Medicine, Boston, 02118, Massachusetts, USA
Joanne M. Murabito - Department of Human Genetics, University of Chicago, Chicago, 60637, Illinois, USA
Nancy Cox
Authors
- Tianxiao Huan
- Jian Rong
- Chunyu Liu
- Xiaoling Zhang
- Kahraman Tanriverdi
- Roby Joehanes
- Brian H. Chen
- Joanne M. Murabito
- Chen Yao
- Paul Courchesne
- Peter J. Munson
- Christopher J. O’Donnell
- Nancy Cox
- Andrew D. Johnson
- Martin G. Larson
- Daniel Levy
- Jane E. Freedman
Contributions
D.L. and J.E.F. designed, directed and supervised the project. D.L., M.G.L and J.E.F. were responsible for funding of the project. T.H and D.L. drafted the manuscript. J.E.F. and K.T. directed and supervised the miRNA experiment. P.C. organized the experiment material and data exchange. All authors participated in revising and editing the manuscripts. All authors have read and approved the final version of the manuscript.
Corresponding authors
Correspondence toDaniel Levy or Jane E. Freedman.
Ethics declarations
Competing interests
There are no competing financial interests.
Supplementary information
Rights and permissions
About this article
Cite this article
Huan, T., Rong, J., Liu, C. et al. Genome-wide identification of microRNA expression quantitative trait loci.Nat Commun 6, 6601 (2015). https://doi.org/10.1038/ncomms7601
- Received: 02 September 2014
- Accepted: 11 February 2015
- Published: 20 March 2015
- DOI: https://doi.org/10.1038/ncomms7601