Transcription-associated mutational asymmetry in mammalian evolution (original) (raw)
We obtained most of the genomic sequence orthologous to a locus of roughly 1.5 Mb on human chromosome 7 containing nine known genes (Fig. 1) from each of eight other mammals (chimpanzee, baboon, cow, pig, cat, dog, mouse and rat). In initial analyses (Fig. 2 and Supplementary Fig. 1 online), we tabulated substitutions that have occurred in this locus in the human and chimpanzee lineages since their last common ancestor. There was a significant strand asymmetry in substitution rates, with the transition A→G occurring at a 28% higher rate than the complementary transition T→C (χ21df = 33.54, P < 0.00001).
Figure 1: Known transcripts, regions of excess purine or pyrimidine transition substitutions and regions of excess G+T or C+A composition in the sequenced locus.

Arrows indicate transcript direction and extent. Solid bars indicate maximal segments in which approximately 55% of isolated transitions in the human–baboon alignment involve top-strand purines (bar shown above line) or top-strand pyrimidines (bar shown below line). Open bars indicate maximal segments in which approximately 52% of bases (ignoring repeats) in the human sequence are G or T (bar shown above line) or C or A (bar shown below line).
Figure 2: Rates of isolated, non-CpG transition substitutions in the combined human and chimpanzee lineages since their last common ancestor.
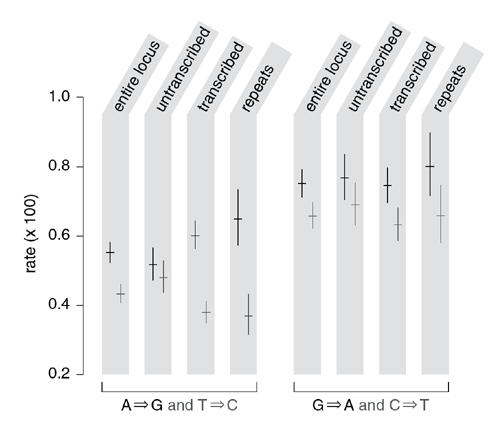
Substitutions are properly viewed as changes in base pairs rather than bases, as it is not possible with evolutionary data to infer on which DNA strand the mutation originally occurred. But for notational convenience, we arbitrarily chose a strand and scored the substitution by indicating the base change on that strand. Substitutions are scored on the top strand for the entire locus and untranscribed region estimates, and on the coding strand of each transcript for the transcribed region estimates. Rates for each substitution and its complement (for example, A→G and T→C) and their 95% confidence intervals are shown side by side, by region type. transcribed, the exons and introns of the nine known genes; untranscribed, all other positions in the locus; repeats, interspersed repeats in transcribed regions.
To examine a possible association with transcription, we tabulated separately the substitutions at transcribed and untranscribed positions, scoring the former with respect to the coding strand (that is, the strand complementary to the template strand for transcription). We saw pronounced asymmetries in the transcribed regions for transition substitutions (Fig. 2): A→G transitions were 58% more frequent than T→C (χ21df = 72.4, P < 0.00001), and G→A transitions were 18% more frequent than C→T (χ21df = 10.01, P < 0.002). These asymmetries were also seen when we considered only substitutions in interspersed repeats in the transcribed regions (Fig. 2). Because such sequences are thought to be non-functional, this indicates that the pattern reflects an asymmetry in neutral mutation, rather than selection. Purine transitions were more frequent and pyrimidine transitions less frequent in transcribed regions than in untranscribed regions (Fig. 2), such that the overall transition rate in interspersed repeats was essentially identical for the transcribed and untranscribed portions of the locus (0.00614 versus 0.00613).
To test whether this asymmetry was specific to transcribed regions, we did a 'maximal segment' analysis13 to identify regions with a significant excess or deficit of purine transitions relative to pyrimidine transitions (Fig. 1). We used the baboon sequence rather than the chimpanzee sequence for this analysis, because its higher level of divergence from the human (about 6% versus about 1%) provides more statistical power and higher resolution in detecting asymmetries. Lacking a close outgroup for the human–baboon comparison, we could not reliably score transition directions, but we could classify transitions as purine (A↔G) or pyrimidine (C↔T) with respect to the top strand. We found six maximal segments of excess purine transitions (Fig. 1), and these correspond to the six known genes that are transcribed from left to right. Similarly, we found two segments showing the complementary pattern, an excess of pyrimidine transitions, and these correspond to two of the three known genes transcribed in the complementary direction (WNT2 has no corresponding segment).
Although segment boundaries did not precisely align with the transcript boundaries (possibly owing to an insufficient density of informative sites), this analysis showed that the strand asymmetry was associated specifically with transcribed regions and extended throughout them. It did not show the type of pattern expected to result from mutational differences in leading- and lagging-strand synthesis starting from multiple replication origins, that is, complementary biases flanking particular sites14. (A substitution asymmetry associated with replication origins in the β-globin locus has been reported15 but disputed14,16.) The originally observed asymmetry in the locus as a whole may now be understood as arising from the fact that six of the eight genes showing the asymmetry are oriented in the same direction.
We then tested whether the asymmetry could be seen in non-primate mammalian lineages by looking at transition substitutions between cow and pig, cat and dog and mouse and rat for each of the nine genes (Fig. 3). Each species pair showed an excess of purine transitions on the coding strand for most of the genes, although there were lineage-specific differences as to which genes were affected. In particular, CAV1 and CAV2 showed the asymmetry only in the primates, and the rodents did not show the asymmetry for two genes (ST7 and CORTBP2) that were affected in the other three species pairs.
Figure 3: Transcript-specific ratios of A↔G to C↔T transition rates for different pairs of mammals.
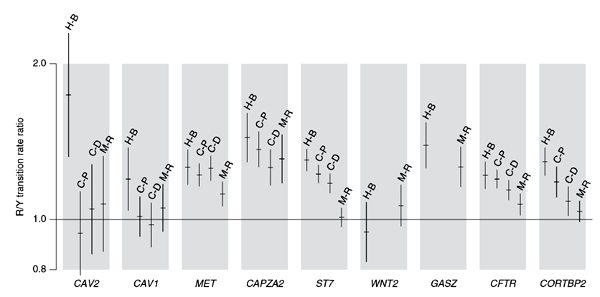
For each gene, the rate ratio and 95% confidence interval are shown for the human–baboon (H-B), cow–pig (C-P), cat–dog (C-D) and mouse–rat (M-R) sequence alignments, in that order. All substitutions are scored on the coding strand. WNT2 and GASZ sequences are not yet available for pig and dog.
Because the A→G versus T→C asymmetry is stronger than the G→A versus C→T asymmetry (Fig. 2), over long periods of time it should produce an excess of G nucleotides relative to C and of T relative to A; a quantitative analysis17 taking into account the observed rates predicted the equilibrium G+T frequency to be 52.7%. We examined this prediction in the human sequence, excluding interspersed repeats (which may have inserted too recently to have reached compositional equilibrium) and protein-coding exons (which are under selection) from the analysis. Six of the nine genes showed a significant (P < 0.05) G+T excess (Fig. 4), the three exceptions being WNT2, which did not show the mutational asymmetry, and CAV1 and CAV2, for which the mutational asymmetry seems to be specific to the primate lineage (Fig. 3) and so may not have been acting long enough to produce a compositional bias. For the remaining genes, the G+T excess was generally of roughly the predicted magnitude, although it was weak for MET. Maximal segment analysis (Fig. 1) indicated that, like the mutational asymmetry, the regions of G+T excess were specific to, and spanned, the transcribed regions.
Figure 4: G+T composition in transcribed regions.
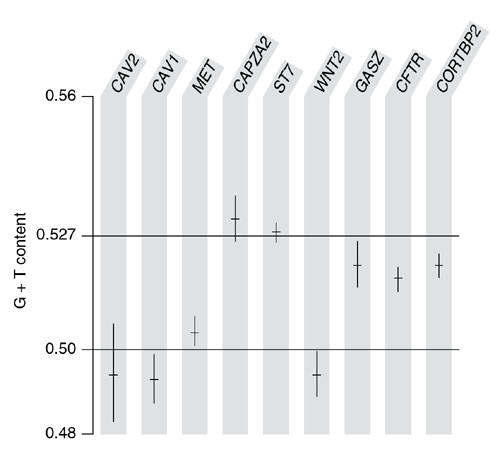
For each gene, the G+T composition as determined from non-coding, non-repetitive sequence in the coding strand of the transcript and the 95% confidence interval are shown. Horizontal lines indicate unbiased (0.5) and predicted (0.527) compositions.
To explore the extent of this compositional asymmetry in human genes, we analyzed the sequence of human chromosome 22 (ref. 18). Of 275 annotated transcripts for which mRNA data was available, 187 (68%) showed a significant (P < 0.01) G+T excess. For transcripts longer than 10 kb, this proportion rose to 82% (159 of 195), and for transcripts longer than 20 kb, it was 91% (127 of 139). The average G+T content over all transcripts was 52.6%, close to the predicted value. We note that a G+T compositional excess has also been observed in several bacterial genomes7, but it seems to arise from replication rather than transcription7,19.
Our analyses identified a strand asymmetry in neutral substitution patterns in most mammalian genes. This probably explains a previously observed strand asymmetry in disease-causing mutations in human genes20 in which the pattern was less clear owing to the effects of selection. In contrast with the known transcription-associated substitution asymmetry in enterobacteria, which is characterized by an excess of C→T coding-strand transitions attributable to cytosine deamination9,10,11, the one we found is characterized by an excess of purine transitions and a deficit of pyrimidine transitions relative to untranscribed DNA. As there is no difference in overall substitution rate, the asymmetry is probably not due to differences in mutation rates or repair efficiency in transcribed regions. Rather, we believe that it is a byproduct of transcription-coupled repair (TCR; refs. 12,21) acting on the mismatched base pairs that result from uncorrected DNA polymerase substitution errors during DNA replication. The usual fate of such mismatches in untranscribed regions is presumably to persist until the next replication round, at which time the two mispaired bases segregate into the daughter DNA duplexes, implying a 50% chance that a given daughter cell will inherit the mutation. Mispairs in transcribed regions, however, may be resolved by TCR before the next replication round.
According to current models21, TCR is triggered by DNA damage–induced stalling of RNA polymerase II, but its targeting to specific sites is thought to require the mismatch repair proteins MSH2 and MSH6 (refs. 22,23). As the MSH2–MSH6 heterodimer MutSα recognizes mispairs as well as damaged bases, the TCR repair machinery may be directed to any mispair in the vicinity of the stalled polymerase. It is, moreover, plausible that MutSα bound to the mispair could itself trigger TCR by obstructing the RNA polymerase II complex, even in the absence of DNA damage. In any case, repair then proceeds by excision of an oligonucleotide patch on the transcribed DNA strand, followed by resynthesis using the coding strand as a template. This will resolve the mismatched base pair into a proper base pair, which will be mutant if, and only if, the originally misinserted base is on the coding strand.
Assuming that misinsertions occur with equal frequency on the two strands, the above mechanism again implies a 50% chance that a daughter cell inherits the mutation, so it does not change the overall mutation rate. But the spectrum of resulting mutational events, viewed as base changes on the coding strand, will correspond to the spectrum of DNA polymerase base misinsertion errors, which may be strand-asymmetric. Our observation of an excess of purine transitions is consistent with data from both prokaryotic and eukaryotic systems24,25 that the misinserted base in a purine–pyrimidine mispair is more likely to be the purine than the pyrimidine. Moreover, the fact that the strongest asymmetry occurs for A→G transitions, which in this model would result from the resolution of G–T mispairs arising from misinserted G, is consistent with the observation that MutSα is particularly efficient at recognizing G–T mispairs26.
The above explanation can thus account for each of the key observations regarding the mutational asymmetry. If it is correct, then TCR must be fairly active in the mammalian germ line, affecting most (but not all) genes. The observation that most genes show the G+T compositional bias suggests that the mutational bias has been acting for much of mammalian evolution, although differences among lineages (Fig. 3) indicate some changes in germline gene expression may have occurred.
The maximal segment analyses illustrated in Figure 1 offer two new methods to detect genes in mammalian genomes. Traditional comparative genomic approaches depend on sequence conservation reflecting purifying selection to identify biological features, and require relatively diverged sequences (>30%). In contrast, our approach uses neutral mutation patterns to detect the extent and orientation of transcribed regions, and may be used either with single sequences or with sequence pairs too closely related for the traditional approach to analyze.