Global assessment of trends in wetting and drying over land (original) (raw)
- Letter
- Published: 14 September 2014
- Boris Orlowsky1,
- Brigitte Mueller1 nAff5,
- Justin Sheffield3,
- Markus Reichstein4 &
- …
- Sonia I. Seneviratne1
Nature Geoscience volume 7, pages 716–721 (2014) Cite this article
- 17k Accesses
- 799 Citations
- 162 Altmetric
- Metrics details
Subjects
A Corrigendum to this article was published on 28 September 2014
This article has been updated
Abstract
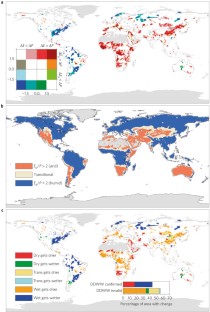
Changes in the hydrological conditions of the land surface have substantial impacts on society1,2. Yet assessments of observed continental dryness trends yield contradicting results3,4,5,6,7. The concept that dry regions dry out further, whereas wet regions become wetter as the climate warms has been proposed as a simplified summary of expected8,9,10 as well as observed10,11,12,13,14 changes over land, although this concept is mostly based on oceanic data8,10. Here we present an analysis of more than 300 combinations of various hydrological data sets of historical land dryness changes covering the period from 1948 to 2005. Each combination of data sets is benchmarked against an empirical relationship between evaporation, precipitation and aridity. Those combinations that perform well are used for trend analysis. We find that over about three-quarters of the global land area, robust dryness changes cannot be detected. Only 10.8% of the global land area shows a robust ‘dry gets drier, wet gets wetter’ pattern, compared to 9.5% of global land area with the opposite pattern, that is, dry gets wetter, and wet gets drier. We conclude that aridity changes over land, where the potential for direct socio-economic consequences is highest, have not followed a simple intensification of existing patterns.
This is a preview of subscription content, access via your institution
Access options
Subscribe to this journal
Receive 12 print issues and online access
$259.00 per year
only $21.58 per issue
Buy this article
- Purchase on SpringerLink
- Instant access to the full article PDF.
USD 39.95
Prices may be subject to local taxes which are calculated during checkout
Additional access options:
Figure 1: Vegetation-adjusted Budyko framework.
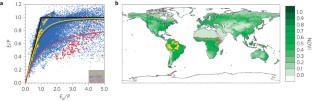
The alternative text for this image may have been generated using AI.
Figure 2: Budyko validation of hydrological data set combinations for the 1984–2005 period.
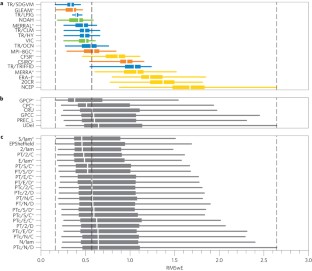
The alternative text for this image may have been generated using AI.
Figure 3: Detection of robust dryness changes.
The alternative text for this image may have been generated using AI.
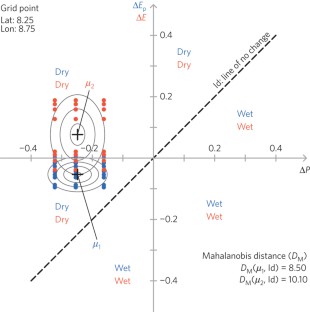
Figure 4: Investigating the DDWW paradigm.
The alternative text for this image may have been generated using AI.
Change history
24 September 2014
In the version of this Letter originally published, in the main text, the number of different combinations given for each grid point in Fig. 3 were incorrect and should have read "28 (77)". Additionally, the second sentence describing the parameters in the final equation should have read "Significance at the 5% level is thus assigned for n = 28 combinations of E and P data sets if _D_M2 ≳ 1.5 and for n = 44 combinations of _E_p and P data sets also if _D_M2 ≳ 1.5." Furthermore, in the key for Fig. 4a, the values should have read 1.5 (-1.5). These errors have no influence on the results of the study, and have now been corrected in the online versions of the Letter.
References
- Piao, S. et al. The impacts of climate change on water resources and agriculture in China. Nature 467, 43–51 (2010).
Article Google Scholar - Hoekstra, A. Y. & Mekonnen, M. M. The water footprint of humanity. Proc. Natl Acad. Sci. USA (2012).
- Seneviratne, S. I. et al. Managing the Risks of Extreme Events and Disasters to Advance Climate Change Adaptation 109–230 (Cambridge Univ. Press, 2012).
Book Google Scholar - Burke, E. J. & Brown, S. J. Evaluating uncertainties in the projection of future drought. J. Hydrometeorol. 9, 292–299 (2008).
Article Google Scholar - Dai, A. Drought under global warming: A review. Wiley Interdiscip. Rev.: Clim. Change 2, 45–65 (2011).
Google Scholar - Sheffield, J., Wood, E. F. & Roderick, M. L. Little change in global drought over the past 60 years. Nature 491, 435–438 (2012).
Article Google Scholar - Orlowsky, B. & Seneviratne, S. I. Elusive drought: Uncertainty in observed trends and short- and long-term CMIP5 projections. Hydrol. Earth Syst. Sci. 17, 1765–1781 (2013).
Article Google Scholar - Held, I. M. & Soden, B. J. Robust responses of the hydrological cycle to global warming. J. Clim. 19, 5686–5699 (2006).
Article Google Scholar - Chou, C., Neelin, J. D., Chen, C-A. & Tu, J-Y. Evaluating the Rich-Get-Richer mechanism in tropical precipitation change under global warming. J. Clim. 22, 1982–2005 (2009).
Article Google Scholar - Durack, P. J., Wijffels, S. E. & Matear, R. J. Ocean salinities reveal strong global water cycle intensification during 1950 to 2000. Science 336, 455–458 (2012).
Article Google Scholar - Allan, R. P., Soden, B. J., John, V. O., Ingram, W. & Good, P. Current changes in tropical precipitation. Environ. Res. Lett. 5, 025205 (2010).
Article Google Scholar - Seager, R. & Vecchi, G. A. Greenhouse warming and the 21st century hydroclimate of southwestern North America. Proc. Natl Acad. Sci. USA 107, 21277–21282 (2010).
Article Google Scholar - Liu, C. & Allan, R. P. Observed and simulated precipitation responses in wet and dry regions 1850–2100. Environ. Res. Lett. 8, 034002 (2013).
Article Google Scholar - Chou, C. et al. Increase in the range between wet and dry season precipitation. Nature Geosci. 6, 263–267 (2013).
Article Google Scholar - Roderick, M. L., Sun, F. & Farquhar, G. D. Water cycle varies over land and sea. Science 336, 1230–1231 (2012).
Article Google Scholar - Roderick, M. L., Sun, F., Lim, W. H. & Farquhar, G. D. A general framework for understanding the response of the water cycle to global warming over land and ocean. Hydrol. Earth Syst. Sci. 18, 1575–1589 (2014).
Article Google Scholar - Seneviratne, S. I. et al. Investigating soil moisture-climate interactions in a changing climate: A review. Earth-Sci. Rev. 99, 125–161 (2010).
Article Google Scholar - Mueller, B. et al. Evaluation of global observations-based evapotranspiration datasets and IPCC AR4 simulations. Geophys. Res. Lett. 38, L06402 (2011).
Google Scholar - Vicente-Serrano, S. M., Beguería, S. & López-Moreno, J. I. A multiscalar drought index sensitive to global warming: The standardized precipitation evapotranspiration index. J. Clim. 23, 1696–1718 (2009).
Article Google Scholar - Middleton, N. et al. World Atlas of Desertification 2nd edn (Arnold, Hodder Headline, PLC, 1997).
Google Scholar - Budyko, M. I. Climate and Life (Academic, 1974).
Google Scholar - Fu, B. On the calculation of the evaporation from land surface (in Chinese). Sci. Atmos. Sin. 1, 23–31 (1981).
Google Scholar - Zhang, L. et al. A rational function approach for estimating mean annual evapotranspiration. Water Resour. Res. 40, W02502 (2004).
Google Scholar - Donohue, R. J., Roderick, M. L. & McVicar, T. R. On the importance of including vegetation dynamics in Budyko’s hydrological model. Hydrol. Earth Syst. Sci. 11, 983–995 (2007).
Article Google Scholar - Roderick, M. L. & Farquhar, G. D. A simple framework for relating variations in runoff to variations in climatic conditions and catchment properties. Wat. Resour. Res. 47, W00G07 (2011).
Google Scholar - Li, D., Pan, M., Cong, Z., Zhang, L. & Wood, E. Vegetation control on water and energy balance within the Budyko framework. Wat. Resour. Res. 49, 969–976 (2013).
Article Google Scholar - Mueller, B. et al. Benchmark products for land evapotranspiration: LandFlux-EVAL multi-dataset synthesis. Hydrol. Earth Syst. Sci. 10, 769–805 (2013).
Article Google Scholar - Sitch, S. et al. Trends and drivers of regional sources and sinks of carbon dioxide over the past two decades. Biogeosci. Discuss. 10, 20113–20177 (2013).
Article Google Scholar - Hwang, Y-T., Frierson, D. M. W. & Kang, S. M. Anthropogenic sulfate aerosol and the southward shift of tropical precipitation in the late 20th century. Geophys. Res. Lett. 40, 2845–2850 (2013).
Article Google Scholar - Peel, M. C., Finlayson, B. L. & McMahon, T. A. Updated world map of the Köppen–Geiger climate classification. Hydrol. Earth Syst. Sci. 11, 1633–1644 (2007).
Article Google Scholar
Acknowledgements
The Center for Climate Systems Modeling (C2SM) at ETH Zurich is acknowledged for providing technical support. This work was supported by ETH Research Grant CH2-01 11-1. We acknowledge participants of the TRENDY model intercomparison project for access to their simulation results. These include, C. Huntingford (TRIFFID), B. Poulter (LPJ), A. Ahlström, A. Arneth, B. Smith (LPJ-GUESS), M. Lomas (SDGVM), P. Levy (HyLand), S. Levis, G. Bonan (NCAR-CLM4), S. Zaehle (OCN), N. Viovy (Orchidee), and S. Sitch and P. Friedlingstein (project coordinators). We acknowledge D. Miralles (University of Bristol) for access to the GLEAM data set. CRU data were obtained from the University of East Anglia Climate Research Unit (CRU), British Atmospheric Data Centre, 2008, available from http://badc.nerc.ac.uk/data/cru. The GPCP combined precipitation data were developed and computed by the NASA/Goddard Space Flight Centers Laboratory for Atmospheres as a contribution to the GEWEX Global Precipitation Climatology Project. GPCC precipitation data are available from the GPCC homepage: http://gpcc.dwd.de. CPC merged analysis of precipitation data, PREC/L precipitation data, NCEP reanalysis data, UDel air temperature and precipitation data were provided by the NOAA/OAR/ESRL PSD, from their website at http://www.esrl.noaa.gov/psd/. We acknowledge the Global Modeling and Assimilation Office and the GES DISC for the dissemination of MERRA and MERRA-LAND, and the ECMWF for the dissemination of ERA-Interim data. The CFSR data are from the Research Data Archive, which is maintained by the Computational and Information Systems Laboratory at the National Center for Atmospheric Research (NCAR). NCAR is sponsored by the National Science Foundation. The original data are available from the Research Data Archive at the National Center for Atmospheric Research, Computational and Information Systems Laboratory. http://rda.ucar.edu/datasets/ds093.2/. Support for the Twentieth Century Reanalysis Project data set is provided by the US Department of Energy, Office of Science Innovative and Novel Computational Impact on Theory and Experiment (DOE INCITE) program, and Office of Biological and Environmental Research (BER), and by the National Oceanic and Atmospheric Administration Climate Program Office. SRB data were obtained from the NASA Langley Research Center Atmospheric Sciences Data Center NASA/GEWEX SRB Project.
Author information
Author notes
- Brigitte Mueller
Present address: Present address: Climate Research Division, Environment Canada, Toronto, Ontario M3H 5T4, Canada.,
Authors and Affiliations
- Institute for Atmospheric and Climate Science, ETH Zurich, Universitaetsstrasse 16, 8092 Zurich, Switzerland
Peter Greve, Boris Orlowsky, Brigitte Mueller & Sonia I. Seneviratne - Center for Climate Systems Modeling (C2SM), ETH Zurich, Universitaetsstrasse 16, 8092 Zurich, Switzerland
Peter Greve - Department of Civil and Environmental Engineering, Princeton University, Princeton, New Jersey 08544, USA
Justin Sheffield - Max Planck Institute for Biogeochemistry, 07745 Jena, Germany
Markus Reichstein
Authors
- Peter Greve
- Boris Orlowsky
- Brigitte Mueller
- Justin Sheffield
- Markus Reichstein
- Sonia I. Seneviratne
Contributions
P.G., B.O. and S.I.S. designed the study and wrote the manuscript. P.G. performed all computations. B.M. provided support with the collection of evapotranspiration data sets. J.S. and M.R. provided data sets to the study. All authors commented on the manuscript.
Corresponding authors
Correspondence toPeter Greve or Sonia I. Seneviratne.
Ethics declarations
Competing interests
The authors declare no competing financial interests.
Supplementary information
Rights and permissions
About this article
Cite this article
Greve, P., Orlowsky, B., Mueller, B. et al. Global assessment of trends in wetting and drying over land.Nature Geosci 7, 716–721 (2014). https://doi.org/10.1038/ngeo2247
- Received: 11 April 2014
- Accepted: 12 August 2014
- Published: 14 September 2014
- Issue date: October 2014
- DOI: https://doi.org/10.1038/ngeo2247