Counting stem cells: methodological constraints (original) (raw)
Proliferating tissues in the adult body contain a small population of stem cells that establish the system during ontogeny and maintain homeostasis during life. Assessing the number of these stem cells and the extent to which their clonal offspring contribute to tissue regeneration has been a matter of interest and controversy for many decades. Pioneering work on clonal stem cell tracking has been performed in the hematopoietic system and serves as a paradigm for other adult organs. Not only do these analyses provide insight into the function and heterogeneity of hematopoietic stem cells during ontogeny, normal life and aging, they are also important for our understanding of hematopoietic failures, which often have a clonal origin, for instance, in the case of leukemia1,2. Here we discuss the use of genetic marking of hematopoietic stem cells with retro- or lentiviral vectors, followed by transplantation in human or animal recipients, for the purpose of counting stem cells and estimating clonal contribution in the hematopoietic system.
Models of clonal kinetics in hematopoiesis
Discussions of clonality in the hematopoietic system revolve around two main theories: clonal succession and clonal stability (Fig. 1). Although useful, these models over simplify other stem cell properties, such as stochastic or predetermined functional and dynamic heterogeneity. Nevertheless, initial studies aimed at resolving the clonal succession versus stability question, most intensively performed in mice, arrived at variable conclusions: some were in favor of clonal succession3,4,5,6, and other findings were at odds with this theory7,8,9,10. A validation of either model relies on counting clones at different time points, but reports of the number of active clones supporting hematopoiesis have been variable. Early publications described small numbers of active clones in analyzed blood samples3,5, whereas several recent studies report the simultaneous presence of hundreds of viral insertion sites11,12,13,14, generally considered to reflect the number of active clones (Fig. 2). Whereas the few clones found in early publications are often seen as an evidence of clonal succession, most of the recent data incline toward clonal maintenance (although there are some exceptions)14.
Figure 1: Models of clonal kinetics in hematopoiesis.
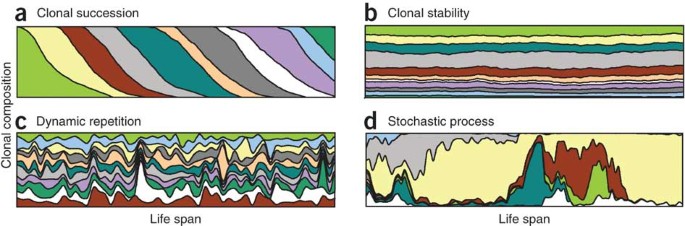
(a) Clonal succession model (colors depict individual clones), which implies that stem cells have intrinsic limits to their repopulating ability and that only few stem cells would contribute to the blood at any given time52. Exhausted clones would be replaced by new, previously dormant, clones. (b) Clonal maintenance model, which implies that many stem cells contribute simultaneously and indefinitely to the blood, which is therefore expected to be highly polyclonal with stable clonal contribution over time7. (c) Dynamic repetition model, in which frequency of stem cell division and their clonal contributions oscillate, thus introducing cycling heterogeneity in clones10. (d) A representation of a case of extreme stochasticity, such that behavior of individual stem cells in a population fluctuates according to stochastic intrinsic and extrinsic signals.
Figure 2: Reports of number of viral integration sites or hematopoietic clonality in multiple studies.
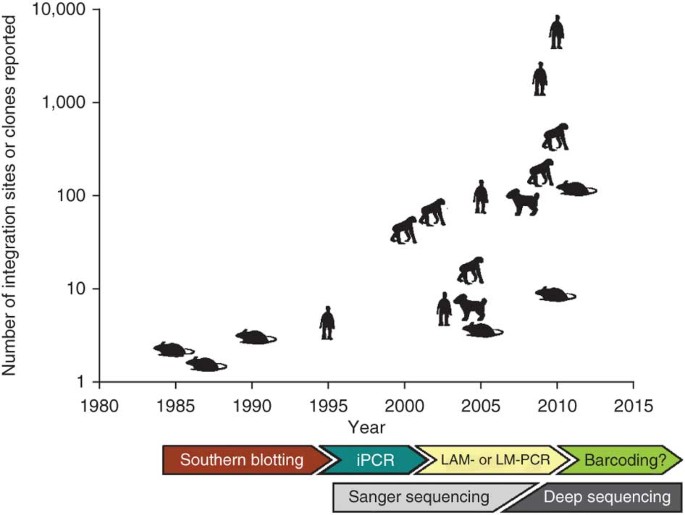
We depict schematically the approximate numbers of detected viral integration sites or predicted transduced cell clones in the blood and/or bone marrow, reported in multiple studies in different species. Readout techniques predominantly used in certain time periods are indicated. iPCR, inverse PCR, LM-PCR, ligation-mediated PCR. The values shown here are not intended to reflect exact numbers, but are typical or average values reported per recipient; data used to generate this figure are in Table 1. For papers where predictions are made for numbers of clones, we plot these predicted values.
Table 1 Estimates of clonality in the hematopoietic system in representative studies
Counting stem cells by retroviral DNA tagging
Retroviral transduction strategies were initially developed to insert a transgene into the genome of deficient cells. More recently, the detection of viral integration sites in genomic DNA has also been used to count stem cell clones. Various methods have been used to identify the unique genetic mark left by the integrating viral vector, allowing the identification of single stem cell–derived clones in the transplant recipient (Fig. 3). In general terms, the protocols include fragmentation of genomic DNA isolated from transplanted cells followed by PCR amplification of the sequence adjacent to the vector integration site. In early studies, variation in PCR-amplified products was assessed by gel electrophoresis. These studies typically reported a small number of insertions (Fig. 2). Currently, most advanced methods require digestion of genomic DNA with multiple restriction enzymes followed by PCR-based amplification of integration site flanking sequences and high-throughput sequencing12,13,15. In some recent studies many viral insertion sites have been detected, for instance, as reported in studies of human gene therapy patients (1,380–9,659 integration sites)12,13 as well as in studies of dogs11 and mice14. These numbers of viral insertion sites may be interpreted to mean that the hematopoietic system is highly polyclonal. However, techniques used to count clones have limitations, as do all experimental methods: they have detection limits, and sequencing or mapping errors can hamper identification and discrimination of genetic marks.
Figure 3: Strategies for identifying retroviral tags for clonal analysis.
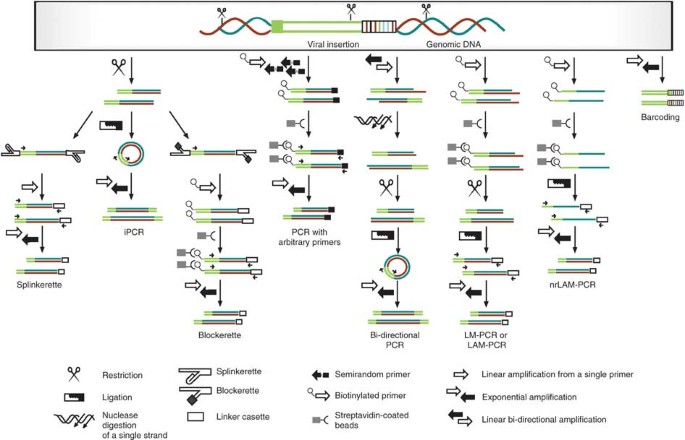
Shown is a schematic of the experimental steps in clonal analysis of retrovirally tagged cells: splinkerette PCR53, inverse PCR54, blockerette-ligated capture PCR55,56, PCR with arbitrary primers17, bi-directional PCR (one of two described experimental setups in shown)22, LAM-PCR or LM-PCR27,30, nrLAM-PCR16 and cellular barcoding18.
We argue that technical aspects of the methods used to assess clonal contribution could affect the number of estimated active hematopoietic stem cell clones. In particular we address: (i) dependency of most methods on restriction endonucleases; (ii) bias in PCR-amplification of DNA fragments of variable length; (iii) insufficient depth of high-throughput sequencing and (iv) inappropriate filtering of false positive high-throughput sequencing results. In addition, biological questions such as functional heterogeneity and formal definitions of stem cells also influence the conclusions of clonal studies.
Optimal choice of restriction enzymes and PCR bias
With the exception of nonrestrictive linear amplification–mediated PCR (nrLAM-PCR)16, PCR with arbitrary primers17 and barcoding18, methods for detecting viral integration sites, and hence for identifying virally tagged clones, require digestion of genomic DNA with restriction enzymes. As has recently been discussed in several papers16,19,20,21, insufficient attention to the selected restriction enzymes (and the frequency of corresponding restriction sites) will mean that genomic fragments in which restriction sites are rare will not be properly digested, and viral integration in these regions will remain undetected. Only ∼100–500-base-pair fragments will be subsequently amplified by PCR, whereas longer fragments will be underrepresented16,19,20,21,22 or completely absent in the resulting data.
In an attempt to systematically characterize whether such problems are widespread in the literature, we analyzed papers reporting clonal analysis in the hematopoietic system over the past 10 years and retrospectively determined the expected odds of detection of a clone based on the restriction enzymes used (Supplementary Table 1). We performed an in silico restriction digestion of the mouse and human genomes and identified the effective window of fragment sizes in which PCR amplification would enable detection of a particular viral integration site (Fig. 4). We assumed 1,000 base pairs as the maximum size of an amplifiable restricted fragment. In case of bi-directional PCR, the most recently described method, each integration site will then be situated 500 base pairs or closer to one of restriction sites in adjacent genomic DNA22. We assumed 20 base pairs to be the minimal fragment size that can be mapped by a Basic Local Alignment Search tool (BLAST) search. Using this size window, we determined for each enzyme the fraction of genomic DNA that can be cut for further amplification. We used a custom-written R script to perform virtual restrictions with a range of selected enzymes. We sorted the results in bins by fragment length and counted frequencies per bin. It is evident that, for many restriction enzymes, a large percentage of the genome lacks appropriate restriction sites and therefore remains inaccessible to interrogation. For instance, only 2–13% of all DNA fragments are accessible for amplification and sequence analysis upon digestion with MaeII23, TaiI24 or TaqI25.
Figure 4: Predicted PCR amplification efficiency of genomic fragments digested with different enzymes.
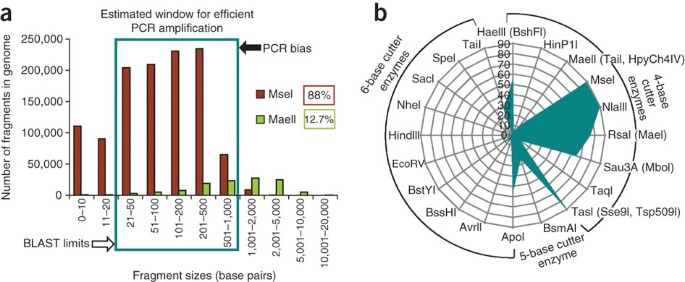
(a) Results of an in silico DNA restriction digest of mouse genome with MseI and MaeII. The boxed region indicates an effective PCR-amplification window, using upper (determined by PCR bias) and lower (determined by BLAST limitations) thresholds. The fraction of the genome found within the effective window defines genome accessibility. MseI will ensure 88% of genome accessibility and MaeII, 12.7%. (b) Genome accessibility percentage for every enzyme used for viral integration-site analysis.
As others have also discussed16,20, our in silico analysis revealed that 5- or 6-base cutter enzymes have too low a frequency of genome-wide restriction to be useful for integration-site analysis, and therefore their use should be avoided. In contrast, restriction with 4-base cutter enzymes such as TasI24,26, Sse9I27, Tsp509I28,29,30 is predicted to result in more than 85% of all fragments being accessible for PCR and sequence analysis (Fig. 4b). However, it should be noted that among 4-base cutter enzymes, differences in restriction frequencies are quite large16. (C+G)-containing palindromes occur with the lowest frequency, and (A+T)-rich palindromes occurred most frequently among all possible 4-base restriction sites, which reflects the nonrandom structure of genomic DNA16,31,32,33.
Enzymes for multi-arm DNA restriction
Several authors have attempted to empirically improve restriction-based methods by using combinations of restriction enzymes20. For instance, Biasco et al.34 showed that restriction with one enzyme (MseI) retrieved only 2–6% of integration sites compared to all sites retrieved with a mixture of four restriction enzymes (also including MseI). Our simulations confirmed that multi-arm approaches suggested by Harkey et al.20 and Wang et al.13 improved the accessibility of the genomic fragments from approximately 80% to 95%.
Strategies to select combinations of restriction enzymes have been proposed; for example, Gabriel et al.16 have suggested starting with the most frequent cutter and adding the next best cutter and so on, to increase coverage of the accessible genome. However, with any particular choice of restriction enzymes attention should be paid to the similarities between sequences in each selected restriction site. A balanced combination of subsequences presented in the sites of selected restriction enzymes is recommended. A good illustration as to why this is important is the case of (G+C)-rich regions: although (A+T)-rich restriction enzymes are more efficient than (G+C)-rich restriction enzymes genome-wide, they are inefficient in (G+C)-rich regions, which frequently occur in promoters and are potential loci for retroviral integrations.
In Figure 5 we present one example of such a combination: every four-nucleotide restriction site has its first two nucleotides reverse-complemented by the last two nucleotides such that 16 possible palindromes can be created in total. Three sets of dinucleotides are included in each palindrome; for instance, AATT contains AA, AT and TT. If we do not want to avoid DNA loci that are either enriched for or missing any particular dinucleotide combination, the rational approach would be to ensure that the selected combination of restriction enzymes recognizes sites that include as many dinucleotides as possible. Note that 5- or 6-base cutter enzymes will target a subset of sequences that are recognized by a 4-base cutter enzyme with a similar recognition specificity, limited by additional outer nucleotide(s) in the recognition site. For instance, the enzyme ApoI (recognition site RAATTY) can cut 4 × 4 / 2 = 8 times fewer DNA sequences than restriction enzyme TasI (recognition site AATT) (Fig. 5b; restriction set of Wang et al.13). Of course, optimal combinations of enzymes must be selected for each individual experiment (the restriction site must be present in the integrated viral sequence, and at sufficient distance from the end of the long terminal repeat to allow vector recognition). We provide an Excel-based script to help analyze any combination of 4-base restriction enzymes (Supplementary Table 2).
Figure 5: Combinatorial strategy to select optimal combination of restriction enzymes.
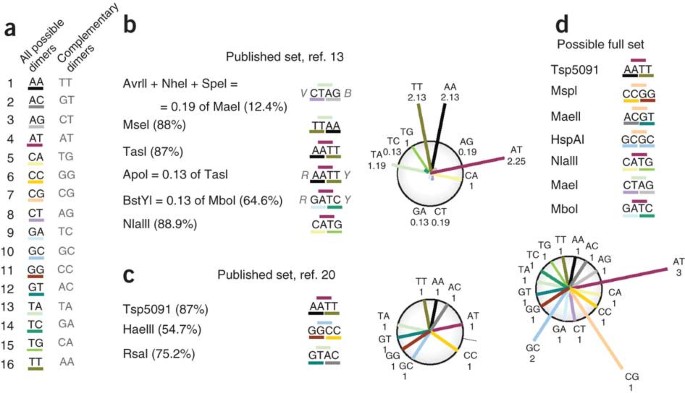
(a) The sixteen possible recognition sites for 4-base cutter restriction enzymes. (b,c) Analysis of combinations of dinucleotides present in enzyme mixtures in ref. 13 (b) and ref. 20 (c). The two circular diagrams depict the estimated efficiency with which each of the 16 dinucleotides will be recognized by the used enzyme mixture. Dinucleotides that are not shown in the circular diagram are not recognized. (d) Set of restriction enzymes that will cover all possible dimer combinations and cut 98% of the genome.
Sequencing depth, data validation and clonal counts
A critical part of integration-site analysis is identification of the location of the insert, now typically done by deep sequencing of PCR-amplified fragments. This type of analysis is invaluable in understanding genomic integration preferences of viral vectors as well as their possible impact on the dysregulation of adjacent genes. Quantitative implementation of this method to count clones, however, is fraught with potential technical problems.
If sequencing depth is low, many clones may escape detection, and read frequency is no longer reliable for discriminating true and false integration sites. Moreover, detection of a single sequence read is insufficient evidence for stem-cell presence: a single read is by definition present only in a single cell type and therefore cannot demonstrate robust repopulating potential in different blood lineages. Restriction and ligation–based approaches also carry the risk of accidental re-ligation of irrelevant DNA fragments, which may be misinterpreted as unique integration sites, although methods have been designed to prevent such events35. Contamination of samples is another source of inconsistent reads; several papers have reported so-called 'collision reads'—identical insertion sites detected in samples from different individuals—that resulted from cross-contamination between samples12,21. Barcoded primers can identify cross-contamination in the sequencing facility except if it occurs before PCR amplification.
To compensate for low sequencing depth and limited overlap of sequence data from repeat samples, a recapture concept (first suggested by Kim et al.25) has been used13. This approach presumes that partial overlap of data acquired from the same donor tested multiple times is due to the high numbers of clones in the samples, such that only a subset of clones is detected in each case. Based on the frequency of sites detected in one or multiple samples, the total number of clones is estimated. However, this type of prediction must take potential technical errors into account. Noisy and shallow sequencing of repeatedly analyzed samples could boost the predicted clonality to several thousands, leading to an overestimation of stem cell numbers.
In our opinion, insufficient attention is sometimes paid to the reporting and validation of sequence reads for clonal studies. Approaches used to prefilter raw sequence data, to identify integration sites and to determine mapping accuracy are quite variable (Supplementary Table 3). Most reports do not contain primary sequencing results, making re-analysis impossible. To properly interpret stem-cell clonality data based on sequence analysis, detailed information on sequence statistics, analysis algorithms and a summary of sequence data are required, as provided for instance in ref. 13. It is important to report the number and frequencies of unique reads as well as their measure of uniqueness (sequence differences between all reads with respect to the number of single polymorphisms). Instead, many authors compare sample read sequence with a reference genome and discard integration sites that cannot be uniquely mapped; however, unmappable reads may be true and valid. Integration-site analysis could be improved by increasing sequencing depth and introducing robust criteria for noise discrimination, similar to those applied in analyses of data from chromatin immunoprecipitation followed by high-throughput sequencing.
Clonal analysis with DNA barcodes
We and others have used cellular barcoding techniques to estimate clonal complexity in blood and other tissues18,36,37,38,39. The basic idea of barcoding is to create a cell-specific unique DNA mark that can be used to identify clones. Barcodes should be of equal size in all cells, be identified by uniform primers, resist PCR bias, be sufficiently unique to allow unequivocal identification and also resist cross contamination owing to naturally occurring sequence read errors. Recently we described hematopoietic stem cell barcoding based on the introduction of a semi-random tag in a retroviral vector18 followed by direct sequencing of barcoded fragments. When properly done, this approach can avoid several of the technical problems described above; in particular, barcode analysis avoids problems with restriction-enzyme choice and random ligand attachment.
A critical aspect of successful cellular barcoding is the uniqueness of each tag: this depends on the total number of possible barcode variations, the real number of barcode variations in the vector libraries, and the number of clonogenic cells to be barcoded and transplanted. If the barcode sequence is based on random nucleotide synthesis, the theoretical number of possible combinations should be several orders of magnitude above the real barcode library size to ensure good randomization and uniqueness (which must also be confirmed experimentally). For proper interpretation of the data, it is imperative to validate the initial barcoded vector library size and avoid excessive biases in the barcode frequency distribution. Effective library size may otherwise be dramatically reduced to a few dominant barcodes. As a simple rule, the size of the library should exceed the number of clonogenic cells subjected to analysis, with a 10:1 ratio of barcodes to target cells resulting in >90% of uniquely labeled cells. Finally, to correct for multiple vector insertions, distribution of the number of barcodes per individual stem cell must be assessed as part of the analysis.
If these conditions are met, viral barcoding can be used to measure clonal contributions in a quantitative manner. Owing to the compact size of typical barcodes, the approach is amenable to readout using deep sequencing platforms. As for the analysis of viral integration sites, however, several important technical aspects must be considered. True and false (noise-borne) barcodes in the analyzed blood sample can be most easily distinguished on the basis of cross-comparison with the barcode vector library. A full report of the library in publications is therefore desirable; knowledge of its size and the identity of all barcodes are crucial for the success of the barcode analysis. Second, sequence analysis must address the origin of single-nucleotide mutants and the frequency of mutations. False barcodes that result from errors during PCR and sequencing will most frequently differ from true barcodes by one substitution or insertion-deletion and will have considerably lower frequencies. These mutant reads can be detected by cross-alignment with the library of barcodes sequenced before stem-cell transduction and removed if necessary. For example, we sequenced barcodes extracted from a mixture of five clonally expanded cells (Fig. 6). Of the 1,503 different barcodes we recovered in the sample, six barcodes represented the five original clones. We could discriminate noise from real barcodes based on the frequencies of the barcode sequences. We remove single reads from our analyses because they frequently correspond to false barcodes. Although the occurrence of mutant ('false') barcode sequences is usually within the lowest 5% of all reads, calculations of stem-cell clone numbers can differ substantially (between 10- and 1,000-fold) before and after removing such false tags. It is of interest to note that when Biffi et al.40, in their clinical study using vector-integration-site analysis, removed 2% of the sequences with the lowest frequencies, their total clonal count dropped substantially. Similarly, Cavazzana-Calvo et al.15 in a comparable study showed that kinetics of the most frequent 16 integration sites could be followed in time with 100% overlap.
Figure 6: Clonal analysis in barcoded cells.
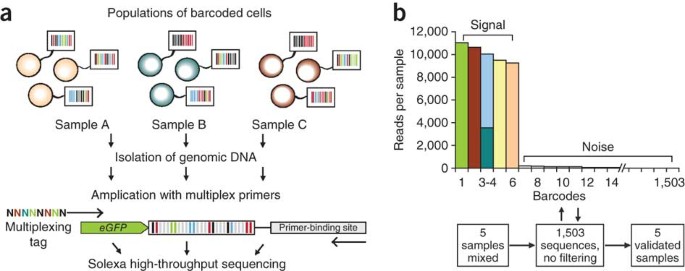
(a) Schematic of the setup for a multiplex barcoding experiment. To read the barcodes in transduced hematopoietic cells, genomic DNA is extracted and amplified with tagged primers against an internal vector sequence. A library of tagged multiplex primers allows several hundred blood or bone marrow samples to be individually labeled. These samples are then pooled and subjected to Solexa high-throughput sequencing. (b) Signal/noise discrimination based on barcode frequency. A mixture of five uniquely barcoded clones (four clones singly barcoded, one clone doubly barcoded) was sequenced. Different colors in the frequency histogram indicate different barcodes.
In our experience, clonal kinetics are quite slow in mice, barcode sequences are highly consistent in samples taken at consecutive time points, and only a few stem cells actively contribute to hematopoiesis. Early time points after transplantation are typically characterized by a wide spectrum of barcodes in both granulocytes and T cells but the signature becomes smaller and more stable at later time points (Fig. 7).
Figure 7: Clonal kinetics in mice transplanted with barcoded cells.
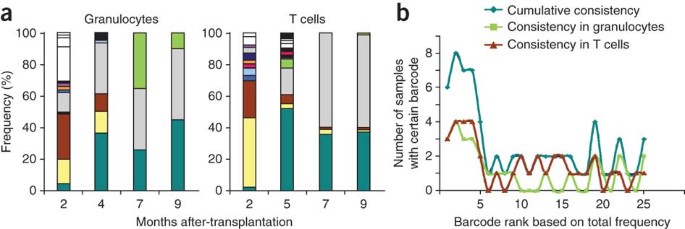
(a) An example of clonal fluctuations in blood samples taken from one mouse transplanted with retrovirally barcoded bone marrow cells (as described previously18). We analyzed 8 samples (4 time points × 2 cell types). Colors indicate individual barcodes. (b) An analysis of the occurrence in the eight analyzed blood samples of the 25 most frequently observed barcodes.
Stem cell heterogeneity
Counting stem cells is affected not only by technical constraints; there are biological considerations that are critical for the interpretation of such studies. Although these have not been the focus of our discussion, a few points are worth noting because analysis of clonal contribution can be interpreted differently depending on the prevailing stem cell definition. The very criteria used to define hematopoietic stem cells are subject to continuous discussion. True 'stemness' can only be confirmed retrospectively by the ability of the cell to achieve robust, long-term multilineage repopulation of an irradiated recipient. Usually, to confirm the presence of a stem cell, several conditions must be met. First, the progeny of a cell must be detected in blood for an extended time (the threshold for separating stem cells from progenitors is currently set at 4 months after transplantation). Second, a stem cell clone must be seen to contribute to several blood lineages; myeloid, T and B cells are usually analyzed. Of those, only short-lived cells, for example, granulocytes, reflect recent proliferative activity in the bone marrow. Mature lymphoid cells, in contrast, can persist in blood for an extended time after exhaustion of corresponding precursor cells. Therefore, using only total blood or lymphoid chimerism as a criterion may lead to an overestimation of stem-cell counts. A third parameter is the robustness of hematopoietic reconstitution. In single-cell transplantation studies, bona fide stem cells should reconstitute more than 1% of the blood of recipients. The presence of an occasional donor-derived blood cell is not sufficient to claim stem-cell activity. Finally, especially because the volume of blood aliquots used for clonal analysis is small relative to the total volume of blood, it is critical that genomic DNA is efficiently extracted and analyzed to ensure representative and reproducible results.
Several recent studies have demonstrated heterogeneity of hematopoietic stem cell (HSC) behavior in terms of their repopulation potential, lineage output and turnover rate (reviewed elsewhere41,42,43) and this can constrain the discovery of all clones. Strict cutoff values for chimerism levels in a limited time interval, as we described above, could preclude detection of particular HSC types irrespective of the readout technique used, because not all progeny of a clone may be present at a single time point in a polyclonally reconstituted animal. Limiting the readout time to 4 months after transplant could also result in exclusion of quiescent HSCs from analysis44,45. The general implications of HSC heterogeneity for experimental design are that samples must be collected over a considerable time interval, that different cell lineages must be assessed and that data must be cross-checked for the presence of common clones (a good example of such an analysis is in ref. 13).
How many stem cell clones do we actually expect?
In general, it is ill-advised to rely on a single approach to count stem cells; limiting dilution of bone marrow followed by transplant is an alternative approach. In the mouse, this approach has shown that there are ∼2–8 stem cells per 105 freshly isolated bone marrow cells7,8,46,47. In 5-fluoruracil–treated bone marrow this frequency increases to 1 in 2,000 (refs. 47,48). However, ex vivo expansion, transduction and transplantation procedures lead to loss of stem cells and need to be taken into consideration in interpreting these experiments. Specifically, we observe a 1 to 2-log loss of stem cell frequency due to cell sorting, ex vivo stem cell manipulation and culturing in limiting dilution experiments. With these considerations, by transplanting 2 × 10⁶ to 5 × 10⁶ 5-fluoruracil–treated, retrovirally transduced bone marrow cells into recipient mice after a three- to tenfold expansion in culture, the expected clone numbers would be 1–10 per recipient, quite close to what we observe in our experiments with barcoded cells18.
In humans, the frequency of stem cells has been estimated to be 1–4 stem cells per 107 mononuclear cells or 5–100 stem cells per 107 CD34+ cells24,49,50 based on limiting dilution of bone marrow in non-obese diabetic severe combined immunodeficient (NOD/SCID) mice, and capture and release calculations. Children in gene-therapy trials are transplanted with 5–10 × 106 CD34+ cord blood cells per kilogram body weight51. If stem cell loss resulting from experimental manipulation is close to what we observe in mouse studies, the final number of stem cells is likely to be less than 1 stem cell per 2 million CD34+ cells, or 3–5 stem cells per kilogram of body weight. These estimates are several orders of magnitude lower than the numbers of integration sites detected in human recipients receiving a transplant. An interpretation of these numbers as reflective of polyclonality should therefore be taken with caution, and additional experiments will be required to resolve this discrepancy.
Concluding remarks
We discussed the use of retroviral labeling to count the number of active hematopoietic stem cells and argued that technical constraints can undermine the reliability of these measurements and yield variable stem cell counts. Any method used for a quantitative application in molecular biology should meet two fundamental requirements, namely calibration and noise discrimination, which will define the dynamic range and detection limits of the method. In our view, an advantage of cellular barcoding for stem-cell counting is that it allows calibration of dynamic range, can test detection limits with respect to the physical size of the sample and the detectable number of barcodes it contains, and permits identification of false positives by sequence comparison of samples with a reference library. It should be noted, however, that retroviral cell labeling and cell transplantation are experimental perturbations. Although these approaches capitalize on the natural abilities of HSCs to home, self-renew and differentiate, caution is warranted as to how observations made using these techniques relate to normal hematopoiesis.
Hematopoiesis may include stochastic components for which multiple dynamic scenarios are possible, such that clonal succession or clonal stability are two extreme outcomes of a range of possibilities. Future studies are likely to focus on describing the full spectrum of scenarios and estimating the likelihood at which they occur. With the rapid development of sequencing technologies, it is likely that whole-genome sequencing for clonality studies will soon offer a realistic alternative for some of the approaches we have discussed here. Future experiments are likely to exploit induced or naturally occurring barcode-like sequence variations to improve our understanding of clonal dynamics of multicellular systems.