BoxPlotR: a web tool for generation of box plots (original) (raw)
- Correspondence
- Published: 30 January 2014
Nature Methods volume 11, pages 121–122 (2014)Cite this article
- 67k Accesses
- 127 Altmetric
- Metrics details
Subjects
To the Editor
Despite the obvious advantages of the box plot for simultaneous representation of data set and statistical parameters, this method is not in common use, in part because few available software tools allow the facile generation of box plots. For example, the standard spreadsheet tool Excel is unable to generate box plots. Here we describe an open-source application, called BoxPlotR, and an associated web portal that allow rapid generation of customized box plots. A user-defined data matrix is uploaded as a file or pasted directly into the application to generate a basic box plot with options for additional features. Sample size may be represented by the width of each box in proportion to the square root of the number of observations5. Whiskers may be defined according to the criteria of Spear1, Tukey2 or Altman3. The underlying data distribution may be visualized as a violin or bean plot or, alternatively, the actual data may be displayed as overlapping or nonoverlapping points. The 95% confidence interval that two medians are different may be illustrated as notches defined as ±(1.58 × IQR/√n) (ref. 5). There is also an option to plot the sample means and their confidence intervals. More complex statistical comparisons may be required to ascertain significance according to the specific experimental design6. The output plots may be labeled; customized by color, dimensions and orientation; and exported as publication-quality .eps, .pdf or .svg files. To help ensure that generated plots are accurately described in publications, the application generates a description of the plot for incorporation into a figure legend.
This is a preview of subscription content, access via your institution
Access options
Subscribe to this journal
Receive 12 print issues and online access
$259.00 per year
only $21.58 per issue
Buy this article
- Purchase on SpringerLink
- Instant access to full article PDF
Prices may be subject to local taxes which are calculated during checkout
Additional access options:
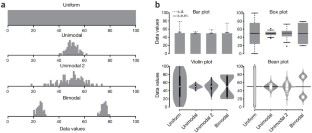
Figure 1: Data visualization with box plots.
References
- Spear, M.E. Charting Statistics (McGraw-Hill, 1952).
Google Scholar - Tukey, J.W. Exploratory Data Analysis (Addison-Wesley, 1977).
Google Scholar - Altman, D.G. Practical Statistics for Medical Research (Chapman and Hall, 1991).
Google Scholar - Kampstra, P. J. Stat. Softw. 28, c01 (2008).
Article Google Scholar - McGill, R., Tukey, J.W. & Larsen, W.A. Am. Stat. 32, 12–16 (1978).
Google Scholar - Nieuwenhuis, S., Forstmann, B.U. & Wagenmakers, E.J. Nat. Neurosci. 14, 1105–1107 (2011).
Article CAS Google Scholar - Ihaka, R. & Gentleman, R. J. Comput. Graph. Stat. 5, 299–314 (1996).
Google Scholar
Acknowledgements
This work was supported by the Wellcome Trust through a Senior Research Fellowship to J.R. (084229), a core grant to the Wellcome Trust Centre for Cell Biology (092076), a European Research Council grant (233457) to M.T., a Genome Québec International Recruitment Award to M.T. and a Canada Research Chair in Systems and Synthetic Biology to M.T.
Author information
Author notes
- Michaela Spitzer
Present address: Present address: Michael G. DeGroote Institute for Infectious Disease Research, McMaster University, Hamilton, Ontario, Canada.,
Authors and Affiliations
- Wellcome Trust Centre for Cell Biology, School of Biological Sciences, University of Edinburgh, Edinburgh, UK
Michaela Spitzer, Jan Wildenhain, Juri Rappsilber & Mike Tyers - Department of Biotechnology, Technische Universität Berlin, Berlin, Germany
Juri Rappsilber - Department of Medicine, Institute for Research in Immunology and Cancer, Université de Montréal, Montréal, Québec, Canada
Mike Tyers
Authors
- Michaela Spitzer
You can also search for this author inPubMed Google Scholar - Jan Wildenhain
You can also search for this author inPubMed Google Scholar - Juri Rappsilber
You can also search for this author inPubMed Google Scholar - Mike Tyers
You can also search for this author inPubMed Google Scholar
Corresponding authors
Correspondence toJuri Rappsilber or Mike Tyers.
Ethics declarations
Competing interests
The authors declare no competing financial interests.
Rights and permissions
About this article
Cite this article
Spitzer, M., Wildenhain, J., Rappsilber, J. et al. BoxPlotR: a web tool for generation of box plots.Nat Methods 11, 121–122 (2014). https://doi.org/10.1038/nmeth.2811
- Published: 30 January 2014
- Issue Date: February 2014
- DOI: https://doi.org/10.1038/nmeth.2811