A comparative genomics multitool for scientific discovery and conservation (original) (raw)
Main
The genomics revolution is enabling advances not only in medical research1, but also in basic biology2 and in the conservation of biodiversity, where genomic tools have helped to apprehend poachers3 and to protect endangered populations4. However, we have only a limited ability to predict which genomic variants lead to changes in organism-level phenotypes, such as increased disease risk—a task that, in humans, is complicated by the sheer size of the genome (about three billion nucleotides)5.
Comparative genomics can address this challenge by identifying nucleotide positions that have remained unchanged across millions of years of evolution6 (suggesting that changes at these positions will negatively affect fitness), focusing the search for disease-causing variants. In 2011, the 29 Mammals Project7 identified 12-base-pair (bp) regions of evolutionary constraint that in total comprise 4.2% of the genome, by measuring sequence conservation in humans plus 28 other mammals. These regions proved to be more enriched for the heritability of complex diseases than any other functional mark, including coding status8. By expanding the number of species and making an alignment that is independent of any single reference genome, the Zoonomia Project was designed to detect evolutionary constraint in the eutherian lineage at increased resolution, and to provide genomic resources for over 130 previously uncharacterized species.
Designing a comparative-genomics multitool
When selecting species, we sought to maximize evolutionary branch length, to include at least one species from each eutherian family, and to prioritize species of medical, biological or biodiversity conservation interest. Our assemblies increase the percentage of eutherian families with a representative genome from 49% to 82%, and include 9 species that are the sole extant member of their family and 7 species that are critically endangered[9](/articles/s41586-020-2876-6#ref-CR9 "IUCN. The IUCN Red List of Threatened Species. Version 2019-2 http://www.iucnredlist.org
(2019).") (Fig. [1](/articles/s41586-020-2876-6#Fig1)): the Mexican howler monkey (_Alouatta palliata mexicana_), hirola (_Beatragus hunteri_), Russian saiga (_Saiga tatarica tatarica_), social tuco-tuco (_Ctenomys sociabilis_), indri (_Indri indri_), northern white rhinoceros (_Ceratotherium simum cottoni_) and black rhinoceros (_Diceros bicornis_).Fig. 1: The Zoonomia Project brings the fraction of eutherian families that are represented by at least one assembly to 83%.
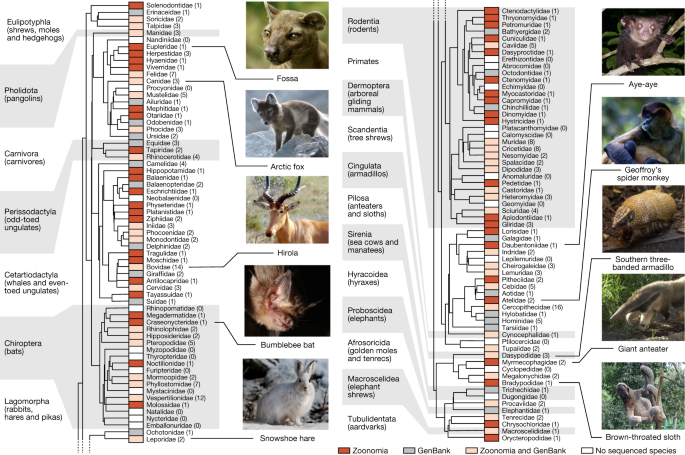
Phylogenetic tree of the mammalian families in the Zoonomia Project alignment, including both our new assemblies and all other high-quality mammalian genomes publicly available in GenBank when we started the alignment (March 2018) (Supplementary Table 2). Tree topology is based on data from TimeTree (www.timetree.org)47. Existing taxonomic classifications recognize a total of 127 extant families of eutherian mammal48, including 43 families that were not previously represented in GenBank (red boxes) and 41 families with additional representative genome assemblies (pink boxes). Of the remaining families, 21 had GenBank genome assemblies but no Zoonomia Project assembly (grey boxes) and 22 had no representative genome assembly (white boxes). Parenthetical numbers indicate the number of species with genome assemblies in a given family. Image credits: fossa, Bertal/Wikimedia (CC BY-SA); Arctic fox, Michael Haferkamp/Wikimedia (CC BY-SA); hirola, JRProbert/Wikimedia (CC BY-SA); bumblebee bat, Sébastien J. Puechmaille (CC BY-SA); snowshoe hare, Denali National Park and Preserve/Wikimedia (public domain); aye-aye, Tom Junek/Wikimedia (CC BY-SA); Geoffroy’s spider monkey, Patrick Gijsbers/Wikimedia (CC BY-SA); southern three-banded armadillo, Hedwig Storch/Wikimedia (CC BY-SA); giant anteater, Graham Hughes/Wikimedia (CC BY-SA); brown-throated sloth, Dick Culbert from Gibsons, B.C., Canada/Wikimedia (CC BY).
We collaborated with 28 institutions to collect samples, nearly half (47%) of which were provided by The Frozen Zoo of San Diego Zoo Global (Supplementary Table 1). Since 1975, The Frozen Zoo has stored renewable cell cultures for about 10,000 vertebrate animals that represent over 1,100 taxa, including more than 200 species that are classified as vulnerable, endangered, critically endangered or extinct by the International Union for Conservation of Nature (IUCN)10. For 36 target species we were unable to acquire a DNA sample of sufficient quality, even though our requirements were modest (Methods), which highlights a major impediment to expanding the phylogenetic diversity of genomics.
We used two complementary approaches to generate genome assemblies (Extended Data Table 1). First, for 131 genomes we generated assemblies by performing a single lane of sequencing (2× 250-bp reads) on PCR-free libraries and assembling with DISCOVAR de novo11 (referred to here as ‘DISCOVAR assemblies’). This method does not require intact cells and uses less than two micrograms of medium-quality DNA (most fragments are over 5 kilobases (kb) in size), which allowed us to include species that are difficult to access (Extended Data Figs. 1, 2) while achieving ‘contiguous sequences constructed from overlapping short reads’ (contig) lengths comparable to those of existing assemblies (median contig N50 of 46.8 kb, compared to 47.9 kb for Refseq genome assemblies).
For nine DISCOVAR assemblies and one pre-existing assembly (the lesser hedgehog tenrec (Echinops telfairi)), we increased contiguity 200-fold (the median scaffold length increased from 90.5 kb to 18.5 megabases (Mb)) through proximity ligation, which uses chromatin interaction data to capture the physical relationships among genomic regions12. Unlike short-contiguity genomes, these assemblies capture structural changes such as chromosomal rearrangements13. The upgraded assemblies increase the number of eutherian orders that are represented by a long-range assembly (contig N50 > 20 kb and scaffold N50 > 10 Mb) from 12 to 18 (out of 19). We are working on upgrading the assembly of the large treeshrew (Tupaia tana) for the remaining order (Scandentia).
Comparative power of 240 species
The Zoonomia alignment includes 120 newly generated assemblies and 121 existing assemblies, representing a total of 240 species (the dataset includes assemblies for two different dogs) and spanning about 110 million years of mammalian evolution (Supplementary Table 2). With a total evolutionary branch length of 16.6 substitutions per site, we expect only 191 positions in the human genome (0.000006%) to be identical across the aligned species owing to chance (false positives) rather than evolutionary constraint (Extended Data Table 2). We applied this same calculation to data from The Exome Aggregation Consortium (ExAC)—who analysed exomes for 60,706 humans14—and estimated that 88% of positions would be expected to have no variation. This illustrates the potential for relatively small cross-species datasets to inform human genetic studies—even for diseases driven by high-penetrance coding mutations, for which ExAC data are optimally powered15.
Biological insights from additional assemblies
The scope and species diversity in the Zoonomia Project supports evolutionary studies in many lineages. Previously published papers (discussed in the subsections below), and the demonstrated utility of existing comparative genomics resources16,17, illustrate the benefits of making newly generated genome assemblies and alignments accessible to all researchers without restrictions on use.
Speciation
Comparing our assembly for the endangered Mexican howler monkey (Alouatta palliata mexicana, a subspecies of the mantled howler monkey) with the Guatemalan black howler monkey (Alouatta pigra)—which has a neighbouring range—suggests that different forms of selection shape the reproductive isolation of the two species18. Initial divergence in allopatry was followed by positive selection on postzygotic isolating mechanisms, which offers empirical support for a speciation process that was first outlined by Dobzhansky in 193519.
Protection from cancer
Using our assembly for the capybara (Hydrochoerus hydrochaeris) (a giant rodent), a previous publication[20](/articles/s41586-020-2876-6#ref-CR20 "Herrera-Álvarez, S., Karlsson, E., Ryder, O. A., Lindblad-Toh, K. & Crawford, A. J. How to make a rodent giant: genomic basis and tradeoffs of gigantism in the capybara, the world’s largest rodent. Preprint at https://doi.org/10.1101/424606
(2018).") has identified positive selection on anti-cancer pathways, echoing previous reports[21](/articles/s41586-020-2876-6#ref-CR21 "Abegglen, L. M. et al. Potential mechanisms for cancer resistance in elephants and comparative cellular response to DNA damage in humans. J. Am. Med. Assoc. 314, 1850–1860 (2015).") that other large mammal species—the African and Asian elephants (_Loxodonta africana_ and _Elephas maximus indicus_, respectively) —carry extra copies (retrogenes) of the tumour-suppressor gene _TP53_. This offers a possible resolution to Peto’s paradox—the observation that cancer in large mammals is rarer than expected—and could reveal anti-cancer mechanisms.Convergent evolution of venom
A previous publication22 has used our assembly for the Hispaniolan solenodon (Solenodon paradoxus) (Extended Data Fig. 2) to investigate venom production—a trait that is found in only a few eutherian lineages, including shrews and solenodons. They identified paralogous copies of a kallikrein 1 serine protease gene (KLK1) that together encode solenodon venom, and showed that the KLK1 gene was independently co-opted for venom production in both solenodons and shrews, in an example of molecular convergence.
Informing biodiversity conservation strategies
A previous analysis23 of our giant otter (Pteronura brasiliensis) assembly found low diversity and an elevated burden of putatively deleterious genetic variants, consistent with the recent population decline of this species through overhunting and habitat loss. The giant otter had fewer putatively deleterious variants than either the southern or northern sea otter (Enhydra lutris nereis and E. lutris kenyoni, respectively), which suggests that it has highest potential for recovery among these species if populations are protected.
Rapid assessment of species infection risk
Using the Zoonomia alignment and public genomic data from hundreds of other vertebrates, a previous publication24 compared the structure of ACE2—the receptor for severe acute respiratory syndrome coronavirus 2 (SARS-CoV-2), the causative agent of coronavirus disease 2019 (COVID-19)—and identified 47 mammals that have a high or very high likelihood of being virus reservoirs, intermediate hosts or good model organisms for the study of COVID-19, and detected positive selection in the ACE2 receptor-binding domain that is specific to bats.
Genetic diversity and extinction risk
We next asked whether a reference genome from a single individual can help to identify populations with low genetic diversity to prioritize in efforts to conserve biodiversity. Diversity metrics reflect demographic history25,26, and heterozygosity is lower in threatened species27. This analysis was feasible because we used a single sequencing and assembly protocol for all DISCOVAR assemblies, which minimized variation in accuracy, completeness and contiguity due to the sequencing technology and the assembly process that would otherwise confound species comparisons.
We estimated genetic diversity for 130 of our DISCOVAR assemblies, each of which represented a different species (Supplementary Table 3). Four of these estimates failed during analysis. For the remaining 126 DISCOVAR assemblies, we calculated 2 metrics: (1) the fraction of sites at which the sequenced individual is heterozygous (overall heterozygosity); and (2) the proportion of the genome that resides in an extended region without any variation (segments of homozygosity (SoH)). The SoH measurement is designed for short-contiguity assemblies, in which scaffolds are potentially shorter than runs of homozygosity. Overall, heterozygosity and SoH values are correlated (Pearson correlation r = −0.56, P = 1.8 × 10⁻⁹, n = 98). Although overall heterozygosity is correlated with contig N50 values (Pearson correlation _r_het = −0.39, _P_het = 4 × 10⁻⁵, _n_het = 105) (probably owing to the difficulty of assembling more heterozygous genomes28), SoH values are not (Pearson correlation _r_SoH = 0.09, _P_SoH = 0.38, _n_SoH = 98). Overall heterozygosity and SoH values are highly correlated between the lower- and high-contiguity versions of the upgraded assemblies (Pearson correlation _r_het = 0.999, _P_het = 5 × 10⁻⁷, _n_het = 7; _r_SoH = 0.996, _P_SoH = 1.4 × 10⁻⁶, _n_SoH = 7).
Genomic diversity varies significantly among species in different IUCN conservation categories, as measured by overall heterozygosity (Fig. 2a) and SoH values (Fig. 2b). SoH values increase (P = 0.024, _R_2 = 0.055, n = 94) with increasing levels of conservation concern, whereas heterozygosity decreases (P = 0.011, _R_2 = 0.064, n = 101). There is no significant difference between wild and captive populations in overall heterozygosity (Fig. 2c) or SoH values (Fig. 2d).
Fig. 2: Genetic diversity varies across IUCN conservation categories.
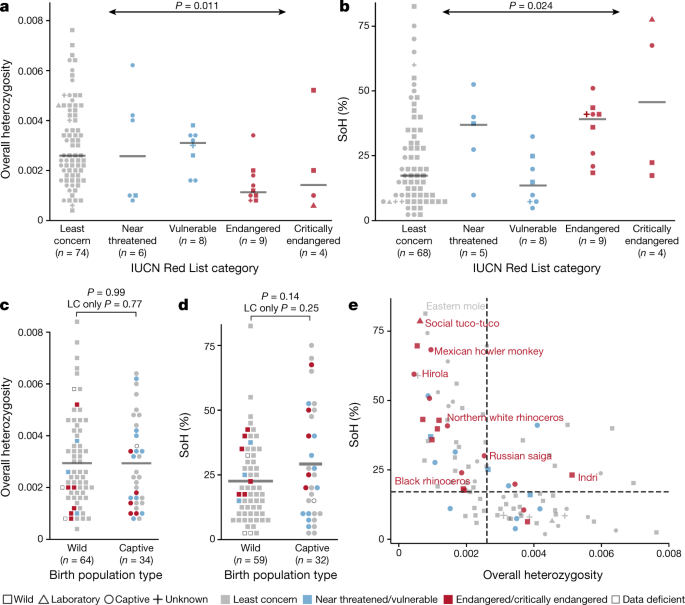
a, b, Heterozygosity declines (a) and SoH value increases (b) with the level of concern for species conservation, as assessed by IUCN conservation categories. Horizontal grey lines indicate median. c, d, Comparing individuals sampled from wild and captive populations, we saw no statistically significant difference (independent samples _t_-test) in overall heterozygosity (c) or per cent SoH (d), with similar means (horizontal grey lines) between types of birth population. In a–d, there was a total of 105 species, with n for each tested category indicated on the x axis. Statistical tests were two-sided. LC, least concern. e, Overall heterozygosity and SoH values for all genomes analysed (including those with high allelic balance ratio; n = 124 species), with median SoH (17.1%, horizontal dashed line) and median overall heterozygosity (0.0026, vertical dashed line) for species categorized as least concern. Values for individuals from the seven critically endangered species are shown in red.
Unusual diversity values can suggest particular population demographics, although data from more than a single individual are needed to confirm these inferences. All seven critically endangered species have SoH values that are higher than the median for species categorized as of least concern (Fig. 2e). The genomes with the lowest heterozygosity and highest SoH values were the social tuco-tuco (heterozygosity = 0.00063 and SoH = 78.7%), which was sampled from a small laboratory colony with only 12 founders29, and the eastern mole (Scalopus aquaticus) (heterozygosity = 0.0008 and SoH = 81.3%), which was supplied by a professional mole catcher and was probably from a population that had experienced a bottleneck owing to pest control measures.
The correlation between diversity metrics and IUCN category is not explained by other species-level phenotypes. For species of least concern (n = 75), we assessed 21 phenotypes that are catalogued in the PanTHERIA30 database for correlation with heterozygosity or SoH values. The most significant was between SoH value and litter size, a trait that has previously been shown to predict extinction risk31 (_P_SoH = 0.02), but none is significant after Bonferroni correction (Extended Data Table 3).
Our inference that diversity trends lower in species at a higher risk of extinction comes from a small fraction (2.6%) of threatened mammals[9](/articles/s41586-020-2876-6#ref-CR9 "IUCN. The IUCN Red List of Threatened Species. Version 2019-2 http://www.iucnredlist.org
(2019)."). Whether this is a direct correlation with extinction risk or arises from an association between diversity and species-level phenotypes such as litter size, it suggests that valuable information can be gleaned from sequencing only a single individual. Should this pattern prove robust across more species, diversity metrics from a single reference genome could help to identify populations that are at risk—even when few species-level phenotypes are documented—and to prioritize species for follow-up at the population level.Resources for biodiversity conservation
For each genome assembly, we catalogued all high-confidence variant sites (http://broad.io/variants) to support the design of cost-effective and accurate genetic assays that are usable even when the sample quality is low32; such assays are often preferable to designing expensive custom tools, relying on tools from related species or sequencing random regions33. The reference genomes themselves support the development of technologies such as using gene drives to control invasive species or pursuing ‘de-extinction’ through cloning and genetic engineering34.
Our genomes have two notable limitations. We sequenced only a single individual for each species, which is insufficient for studying population origins, population structure and recent demographic events35,36, and the shorter contiguity of our assemblies prevented us from analysing runs of homozygosity26. This highlights a dilemma that faces all large-scale genomics initiatives: determining when the value of sequencing additional individuals exceeds the value of improving the reference genome itself.
Whole-genome alignment
We aligned the genomes of 240 species (our assemblies and other mammalian genomes that were released when we started the alignment) as part of a 600-way pan-amniote alignment using the Cactus alignment software37 (Supplementary Table 2). Rather than aligning to a single anchor genome, Cactus infers an ancestral genome for each pair of assemblies (Fig. 3a). Consistent with our predictions, we have increased power to detect sequence constraint at individual bases relative to previous studies7,38. We detect 3.1% of bases in the human genome to be under purifying selection in the eutherian lineage (false-discovery rate (FDR) < 5%), without using windowing or other means to integrate contextual information across neighbouring bases. This is more than double the number from the largest previous 100-vertebrate alignment38 (Fig. 3b), with improvements being most notable in the non-coding sequence (Fig. 3c) and in the increased resolution of individual features (Fig. 3d). This represents a substantial proportion—but not all—of the 5 to 8% of the human genome that has previously been suggested to be under purifying selection7,39.
Fig. 3: The Zoonomia alignment doubles the fraction of the human genome predicted to be under purifying selection at single-base-pair resolution.
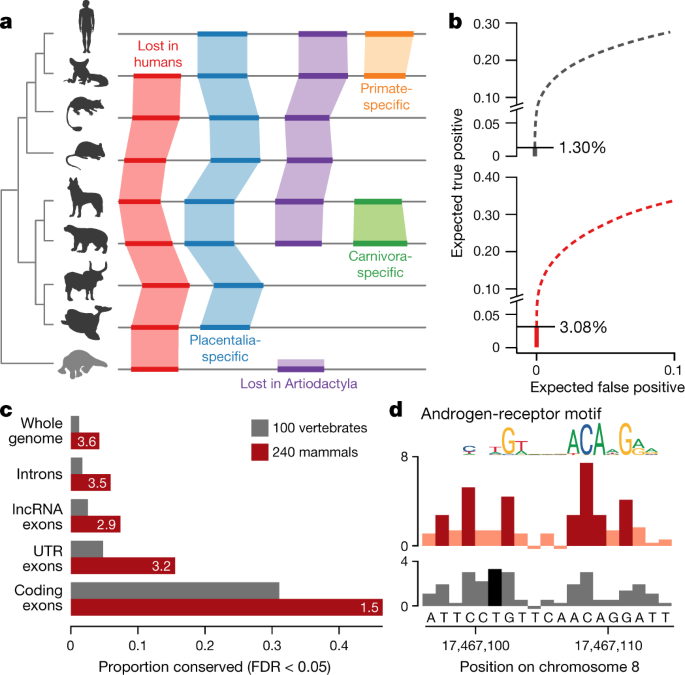
a, Cactus alignments are reference-genome-free, enabling the detection of sequence that is absent from human (red) or other clades (purple), lineage-specific innovations (orange and green) and eutherian-mammal-specific sequence (blue). b, We compared phyloP predictions of conserved positions for a widely used 100-vertebrate alignment (n = 100 vertebrate species) (grey) to the Zoonomia alignment (n = 240 eutherian species) (red). The cumulative portion of the genome expected to be covered by true- versus false-positive calls is shown, starting from the highest confidence calls (solid line) and proceeding to calls with lower confidence (dashed lines); the horizontal line indicates the point at which the confidence level drops below an expected FDR of 0.05 (two-sided). c, A higher proportion of functionally annotated bases are detected as highly conserved (FDR < 0.05) in the Zoonomia alignment (red) than the 100-vertebrate alignment (grey), most notably in non-coding regions. lncRNA, long non-coding RNA; UTR, untranslated region. **d**, At a putative androgen-receptor binding site, phyloP scores predict that seven bases are under purifying selection (FDR < 0.05, two-sided) in the Zoonomia alignment (dark red), peaking in positions with the most information content in the androgen receptor JASPAR49 motif, compared to one (dark grey) in the 100-vertebrate alignment, with scores at FDR > 0.05 shown in light red (top) and light grey (bottom).
Next steps
Using our alignment of 240 mammalian genomes, we are pursuing four key strategies of analysis. First, we aim to provide the largest eutherian phylogeny based on nuclear genomes by building a comprehensive phylogeny and time tree, including trees partitioned by functional annotations, mode of inheritance and long-term recombination rates. Second, we will produce a detailed map of evolutionary constraint, identifying highly conserved genomic regions, regions under accelerated evolution in particular lineages and changes that probably affect phenotype, leveraging functional data from ENCODE40, GTEx41 and the Human Cell Atlas42. Third, we will use genotype–phenotype correlations to investigate patterns of constraint in regions associated with disease in humans, identify patterns of convergent adaptive evolution2 and apply a forward genomics strategy to link functional elements to traits. Finally, we will explore the evolution of genome structure by mapping syntenic regions between genomes, identifying evolutionary breakpoints and characterizing the repeat landscape.
Conclusion
The Zoonomia Project has captured mammalian diversity at a high resolution, and is among the first of many projects that are underway to sequence, catalogue and characterize whole branches of the eukaryotic biodiversity of the Earth. On the basis of our experience, we propose the following principles for realizing the full value of large-scale comparative genomics.
First, we should prioritize sample collection. We must support field researchers who collect samples and understand species ecology and behaviour, develop strategies for sample collection that do not rely on bulky laboratory equipment or cold chains, develop technology for using non-invasive types of sampling and establish more repositories of renewable cell cultures10.
Second, we need accessible and scalable tools for computational analysis. Few research groups have access to the computational resources necessary for work with massive genomic datasets. We must address the shortage of skilled computational scientists, and design software and data-storage systems that make powerful computational pipelines accessible to all researchers.
Finally, we should promote rapid data-sharing. Data embargoes must not be permitted to delay analyses that directly benefit the conservation of endangered species, human health or progress in basic science. Genomic data should be shared as quickly as possible and without restrictions on use.
Numerous large-scale genome-sequencing efforts are now underway, including the Earth BioGenome Project43, Genome 10K44, the Vertebrate Genomes Project, Bat 1K45, Bird 10K46 and DNA Zoo. As the number of genomes grows, so too will the usefulness of comparative genomics in disease research and the development of therapeutic strategies. Preserving, rather than merely recording, the biodiversity of the Earth must be a priority. Through global scientific collaborations, and by making genomic resources available and accessible to all research communities, we can ensure that the legacy of genomics is not a digital archive of lost species.
Methods
The number of samples (species) required to detect evolutionary conservation at a single base was estimated by applying a Poisson model of the distribution of substitution counts in the genome.
Species selection, sample shipping and regulatory approvals
Species were selected to maximize branch length across the eutherian mammal phylogeny, and to capture genomes of species from previously unrepresented eutherian families. Of 172 species initially selected for inclusion, we obtained sufficiently high-quality DNA samples for genome sequencing for 137. DNA samples from collaborating institutions were shipped to the Broad Institute (n = 69) or Uppsala University (n = 68). For samples received at the Broad Institute that were then sent to Uppsala, shipping approval was secured from the US Fish and Wildlife Service. Institutional Animal Care and Use Committee approval was not required.
Sample quality control, library construction and sequencing
DNA integrity for each sample was visualized via agarose gel (at the Broad Institute) or Agilent tape station (at Uppsala University). Samples passed quality control if the bulk of DNA fragments were greater than 5 kb. DNA concentration was then determined using Invitrogen Qubit dsDNA HS assay kit. For each of the samples that passed quality control, 1–3 μg of DNA was fragmented on the Covaris E220 Instrument using the 400-bp standard programme (10% duty cycle, 140 PIP, 200 cycles per burst, 55 s). Fragmented samples underwent SPRI double-size selection (0.55×, 0.7 × f) followed by PCR-free Illumina library construction following the manufacturer’s instructions (Kapa no. KK8232) using PCR-free adapters from Illumina (no. FC-121-3001). Final library fragment size distribution was determined on Agilent 2100 Bioanalyzer with High Sensitivity DNA Chips. Paired-end libraries were pooled, and then sequenced on a single lane of the Illumina HiSeq2500, set for Version 2 chemistry and 2×250-bp reads. This yielded a total of mean 375 million (s.d. = 125 million) reads per sample.
Assembly and validation
For each species, we applied DISCOVAR de novo11 (discovardenovo-52488) (ftp://ftp.broadinstitute.org/pub/crd/DiscovarDeNovo/) to assemble the 2×250-bp read group, using the following command: DiscovarDeNovo READS = [READFILE] OUT_DIR = [SPECIES_ID]//[SPECIES_ID].discovar_files NUM_THREADS = 24 MAX_MEM_GB = 200G.
Coverage for each genome was automatically calculated by DISCOVAR, with a mean coverage of 40.1× (s.d.± 14×). We assessed genome assembly, gene set and transcriptome completeness using Benchmarking Universal Single-Copy Orthologs (BUSCO), which provides quantitative measures on the basis of gene content from near-universal single-copy orthologues50. BUSCO was run with default parameters, using the mammalian gene model set (mammalia_odb9, n = 4,104), using the following command: python ./BUSCO.py -i [input fasta] -o [output_file] -l ./mammalia_odb9/ -m genome -c 1 -sp. human.
Median contig N50 for existing RefSeq assemblies was calculated using the assembly statistics for the most recent release of 118 eutherian mammals with RefSeq assembly accession numbers. Assemblies were all classified as either reference genome or representative genome. Assembly statistics were downloaded from the NCBI on 10 April 2019.
Genome upgrades
We selected genomes from each eutherian order without a pre-existing long-contiguity assembly on the basis of (1) whether the underlying assembly met the minimum quality threshold needed for HiRise upgrades; and (2) whether a second sample of sufficient quality could be obtained from that individual. All upgrades were done with Dovetail Chicago libraries and assembled with HiRise 2.1, as previously described51.
Estimating heterozygosity
Selection of assemblies for heterozygosity analysis
Heterozygosity statistics were calculated for all but four of our short read assemblies (n = 126) as well as eight Dovetail-upgraded genomes. Four failed because they were either too fragmented to analyse (n = 3) or because of undetermined errors (n = 1). One assembly was excluded because it was a second individual from a species that was already represented.
Heterozygosity calls
We applied the standard GATK pipeline with genotype quality banding to identify the callable fraction of the genome52,53. First, we used samtools to subsample paired reads from the unmapped .bam files54. After removing adaptor sequences from the selected reads, we used BWA-MEM to map reads to the reference genome scaffolds of >10 kb, removing duplicates using the PicardTools MarkDuplicates utility55. We then called heterozygous sites using standard GATK-Haplotypecaller specifications, and with additional gVCF banding at 0, 10, 20, 30, 40, 50 and 99 qualities. We used the fraction of the genome with genotype quality >15 for subsequent analyses. For the lists of high-confidence variant sites, we include only heterozygous positions after filtering at GQ >20, maximum DP <100, minimum DP >6, as described in the README file at http://broad.io/variants.
Inferring overall heterozygosity
To avoid confounding by sex chromosomes or complex regions, we excluded all scaffolds with less than 0.5 or greater than 2× of the average sample read depth, then calculated global heterozygosity as the fraction of heterozygous calls over the whole callable genome.
Calling SoH
We estimated the proportion of the genome within SoH using a metric designed for genomes with scaffold N50 shorter than the expected maximum length of runs of homozygosity (our median scaffold N50 is 62 kb). We first split all scaffolds into windows with a maximum length of 50 kb, with windows ranging from 20 to 50 kb for scaffolds <50 kb. For each window, we calculated the average number of heterozygous sites per bp. We discriminated windows with extremely low heterozygosity by using the Python 3.5.2 pomegranate package to fit a two-component Gaussian mixture model to the joint distribution of window heterozygosity, forcing the first component to be centred around the lower tail of the distribution and allowing the second to freely capture all the remaining heterozygosity variability56,[57](/articles/s41586-020-2876-6#ref-CR57 "R Core Team. R: A Language and Environment for Statistical Computing. https://www.R-project.org/
(2019)."). As heterozygosity cannot be negative, and normal distributions near zero can cross into negative values, we used the normal cumulative distribution function to correct the posterior distribution by the negative excess—effectively fitting a truncated normal to the first component. The final SoH value was calculated using the posterior maximum likelihood classification between both components. We saw no significant correlation between contig N50 and SoH (Pearson correlation = 0.055, _P_ \= 0.57, _n_ \= 112).Assessing the effect of the percentage of callable genome
We assessed whether the percentage of the genome that was callable (Supplementary Table 3) was likely to affect our analysis. The callable percentage was correlated with heterozygosity (r = −0.80, P < 2.2 × 10⁻¹⁶, n = 130), and weakly with SoH values (r = 0.18, P = 0.06, n = 112). There is no significant difference in callable percentage among IUCN categories (analysis of variance P = 0.98, n = 122) or between captive and wild populations (_t_-test P = 0.81, n = 120).
Analysing patterns of diversity
We excluded two genomes with exceptionally high heterozygosity (heterozygosity >0.02; >5 s.d. above the mean). Both were of non-endangered species, and thus removing them made our determination of lower heterozygosity in endangered species more conservative. Of the remaining 124 genomes, we excluded 19 with allelic balance values that were more than one s.d. above the mean (>0.36). Abnormally high allelic balance can indicate sequencing biases with potential for artefacts in estimates of heterozygosity and/or SoH. Our final dataset contains heterozygosity values for 105 genomes and SoH values for 98 genomes (Supplementary Table 3). For seven genomes, we were unable to estimate SoH because the two components of the Gaussian mixture model overlapped completely. To ask about a possible directional relationship between level of IUCN concern and overall heterozygosity or SoH, we applied regression using the IUCN category as an ordinal predictor. We also asked about the relationship of diversity metrics to a set of species-level phenotypes for which correlations were previously reported (Extended Data Table 3).
Alignment
The alignment was generated using the progressive mode of Cactus37,58. The topology used for the guide tree of the alignment was taken from TimeTree47; the branch lengths of the guide tree were generated by a least-squares fit from a distance matrix. The distance matrix was based on the UCSC 100-way phyloP fourfold-degenerate site tree38 for those species that had corresponding entries in the 100-way tree. For species not present in the 100-way tree, distance matrix entries were more coarsely estimated using the distance estimated from Mash59 to the closest relative included in the 100-way data.
Cactus does not attempt to fully resolve the gene tree when multiple duplications take place along a single branch, as there is an implicit restriction in Cactus that a duplication event be represented as multiple regions in the child species aligned to a single region in the parent species. This precludes representing discordance between the gene tree and species tree that could occur with incomplete lineage-sorting or horizontal transfer. However, the guide tree has a minimal effect on the alignment, with little difference between alignments with different trees—even when using a tree that is purposely wrong37. Phenomena such as incomplete lineage sorting that affect a subset of species are unlikely to substantially affect the detection of purifying selection across the whole eutherian lineage described in Fig. 3.
The alignment was generated in several steps, on account of its large scale. First, a backbone alignment of several long contiguity assemblies was generated, using the genomes of two non-placental mammals (Tasmanian devil (Sarcophilus harrisii) and platypus (Ornithorhynchus anatinus)), to inform the reconstruction of the placental root. Next, separate clade alignments were generated for each major clade in the alignment: Euarchonta, Glires, Laurasiatheria, Afrotheria and Xenarthra. The roots of these clade alignments were then aligned to the corresponding ancestral genomes from the backbone, stitching these alignments together to create the final alignment. The process of aligning a genome to an existing ancestor is complex and further described in an accompanying Article that introduces the progressive mode of Cactus37.
We created a neutral model for the conservation analysis using ancestral repeats detected by RepeatMasker[60](/articles/s41586-020-2876-6#ref-CR60 "Smit, A. F. A., Hubley, R. & Green, P. RepeatMasker Open-4.0. http://www.repeatmasker.org/
(2013–2015).") on the eutherian ancestral genome produced in the Cactus alignment (tRNA and low-complexity repeats were removed). To fit the neutral model, we used phyloFit from the PHAST[61](/articles/s41586-020-2876-6#ref-CR61 "Hubisz, M. J., Pollard, K. S. & Siepel, A. PHAST and RPHAST: phylogenetic analysis with space/time models. Brief. Bioinform. 12, 41–51 (2011).") package, using the REV (generalized reversible) model and EM optimization method. The training input was a MAF exported on columns from the set of ancestral repeats mentioned above. Because phyloFit does not support alignment columns that contain duplicates, if a genome had more than one sequence in a single alignment block, these were replaced with a single entry representing the consensus base at each column.We extracted initial conservation scores using phyloP from the PHAST61 package on a MAF exported using human as a reference. We converted the phyloP scores (which represent log-scaled P values of acceleration or conservation) into P values, then into q values using the FDR-correction of Benjamini and Hochberg62. Any column with a resulting q value less than 0.05 was deemed significantly conserved or accelerated.
The alignment—as well as conservation annotations—are available at https://cglgenomics.ucsc.edu/data/cactus/.
Reporting summary
Further information on research design is available in the Nature Research Reporting Summary linked to this paper.
Data availability
The project website is http://zoonomiaproject.org/. Details of each Zoonomia genome assembly—including NCBI GenBank63 accession numbers—are provided in Supplementary Table 1. Sequence data and genome assemblies are available at https://www.ncbi.nlm.nih.gov/. Variant lists for each species are provided at http://broad.io/variants. Further source data for Fig. 2 are provided in the Zoonomia GitHub repository (https://doi.org/10.5281/zenodo.3887432). The Cactus alignment is provided at https://cglgenomics.ucsc.edu/data/cactus/. A visualization of the alignments and phyloP data is available by loading our assembly hub into the UCSC browser64 by copying the hub link https://comparative-genomics-hubs.s3-us-west-2.amazonaws.com/200m_hub.txt into the Track Hubs page. There are no restrictions on use. Source data are provided with this paper.
Code availability
References
- Claussnitzer, M. et al. A brief history of human disease genetics. Nature 577, 179–189 (2020).
ADS CAS PubMed PubMed Central Google Scholar - Hiller, M. et al. A “forward genomics” approach links genotype to phenotype using independent phenotypic losses among related species. Cell Rep. 2, 817–823 (2012).
CAS PubMed PubMed Central Google Scholar - Wasser, S. K. et al. Genetic assignment of large seizures of elephant ivory reveals Africa’s major poaching hotspots. Science 349, 84–87 (2015).
ADS CAS PubMed PubMed Central Google Scholar - Wright, B. et al. Development of a SNP-based assay for measuring genetic diversity in the Tasmanian devil insurance population. BMC Genomics 16, 791 (2015).
PubMed PubMed Central Google Scholar - Lappalainen, T., Scott, A. J., Brandt, M. & Hall, I. M. Genomic analysis in the age of human genome sequencing. Cell 177, 70–84 (2019).
CAS PubMed PubMed Central Google Scholar - Kircher, M. et al. A general framework for estimating the relative pathogenicity of human genetic variants. Nat. Genet. 46, 310–315 (2014).
CAS PubMed PubMed Central Google Scholar - Lindblad-Toh, K. et al. A high-resolution map of human evolutionary constraint using 29 mammals. Nature 478, 476–482 (2011).
CAS PubMed PubMed Central Google Scholar - Finucane, H. K. et al. Partitioning heritability by functional annotation using genome-wide association summary statistics. Nat. Genet. 47, 1228–1235 (2015).
CAS PubMed PubMed Central Google Scholar - IUCN. The IUCN Red List of Threatened Species. Version 2019-2 http://www.iucnredlist.org (2019).
- Ryder, O. A. & Onuma, M. Viable cell culture banking for biodiversity characterization and conservation. Annu. Rev. Anim. Biosci. 6, 83–98 (2018).
PubMed Google Scholar - Weisenfeld, N. I. et al. Comprehensive variation discovery in single human genomes. Nat. Genet. 46, 1350–1355 (2014).
CAS PubMed PubMed Central Google Scholar - Putnam, N. H. et al. Chromosome-scale shotgun assembly using an in vitro method for long-range linkage. Genome Res. 26, 342–350 (2016).
CAS PubMed PubMed Central Google Scholar - Kim, J. et al. Reconstruction and evolutionary history of eutherian chromosomes. Proc. Natl Acad. Sci. USA 114, E5379–E5388 (2017).
CAS PubMed PubMed Central Google Scholar - Lek, M. et al. Analysis of protein-coding genetic variation in 60,706 humans. Nature 536, 285–291 (2016).
CAS PubMed PubMed Central Google Scholar - Balasubramanian, S. et al. Using ALoFT to determine the impact of putative loss-of-function variants in protein-coding genes. Nat. Commun. 8, 382 (2017).
ADS PubMed PubMed Central Google Scholar - Meadows, J. R. S. & Lindblad-Toh, K. Dissecting evolution and disease using comparative vertebrate genomics. Nat. Rev. Genet. 18, 624–636 (2017).
CAS PubMed Google Scholar - Cooper, G. M. & Shendure, J. Needles in stacks of needles: finding disease-causal variants in a wealth of genomic data. Nat. Rev. Genet. 12, 628–640 (2011).
CAS PubMed Google Scholar - Baiz, M. D., Tucker, P. K., Mueller, J. L. & Cortés-Ortiz, L. X-linked signature of reproductive isolation in humans is mirrored in a howler monkey hybrid zone. J. Hered. 111, 419–428 (2020).
PubMed PubMed Central Google Scholar - Dobzhansky, T. & Dobzhansky, T. G. Genetics and the Origin of Species (Columbia Univ. Press, 1937).
- Herrera-Álvarez, S., Karlsson, E., Ryder, O. A., Lindblad-Toh, K. & Crawford, A. J. How to make a rodent giant: genomic basis and tradeoffs of gigantism in the capybara, the world’s largest rodent. Preprint at https://doi.org/10.1101/424606 (2018).
- Abegglen, L. M. et al. Potential mechanisms for cancer resistance in elephants and comparative cellular response to DNA damage in humans. J. Am. Med. Assoc. 314, 1850–1860 (2015).
CAS Google Scholar - Casewell, N. R. et al. Solenodon genome reveals convergent evolution of venom in eulipotyphlan mammals. Proc. Natl Acad. Sci. USA 116, 25745–25755 (2019).
CAS PubMed PubMed Central Google Scholar - Beichman, A. C. et al. Aquatic adaptation and depleted diversity: a deep dive into the genomes of the sea otter and giant otter. Mol. Biol. Evol. 36, 2631–2655 (2019).
CAS PubMed PubMed Central Google Scholar - Damas, J. et al. Broad host range of SARS-CoV-2 predicted by comparative and structural analysis of ACE2 in vertebrates. Proc. Natl Acad. Sci. USA 117, 22311–22322 (2020).
CAS PubMed PubMed Central Google Scholar - Xue, Y. et al. Mountain gorilla genomes reveal the impact of long-term population decline and inbreeding. Science 348, 242–245 (2015).
ADS CAS PubMed PubMed Central Google Scholar - Ceballos, F. C., Joshi, P. K., Clark, D. W., Ramsay, M. & Wilson, J. F. Runs of homozygosity: windows into population history and trait architecture. Nat. Rev. Genet. 19, 220–234 (2018).
CAS PubMed Google Scholar - Spielman, D., Brook, B. W. & Frankham, R. Most species are not driven to extinction before genetic factors impact them. Proc. Natl Acad. Sci. USA 101, 15261–15264 (2004).
ADS CAS PubMed PubMed Central Google Scholar - Vinson, J. P. et al. Assembly of polymorphic genomes: algorithms and application to Ciona savignyi. Genome Res. 15, 1127–1135 (2005).
PubMed PubMed Central Google Scholar - MacManes, M. D. & Lacey, E. A. The social brain: transcriptome assembly and characterization of the hippocampus from a social subterranean rodent, the colonial tuco-tuco (Ctenomys sociabilis). PLoS ONE 7, e45524 (2012).
ADS CAS PubMed PubMed Central Google Scholar - Jones, K. E. et al. PanTHERIA: a species-level database of life history, ecology, and geography of extant and recently extinct mammals. Ecology 90, 2648 (2009).
Google Scholar - Cardillo, M. Biological determinants of extinction risk: why are smaller species less vulnerable? Anim. Conserv. 6, 63–69 (2003).
Google Scholar - Natesh, M. et al. Empowering conservation practice with efficient and economical genotyping from poor quality samples. Methods Ecol. Evol. 10, 853–859 (2019).
PubMed PubMed Central Google Scholar - Lowry, D. B. et al. Breaking RAD: an evaluation of the utility of restriction site-associated DNA sequencing for genome scans of adaptation. Mol. Ecol. Resour. 17, 142–152 (2017).
CAS PubMed Google Scholar - Shapiro, B. Pathways to de-extinction: how close can we get to resurrection of an extinct species? Funct. Ecol. 31, 996–1002 (2017).
Google Scholar - Benazzo, A. et al. Survival and divergence in a small group: the extraordinary genomic history of the endangered Apennine brown bear stragglers. Proc. Natl Acad. Sci. USA 114, E9589–E9597 (2017).
CAS PubMed PubMed Central Google Scholar - Saremi, N. F. et al. Puma genomes from North and South America provide insights into the genomic consequences of inbreeding. Nat. Commun. 10, 4769 (2019).
ADS PubMed PubMed Central Google Scholar - Armstrong, J. et al. Progressive Cactus is a multiple-genome aligner for the thousand-genome era. Nature https://doi.org/10.1038/s41586-020-2871-y (2020).
- Haeussler, M. et al. The UCSC genome browser database: 2019 update. Nucleic Acids Res. 47, D853–D858 (2019).
CAS PubMed Google Scholar - Rands, C. M., Meader, S., Ponting, C. P. & Lunter, G. 8.2% of the human genome is constrained: variation in rates of turnover across functional element classes in the human lineage. PLoS Genet. 10, e1004525 (2014).
PubMed PubMed Central Google Scholar - ENCODE Project Consortium. An integrated encyclopedia of DNA elements in the human genome. Nature 489, 57–74 (2012).
ADS Google Scholar - GTEx Consortium. Genetic effects on gene expression across human tissues. Nature 550, 204–213 (2017).
PubMed Central Google Scholar - Regev, A. et al. The human cell atlas. eLife 6, e27041 (2017).
PubMed PubMed Central Google Scholar - Lewin, H. A. et al. Earth BioGenome project: sequencing life for the future of life. Proc. Natl Acad. Sci. USA 115, 4325–4333 (2018).
CAS PubMed PubMed Central Google Scholar - Koepfli, K.-P., Paten, B., the Genome 10K Community of Scientists & O’Brien, S. J. The Genome 10K project: a way forward. Annu. Rev. Anim. Biosci. 3, 57–111 (2015).
CAS PubMed PubMed Central Google Scholar - Teeling, E. C. et al. Bat biology, genomes, and the Bat1K project: to generate chromosome-level genomes for all living bat species. Annu. Rev. Anim. Biosci. 6, 23–46 (2018).
PubMed Google Scholar - Feng, S. et al. Dense sampling of bird diversity increases power of comparative genomics. Nature https://doi.org/10.1038/s41586-020-2873-9 (2020).
- Kumar, S., Stecher, G., Suleski, M. & Hedges, S. B. TimeTree: a resource for timelines, timetrees, and divergence times. Mol. Biol. Evol. 34, 1812–1819 (2017).
CAS PubMed Google Scholar - Wilson, D. E. & Reeder, D. M. (eds) Mammal Species of the World. A Taxonomic and Geographic Reference 3rd edn (Johns Hopkins Univ. Press, 2005).
- Vlieghe, D. et al. A new generation of JASPAR, the open-access repository for transcription factor binding site profiles. Nucleic Acids Res. 34, D95–D97 (2006).
CAS PubMed Google Scholar - Simão, F. A., Waterhouse, R. M., Ioannidis, P., Kriventseva, E. V. & Zdobnov, E. M. BUSCO: assessing genome assembly and annotation completeness with single-copy orthologs. Bioinformatics 31, 3210–3212 (2015).
PubMed Google Scholar - Farré, M. et al. A near-chromosome-scale genome assembly of the gemsbok (Oryx gazella): an iconic antelope of the Kalahari desert. Gigascience 8, giy162 (2019).
PubMed Central Google Scholar - McKenna, A. et al. The genome analysis toolkit: a MapReduce framework for analyzing next-generation DNA sequencing data. Genome Res. 20, 1297–1303 (2010).
CAS PubMed PubMed Central Google Scholar - DePristo, M. A. et al. A framework for variation discovery and genotyping using next-generation DNA sequencing data. Nat. Genet. 43, 491–498 (2011).
CAS PubMed PubMed Central Google Scholar - Li, H. et al. The Sequence Alignment/Map format and SAMtools. Bioinformatics 25, 2078–2079 (2009).
PubMed PubMed Central Google Scholar - Li, H. & Durbin, R. Fast and accurate short read alignment with Burrows–Wheeler transform. Bioinformatics 25, 1754–1760 (2009).
CAS PubMed PubMed Central Google Scholar - Benaglia, T., Chauveau, D., Hunter, D. & Young, D. mixtools: an R package for analyzing finite mixture models. J. Stat. Softw. 32, 1–29 (2009).
Google Scholar - R Core Team. R: A Language and Environment for Statistical Computing. https://www.R-project.org/ (2019).
- Paten, B. et al. Cactus: algorithms for genome multiple sequence alignment. Genome Res. 21, 1512–1528 (2011).
CAS PubMed PubMed Central Google Scholar - Ondov, B. D. et al. Mash: fast genome and metagenome distance estimation using MinHash. Genome Biol. 17, 132 (2016).
PubMed PubMed Central Google Scholar - Smit, A. F. A., Hubley, R. & Green, P. RepeatMasker Open-4.0. http://www.repeatmasker.org/ (2013–2015).
- Hubisz, M. J., Pollard, K. S. & Siepel, A. PHAST and RPHAST: phylogenetic analysis with space/time models. Brief. Bioinform. 12, 41–51 (2011).
CAS PubMed Google Scholar - Benjamini, Y. & Hochberg, Y. Controlling the false discovery rate: a practical and powerful approach to multiple testing. J. R. Stat. Soc. B 57, 289–300 (1995).
MathSciNet MATH Google Scholar - Benson, D. A. et al. GenBank. Nucleic Acids Res. 41, D36–D42 (2013).
CAS PubMed Google Scholar - Nguyen, N. et al. Comparative assembly hubs: web-accessible browsers for comparative genomics. Bioinformatics 30, 3293–3301 (2014).
CAS PubMed PubMed Central Google Scholar - Karczewski, K. J. et al. The mutational constraint spectrum quantified from variation in 141,456 humans. Nature 581, 434–443 (2020).
ADS CAS PubMed PubMed Central Google Scholar - Pinheiro, E. C., Taddei, V. A., Migliorini, R. H. & Kettelhut, I. C. Effect of fasting on carbohydrate metabolism in frugivorous bats (Artibeus lituratus and Artibeus jamaicensis). Comp. Biochem. Physiol. B Biochem. Mol. Biol. 143, 279–284 (2006).
PubMed Google Scholar - Gordon, L. M. et al. Amorphous intergranular phases control the properties of rodent tooth enamel. Science 347, 746–750 (2015).
ADS CAS PubMed Google Scholar - Hindle, A. G. & Martin, S. L. Intrinsic circannual regulation of brown adipose tissue form and function in tune with hibernation. Am. J. Physiol. Endocrinol. Metab. 306, E284–E299 (2014).
CAS PubMed Google Scholar - Stanford, K. I. et al. Brown adipose tissue regulates glucose homeostasis and insulin sensitivity. J. Clin. Invest. 123, 215–223 (2013).
CAS PubMed Google Scholar - Chondronikola, M. et al. Brown adipose tissue improves whole-body glucose homeostasis and insulin sensitivity in humans. Diabetes 63, 4089–4099 (2014).
CAS PubMed PubMed Central Google Scholar - Saito, M. et al. High incidence of metabolically active brown adipose tissue in healthy adult humans: effects of cold exposure and adiposity. Diabetes 58, 1526–1531 (2009).
CAS PubMed PubMed Central Google Scholar
Acknowledgements
We thank the many individuals who provided samples and advice, including C. Adenyo, C. Avila, E. Baitchman, R. Behringer, A. Boyko, M. Breen, K. Campbell, P. Campbell, C. J. Conroy, K. Cooper, L. M. Dávalos, F. Delsuc, D. Distel, C. A. Emerling, J. Fronczek, N. Gemmel, J. Good, K. He, K. Helgen, A. Hindle, H. Hoekstra, R. Honeycutt, P. Hulva, W. Israelsen, B. Kayang, R. Kennerley, M. Korody, D. N. Lee, E. Louis, M. MacManes, A. Misuraca, A. Mitelberg, P. Morin, A. Mouton, M. Murayama, M. Nachman, A. Navarro, R. Ogden, B. Pasch, S. Puechmaille, T. J. Robinson, S. Rossiter, M. Ruedi, A. Seifert, S. Thomas, S. Turvey, G. Verbeylen and the late R. J. Baker. We also thank the Broad Institute Genomics Platform and SNP & SEQ Technology Platform (part of the National Genomics Infrastructure (NGI) Sweden and Science for Life Laboratory) and Swedish National Infrastructure for Computing (SNIC) at Uppmax. This project was funded by NIH NHGRI R01HG008742 (E.K.K., B.B., D.P.G., R.S., J.T.-M., J.J., H.J.N., B.P. and J. Armstrong), Swedish Research Council Distinguished Professor Award (K.L.-T., V.D.M., E.M. and J.R.S.M.), Swedish Research Council grant 2018-05973 (K.L.-T.), Knut and Alice Wallenberg Foundation (K.L.-T., V.D.M., E.M. and J.R.S.M.), Uppsala University (K.L.-T., V.D.M., E.M., J.R.S.M., J.J., J. Alfoldi and L.G.), Broad Institute Next10 (L.G.), Gladstone Institutes (K.S.P.), NIH NHGRI 5R01HG002939 (A.F.A.S. and R.H.), NIH NHGRI 5U24HG010136 (A.F.A.S. and R.H.), NIH NHGRI 5R01HG010485 (B.P. and M.D.), NIH NHGRI 2U41HG007234 (B.P., M.D. and J. Armstrong), NIH NIA 5PO1AG047200 (V.N.G.), NIH NIA 1UH2AG064706 (V.N.G.), BFU2017-86471-P MINECO/FEDER, UE (T.M.-B.), Secretaria d’Universitats i Recerca and CERCA Programme del Departament d’Economia i Coneixement de la Generalitat de Catalunya GRC 2017 SGR 880 (T.M.-B.), Howard Hughes International Early Career (T.M.-B.), European Research Council Horizon 2020 no. 864203 (T.M.-B.), Obra Social ‘La Caixa’ (T.M.-B.), BBSRC BBS/E/T/000PR9818, BBS/E/T/ 000PR9783 (W.H. and W.N.), BBSRC Core Strategic Programme Grant BB/P016774/1 (W.H., W.N. and F.D.), Sir Henry Dale Fellowship 200517/Z/16/Z jointly funded by the Wellcome Trust and the Royal Society (N.R.C.), FJCI-2016-29558 MICINN (D.J.), Prince Albert II Foundation of Monaco and Canada, Global Genome Initiative, Smithsonian Institution (M.N.), European Research Council Research Grant ERC-2012-StG311000 (E.C.T.), Irish Research Council Laureate Award (E.C.T.), UK Medical Research Council MR/P026028/1 (W.H. and W.N.), National Science Foundation DEB-1457735 (M.S.S.), National Science Foundation DEB-1753760 (W.J.M.), National Science Foundation IOS-2029774 (E.K.K. and D.P.G.), Robert and Rosabel Osborne Endowment (H.A.L. and J.D.), Swedish Research Council, FORMAS 221-2012-1531 (J.R.S.M.), NSF RoL: FELS: EAGER: DEB 1838283 (D.A.R.) and Academy of Finland grant to Center of Excellence in Tumor Genetics Research no. 312042 (T.K. and J.T.).
Author information
Author notes
- These authors contributed equally: Kerstin Lindblad-Toh, Elinor K. Karlsson
Authors and Affiliations
- Broad Institute of MIT and Harvard, Cambridge, MA, USA
Diane P. Genereux, Jeremy Johnson, Vadim N. Gladyshev, Linda Goodman, Eric S. Lander, Hyun Ji Noh, Ross Swofford, Jason Turner-Maier, Jessica Alfoldi, Bruce Birren, Kerstin Lindblad-Toh & Elinor K. Karlsson - Institute of Evolutionary Biology (UPF-CSIC), PRBB, Barcelona, Spain
Aitor Serres, David Juan, Lukas F. K. Kuderna & Tomas Marques-Bonet - UC Santa Cruz Genomics Institute, University of California Santa Cruz, Santa Cruz, CA, USA
Joel Armstrong, Mark Diekhans, Ian T. Fiddes & Benedict Paten - Science for Life Laboratory, Department of Medical Biochemistry and Microbiology, Uppsala University, Uppsala, Sweden
Voichita D. Marinescu, Eva Murén, Jennifer R. S. Meadows & Kerstin Lindblad-Toh - Department of Biomedical Data Science, Stanford University, Stanford, CA, USA
Gill Bejerano & Linda Goodman - Department of Computer Science, Stanford University, Stanford, CA, USA
Gill Bejerano - Department of Developmental Biology, Stanford University, Stanford, CA, USA
Gill Bejerano - Department of Pediatrics, Stanford University, Stanford, CA, USA
Gill Bejerano - Centre for Snakebite Research and Interventions, Liverpool School of Tropical Medicine, Liverpool, UK
Nicholas R. Casewell - San Diego Zoo Global, Beckman Center for Conservation Research, San Diego, CA, USA
Leona G. Chemnick, Marlys L. Houck, Cynthia C. Steiner & Oliver A. Ryder - The UC Davis Genome Center, University of California, Davis, Davis, CA, USA
Joana Damas - Department of Biological Sciences, University of East Anglia, Norwich, UK
Federica Di Palma & Harris A. Lewin - Earlham Institute, Norwich, UK
Federica Di Palma, Wilfried Haerty & Will Nash - Program in Bioinformatics and Integrative Biology, University of Massachusetts Medical School, Worcester, MA, USA
Manuel Garber & Elinor K. Karlsson - Brigham and Women’s Hospital, Harvard Medical School, Boston, MA, USA
Vadim N. Gladyshev - Fauna Bio Incorporated, Emeryville, CA, USA
Linda Goodman - Institute for Systems Biology, Seattle, WA, USA
Robert Hubley & Arian F. A. Smit - Department of Biochemistry, University of Cambridge, Cambridge, UK
Teemu Kivioja & Jussi Taipale - Applied Tumor Genomics Research Program, University of Helsinki, Helsinki, Finland
Teemu Kivioja & Jussi Taipale - Smithsonian-Mason School of Conservation, Front Royal, VA, USA
Klaus-Peter Koepfli - Department of Biology, MIT, Cambridge, MA, USA
Eric S. Lander - Department of Systems Biology, Harvard Medical School, Boston, MA, USA
Eric S. Lander - Veterinary Integrative Biosciences, Texas A&M University, College Station, TX, USA
William J. Murphy - Marine Mammal Program, Smithsonian Institution, Washington, DC, USA
Martin Nweeia - Restorative Dentistry and Biomaterials Sciences, Harvard School of Dental Medicine, Boston, MA, USA
Martin Nweeia - School of Dental Medicine, Case Western Reserve University, Cleveland, OH, USA
Martin Nweeia - Carnegie Mellon University, School of Computer Science, Department of Computational Biology, Pittsburgh, PA, USA
Andreas R. Pfenning - Chan Zuckerberg Biohub, San Francisco, CA, USA
Katherine S. Pollard - Gladstone Institutes, San Francisco, CA, USA
Katherine S. Pollard - Department of Epidemiology and Biostatistics, Institute for Computational Health Sciences and Institute for Human Genetics, University of California, San Francisco, San Francisco, CA, USA
Katherine S. Pollard - Department of Biological Sciences, Texas Tech University, Lubbock, TX, USA
David A. Ray - Department of Ecology and Evolutionary Biology, University of California, Santa Cruz, Santa Cruz, CA, USA
Beth Shapiro - Howard Hughes Medical Institute, University of California Santa Cruz, Santa Cruz, CA, USA
Beth Shapiro - Department of Evolution, Ecology and Organismal Biology, University of California, Riverside, Riverside, CA, USA
Mark S. Springer - Department of Medical Biochemistry and Biophysics, Karolinska Institutet, Stockholm, Sweden
Jussi Taipale - School of Biology and Environmental Science, University College Dublin, Dublin, Ireland
Emma C. Teeling - Department of Evolution, Behavior, and Ecology, Division of Biology, University of California, San Diego, La Jolla, CA, USA
Oliver A. Ryder - Department of Evolution and Ecology, University of California, Davis, Davis, CA, USA
Harris A. Lewin - Catalan Institution of Research and Advanced Studies (ICREA), Barcelona, Spain
Tomas Marques-Bonet - Institut Català de Paleontologia Miquel Crusafont, Universitat Autònoma de Barcelona, Barcelona, Spain
Tomas Marques-Bonet - CNAG-CRG, Centre for Genomic Regulation (CRG), Barcelona Institute of Science and Technology (BIST), Barcelona, Spain
Tomas Marques-Bonet - Program in Molecular Medicine, University of Massachusetts Medical School, Worcester, MA, USA
Elinor K. Karlsson
Consortia
Zoonomia Consortium
- Diane P. Genereux
- , Aitor Serres
- , Joel Armstrong
- , Jeremy Johnson
- , Voichita D. Marinescu
- , Eva Murén
- , David Juan
- , Gill Bejerano
- , Nicholas R. Casewell
- , Leona G. Chemnick
- , Joana Damas
- , Federica Di Palma
- , Mark Diekhans
- , Ian T. Fiddes
- , Manuel Garber
- , Vadim N. Gladyshev
- , Linda Goodman
- , Wilfried Haerty
- , Marlys L. Houck
- , Robert Hubley
- , Teemu Kivioja
- , Klaus-Peter Koepfli
- , Lukas F. K. Kuderna
- , Eric S. Lander
- , Jennifer R. S. Meadows
- , William J. Murphy
- , Will Nash
- , Hyun Ji Noh
- , Martin Nweeia
- , Andreas R. Pfenning
- , Katherine S. Pollard
- , David A. Ray
- , Beth Shapiro
- , Arian F. A. Smit
- , Mark S. Springer
- , Cynthia C. Steiner
- , Ross Swofford
- , Jussi Taipale
- , Emma C. Teeling
- , Jason Turner-Maier
- , Jessica Alfoldi
- , Bruce Birren
- , Oliver A. Ryder
- , Harris A. Lewin
- , Benedict Paten
- , Tomas Marques-Bonet
- , Kerstin Lindblad-Toh
- & Elinor K. Karlsson
Contributions
K.L.-T. conceived the project. J.J., V.D.M., E.M., N.R.C., L.G.C., J.D., V.N.G., M.L.H., K.-P.K., J.R.S.M., W.J.M., M.N., D.A.R., R.S., E.C.T., J. Alfoldi, O.A.R., H.A.L., K.L.-T. and E.K.K. contributed to the acquisition of the samples. J.J., V.D.M., E.M., J.D., L.G., K.-P.K., H.J.N., C.C.S., R.S., J.T.-M., J. Alfoldi, O.A.R., H.A.L., K.L.-T. and E.K.K. contributed to the production of the genome assemblies. D.P.G., A.S., J. Armstrong, J.J., D.J., I.T.F., L.F.K.K., H.A.L., T.M.-B., K.L.-T. and E.K.K. contributed to the data analysis. D.P.G., J.J., V.D.M., G.B., F.D.P., M.D., I.T.F., M.G., V.N.G., W.H., R.H., T.K., E.S.L., J.R.S.M., A.R.P., K.S.P., A.F.A.S., M.S.S., J.T., J. Alfoldi, B.B., O.A.R., H.A.L., B.P., T.M.-B., K.L.-T. and E.K.K. contributed to the design and conduct of the project. D.P.G., E.S.L., W.N., B.S., O.A.R., K.L.-T. and E.K.K. wrote the manuscript, with input from all other authors.
Corresponding author
Correspondence toElinor K. Karlsson.
Ethics declarations
Competing interests
L.G. is a co-founder of, equity owner in and chief technical officer at Fauna Bio Incorporated.
Additional information
Peer review information Nature thanks Chris Ponting, Steven Salzberg, Guojie Zhang and the other, anonymous, reviewer(s) for their contribution to the peer review of this work.
Publisher’s note Springer Nature remains neutral with regard to jurisdictional claims in published maps and institutional affiliations.
Extended data figures and tables
Extended Data Fig. 1 Notable traits in non-human mammals.
Sequences from species with notable phenotypes can inform human medicine, basic biology and biodiversity conservation, but sample collection can be challenging. a, The Jamaican fruit bat (Artibeus jamaicensis) maintains constant blood glucose across intervals of fruit-eating and fasting66, achieving homeostasis to a degree that is unknown in the treatment of human diabetes. b, The North American beaver (Castor canadensis) avoids tooth decay by incorporating iron rather than magnesium into tooth enamel, which yields an orange hue67. c, The thirteen-lined ground squirrel (Ictidomys tridecemlineatus) prepares for hibernation by rapidly increasing the thermogenic activity of brown fat68, a process that—in humans—is connected to improved glucose homeostasis and insulin sensitivity69,70,71. d, The tiny bumblebee bat (Craseonycteris thonglongyai) is among the smallest of mammals, making it a sparse source of DNA. e, The remote habitat of the very rare Amazon River dolphin (Inia geoffrensis) precludes collection of the high-molecular weight DNA. Image sources: Merlin D. Tuttle/Science Source (a); Stephen J. Krasemann/Science Source (b); Allyson Hindle (c); Sébastien J. Puechmaille (CC BY-SA) (d); M. Watson/Science Source (e).
Extended Data Fig. 2 Sample collection can be challenging, and sequencing methods must be selected to handle the sample quality.
To enable the inclusion of species from across the eutherian tree (including from the 50% of mammalian families not represented in existing genome databases), the Zoonomia Project needed sequencing and assembly methods that produce reliable data from DNA collected in remote locations, sometimes in only modest quantities and often without benefit of cold chains for transport. a, For the marine species such as the narwhal (Monodon monoceros), simply accessing an individual in the wild can prove challenging. For example, to sample DNA from the near-threatened narwhal, M.N. and Inuit guide D. Angnatsiak camped on the edge of an ice floe between Pond Inlet and Bylot Island, at the northeastern tip of Baffin Island. After a narwhal was collected by Inuit hunters as part of an annual hunt, hours of flensing were necessary for the collection of tissue samples. From left to right, F. McCann, H. C. Schmidt, F. Eichmiller, M.N., J. Orr (facing backward) and J. Orr (standing). b, For endangered species such as the Hispaniolan solenodon (S. paradoxus), sample collection must be designed to minimize stress to the individual, limiting the amount of DNA that can be collected22. To collect DNA from the endangered solenodon without imposing stress on individuals in the wild, N.R.C. turned to the world’s only captive solenodons, which are housed off-exhibit at ZOODOM in the Dominican Republic. With help from veterinarians at the zoo, N.R.C. collected a small amount of blood from the rugged tail of the solenodon. Narwhal photograph by G. Freund, and courtesy of M.N. Solenodon photograph courtesy of L. Emery.
Extended Data Table 1 The Zoonomia Project data includes 132 genome assemblies
Extended Data Table 2 Power to detect constraint across datasets
Extended Data Table 3 Diversity statistics are not correlated with other species-level phenotypes
Supplementary information
Source data
Rights and permissions
Open Access This article is licensed under a Creative Commons Attribution 4.0 International License, which permits use, sharing, adaptation, distribution and reproduction in any medium or format, as long as you give appropriate credit to the original author(s) and the source, provide a link to the Creative Commons license, and indicate if changes were made. The images or other third party material in this article are included in the article’s Creative Commons license, unless indicated otherwise in a credit line to the material. If material is not included in the article’s Creative Commons license and your intended use is not permitted by statutory regulation or exceeds the permitted use, you will need to obtain permission directly from the copyright holder. To view a copy of this license, visit http://creativecommons.org/licenses/by/4.0/.
About this article
Cite this article
Zoonomia Consortium. A comparative genomics multitool for scientific discovery and conservation.Nature 587, 240–245 (2020). https://doi.org/10.1038/s41586-020-2876-6
- Received: 17 April 2019
- Accepted: 27 July 2020
- Published: 11 November 2020
- Issue Date: 12 November 2020
- DOI: https://doi.org/10.1038/s41586-020-2876-6