CO2 Mitigation Potential of Plug-in Hybrid Electric Vehicles larger than expected (original) (raw)
Real-world electric driving shares
Here, we analyse average UF from 73,000 PHEV covering 16 different PHEV models driven in the US and Germany. Our data has been collected from vehicle usage monitoring websites (voltstats.net and spritmonitor.de) as well as data collections from fleet tests by US research institutes (UC Davies and Idaho National Lab) and car manufacturers[7](/articles/s41598-017-16684-9#ref-CR7 "California Air Resources Board, California’s Advanced Clean Cars Midterm Review - Summary Report for the Technical Analysis of the Light Duty Vehicle Standards https://www.arb.ca.gov/msprog/acc/mtr/acc_mtr_finalreport_full.pdf
               (2017)."),[8](/articles/s41598-017-16684-9#ref-CR8 "Voltstat, Mobility data of Chevrolet Volt,
                http://www.voltstats.net/Stats/LeaderboardTableJson

               (2014)."). Real-world UF depend strongly on the AER and thus differ considerably between PHEV models (cf. Figure [1](/articles/s41598-017-16684-9#Fig1)). The typical AER of current PHEV models amounts to about 50 km in the New European Driving Cycle (NEDC) – currently applied in Europe and China. Note that real-world AER are often shorter than the official NEDC ranges since real-world energy consumption of passenger cars is currently about 30–40% higher than NEDC values[9](/articles/s41598-017-16684-9#ref-CR9 "Mock, P. et al., From laboratory to road – a 2014 update of official and “real-world” fuel consumption and CO2 values for passenger cars in Europe, ICCT White Paper (2014)."). The higher energy consumption in real-world usage also leads to smaller UF than expected from NEDC values (cf. Figure [A-2](/articles/s41598-017-16684-9#MOESM1) in the supplementary materials). The NEDC estimate for the UF is based on norm ECE R101[10](/articles/s41598-017-16684-9#ref-CR10 "UNECE United Nations Economic Commission for Europe, Regulation No. 101
                http://www.unece.org/trans/main/wp29/wp29regs/r101r2e.pdf

               (2015).") and given by UFNEDC \= AER/(AER + 25 km). Several studies measure real-world UF for various PHEV models over the recent years. In the US, AER are obtained from EPA testing procedures and published by the US Department of Energy[11](/articles/s41598-017-16684-9#ref-CR11 "EPA (United States Environmental Protection Agency), Light-Duty Automotive Technology, Carbon Dioxide Emissions, and Fuel Economy Trends: 1975 through 2015. United States Environmental Protection Agency Report 2015

                https://www3.epa.gov/fueleconomy/fetrends/1975-2015/420r15016.pdf

               (2015)."). EPA testing procedures are usually more stringent than NEDC and lead to about 25% smaller AER (when comparing models that are available in both markets).
Figure 1
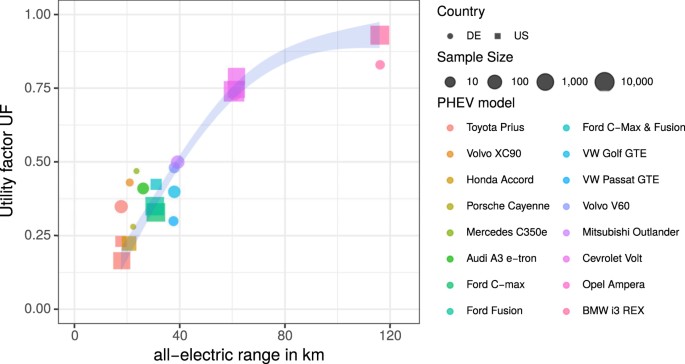
Real-world utility factors of PHEV in the US (squares) and Germany (circles) with different AER. Shown are mean values per PHEV model sorted by increasing AER with the symbol size indicating the size of the sample as well as a sample size weighted local regression (shaded area). We use EPA AER for US models and 75% NEDC AER for German models.
Combining the US and German data one obtains distributions of real-world UF for different AER. Figure 1 shows the average UF for different PHEV models in the US and Germany. We use the EPA AER for the US models and 75% of the NEDC AER for German PHEV models.
A local regression shows that about 30% UF can be expected for a 25 km AER that increases to almost 50% for 40 km AER (corresponding to 50 km NEDC AER). Beyond that range, the gain in UF per additional km of AER lessens. Furthermore, the difference between real-world and test-cycle UF decreases with growing AER (cf. Figure A-1 in the supplementary materials).
Despite the AER, several factors influence an individual PHEV’s UF. The re-charging frequency and the distribution of driving distances can significantly affect the individual UF such as recharging at work or during stops of long-distance driving. For example, if company car drivers have to pay for electricity at home but do not for conventional fuel, they show much lower average UF than private car buyers12. Furthermore, many long-distance trips without recharging lead to a lower UF and are correlated with high annual-mileage. Thus very high annual vehicle kilometres travelled (VKT) leads to lower average UF[13](/articles/s41598-017-16684-9#ref-CR13 "Plötz, P., Funke, S.A. and Jochem, P., Empirical fuel consumption and CO2 emissions of plug-in hybrid electric vehicles. Journal of Industrial Ecology, https://doi.org/10.1111/jiec.12623
(2017).").Travel Distance Electrification
Based on the actual UF in different markets we can compare the average annual kilometres electrified by PHEV and BEV in Germany and the US (cf. Figure 2). The sample comprises 73,000 PHEV and 49,000 BEV from the US and Germany. For PHEV the total annual VKT have to be combined with the UF to obtain the electric annual VKT. For BEV, the total annual VKT is identical to the electric annual VKT. All models show high annual driving with an average annual VKT of 21,700 km for the PHEV and 18,400 km for BEV compared to annual averages of 18,600 km for the US[14](/articles/s41598-017-16684-9#ref-CR14 "FHA (Federal Highway Administration), Highway Statistics 2013-Table VM-1 www.fhwa.dot.gov/policyinformation/statistics/2013/vm1.cfm
               (2013).") and 14,300 km for Germany[15](/articles/s41598-017-16684-9#ref-CR15 "Plötz, P., Schneider, U., Globisch, J. & Dütschke, E. Who will buy electric vehicles? Identifying early adopters in Germany. Transportation Research Part A: Policy and Practice
                       67, 96–109 (2014)."). Per PHEV model averages range from 14,500 to 32,700 km and per BEV model averages range from 12,700 to 34,600 km (for Tesla Model S – not shown in Fig. [2](/articles/s41598-017-16684-9#Fig2)).
Figure 2
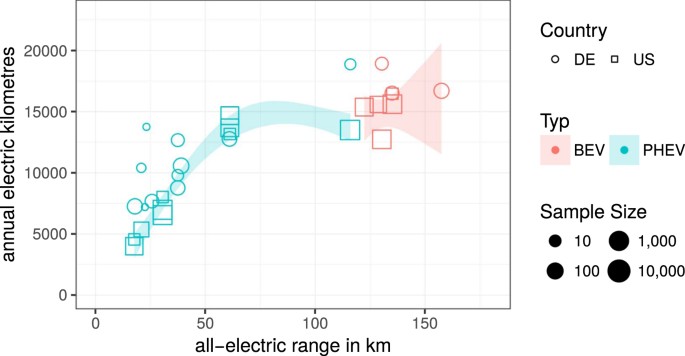
Average electrified annual kilometres for different PHEV (green) and BEV (red) models from the US (squares) and Germany (circles). The shaded areas are sample size weighted local smoothers (95% confidence bands).
Not surprisingly, the average number of annually electrified kilometres increases with AER. Figure 2 shows that long-ranged PHEV with AER around 60 km achieve about 12–15,000 electrified VKT similar to BEV with about 12–17,000 km. But a 60 km PHEV requires only about half the battery capacity for this electric mileage. Accordingly, battery usage as measured in annual electrified VKT per kilometre of AER is much higher for PHEV. While PHEV achieve an average of 218 electrified VKT per km of AER, BEV yield about 108 km of electrified VKT per km of AER. Thus, for a given battery size PHEV electrify about twice as much of their annual VKT. The basic reason is that PHEV electrify a noteworthy share of every day’s VKT whereas BEV electrify all VKT on some days only (cf. Figure 3).
Figure 3
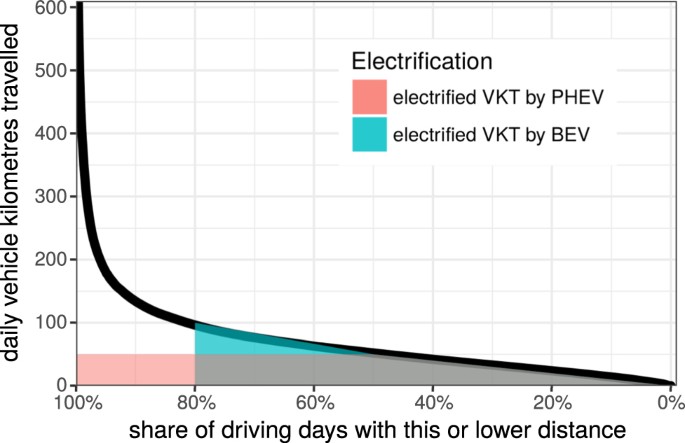
Overall distribution of daily VKT for a large daily driving data set. Also shown are the annual electrified VKT by BEV and PHEV with typical ranges as shaded areas under the curve.
The high utilisation of PHEV batteries compared to BEV batteries can be illustrated by the distribution of individual daily driving distances[16](/articles/s41598-017-16684-9#ref-CR16 "Björnsson, L.-H. & Karlsson, S. Plug-in hybrid electric vehicles: How individual movement patterns affect battery requirements, the potential to replace conventional fuels, and economic viability. Applied Energy 143, 336–347, https://doi.org/10.1016/j.apenergy.2015.01.041
(2015)."). Figure [3](/articles/s41598-017-16684-9#Fig3) shows the distribution of all daily VKT extracted from the full sample of the voltstats.net database (1,738 PHEV, thick black line). The vehicles are all Chevrolet Volt PHEV from North America with an average annual VKT similar to the US average. Typically, about 80% of the daily VKT are below 100 km and well within BEV ranges. The electrified VKT by BEV and PHEV are illustrated as shaded polygons in Fig. [3](/articles/s41598-017-16684-9#Fig3) with assumed BEV range of 100 km and AER of 50 km for a PHEV. Yet, the areas of both polygons are similar: the BEV triangle has an area of ½ · 80% · 100 km · 365 = 14,600 electrified VKT and the PHEV polygon is a small triangle ½ · 50% · 50 km · 365 plus a larger rectangle 50% · 50 km · 365 summing up to 13,700 electrified VKT. Both numbers for total electrified VKT are in line with typical values from Fig. [2](/articles/s41598-017-16684-9#Fig2).In the future, when more fast charging stations will be available, BEV are going to increase their electrified VKT significantly as more trips will become feasible with inter-mediate charging. This implies that more long range trips could be electrified by BEV (the green triangle in Fig. 3 grows to the left). In principle, PHEV could also recharge during long-distance trips but the small AER requires many breaks for recharging and users might prefer to refuel their fuel tank instead. Yet this also depends on the dimensioning of battery and tank capacities of PHEV.
Impact on Greenhouse Gas Emissions
The higher utilisation of the given battery has implications for the life cycle CO2eq emissions of PHEV as compared to BEV. While the current emissions during the vehicle construction are higher for BEV (due to the higher battery capacity), the higher emissions during the vehicle usage phase by the combustion engine is balancing this PHEV advantage.
Today, one kWh of battery capacity causes about 100 kg CO2eq emissions during its construction phase17 (see also in the supplementary materials). Consequently, the additional construction phase emissions for the battery are smaller for PHEV (on average 0.6 t of CO2eq) than for BEV (on average 2.6 t of CO2eq). Yet, PHEV include internal combustion engines and complex gear boxes, which lead to additional emissions of about 0.6 t of CO2eq per vehicle during the construction phase (see supplementary materials).
Thus, currently the overall CO2eq emissions from vehicle construction are about 1.4 t higher for BEV than for PHEV. Learning effects in battery production together with an improved electricity mix might even decrease this disadvantage in the future (cf. Figure A-5 in the supplementary materials).
During the vehicle usage phase BEV might outweigh their disadvantage if their VKT is high and electricity causes few CO2eq emissions. For keeping our results comparable and comprehensible, we take for both countries average emissions values for electricity generation of 500 gCO2eq/kWh (c.f. Figure A-4 in the supplementary materials). The gross specific energy consumption for electric driving is assumed to be 0.20 kWh/km (see SM). This leads to an emission factor of 100 gCO2eq/km in charge depleting mode, while we assume for the charge sustaining mode a real world emission factor of 120 gCO2eq/km (corresponding to 4.6 l/100 km). Over lifetime the overall CO2eq emissions of our PHEV and BEV under investigation show similar values. When assuming short life times, the PHEV is advantageous, while for longer vehicle life time (above 10 years) the BEV becomes more attractive. We assume that the lifetime of the battery equals the lifetime of the vehicle (even though this might be optimistic for our assumed usage phase of 12 years). The overall emission reductions from EV compared to conventional vehicles amount in average to 0.6 t of CO2eq for PHEV and 0.2 t of CO2eq for BEV for eight years of vehicle life times; for life times below 4 years, the BEV advantage to conventional cars becomes even negative (c.f. Figure 4). Per battery capacity, the CO2eq advantage from PHEV at the current electricity mix emissions exceeds those from BEV significantly. For a twelve-year vehicle life time the advantage for our global climate per battery capacity is almost fourfold (i.e. 43 vs 12 kg CO2eq per km AER, see Fig. 4).
Figure 4
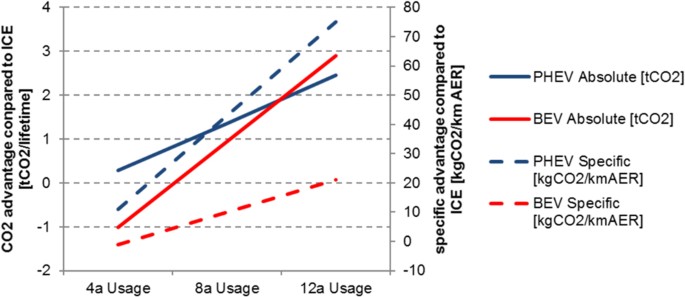
Lifecycle advantages of CO2eq emissions from PHEV and BEV compared to conventional vehicles on an absolute scale and relative to battery capacity.
The specific emissions from the electricity grid are very decisive. An average emissions value of 470 gCO2eq per kwh (i.e. 6% improvement) outweighs already the advantages for PHEV for the eight-year life time scenario. Hence in all American states with better specific emission levels than Alabama (c.f. Figure A-4 in the supplementary materials), BEV are already favourable in our scenario setting. In the future, when the electricity generation decarbonizes and the emission during battery production decline, the BEV will become more and more advantageous for reducing greenhouse gas emissions. In 2030, where the energy transition reduced specific emissions in Germany down to about 290 gCO2eq per kWh18, the advantage of EV will be preeminent: during an eight-year life time the absolute gain in CO2eq emissions compared to improved conventional vehicles with average real-world emissions of 100 gCO2eq per km, amounts to 2.2 t of CO2eq for PHEV and 3.1 t of CO2eq for BEV. This corresponds to specific advantages of 69 kg of CO2eq per km AER for PHEV and 20 for BEV. Hence, while for green electricity the absolute emissions for BEV becomes very favourable, the PHEV can still outperform in terms of specific emissions for per km AER for current driving profiles.