Upregulated PrPC by HBx enhances NF-κB signal via liquid–liquid phase separation to advance liver cancer (original) (raw)
Introduction
Globally, primary liver cancer ranks as the third most prevalent cause of tumor-related mortality1,2. Chronic hepatitis B virus (HBV) infection is the most common cause of hepatocellular carcinoma (HCC) in China3,4. However, the precise cellular and molecular mechanisms underlying HBV-associated HCC remain elusive.
The PRNP gene encodes cellular prion protein (PrPC), a highly conserved glycoprotein primarily localized on the cell surface but also detectable in soluble form within the cytoplasm, exosomes, and vesicles5,6,7. While PrPC is mainly recognized for its involvement in prion diseases8,9,10, it is also been implicated in carcinogenesis11,12. Although PrPC expression is typically low in most tissues, it exhibits elevated levels in various tumor tissues and possesses the potential to accelerate cancer progression through multiple biological pathways13,14. Despite lacking a kinase-active region, PrPC has been widely associated with signal transduction across different cancers6,15,16. Nevertheless, the precise mechanisms by which PrPC modulates distinct signaling pathways in tumors remain unclear.
Biomolecular condensates are membrane-less organelles capable of sequestering specific reactive molecules through liquid-liquid phase separation (LLPS). Scaffold proteins facilitate the aggregation of proteins, nucleic acids, and other biomolecules via LLPS, resulting in various biological events17,18. Recent studies show that biomolecular condensates are widely involved in intracellular activities such as signal transduction (e.g., NF-κB, Hippo, and cGAS-STING signaling pathways), stress responses, and regulation of gene expression17,19,20,21,22,23. Particularly, in recent years, the significance of biomolecular condensates in tumor development has gained much recognition24,25,26. PrPC, a multifunctional protein with diverse functions depending on cell type and ligand binding, is considered to act as a scaffold protein27. Recent studies have shown that PrPC undergoes LLPS under certain conditions in vitro28,29,30,31. Moreover, it undergoes phase transition triggered by Alzheimer’s disease-related amyloid-β oligomers at the cell surface32. However, it remains unknown whether and how PrPC undergoes LLPS in cells and what roles and molecular mechanisms are involved.
In this study, we aim to investigate the role of PrPC in liver cancer and its underlying mechanism. Our findings demonstrated a frequent upregulation of PrPC expression, particularly in hepatitis B virus-positive HCC. Moreover, our data also reveal elevated levels of PrPC were associated with poor prognosis in HCC patients. Additionally, we identified that HBx-mediated upregulation of PrPC promoted tumorigenesis both in vitro and in vivo by activating the NF-κB pathway. Mechanistically, we discovered that PrPC formed biomolecular condensates through LLPS, facilitating the recruitment of TRAF2/6, TAB2/3, and TAK1 complexes which further activated the NF-κB signaling pathway. Importantly, co-localization analysis revealed the presence of PrPC condensates with TRAF2, TAB2, and TAK1 within liver cancer tissues from HCC patients. Furthermore, our investigation unveiled for the first time that the α3 helix of PrPC played a pivotal role in the LLPS process. Notably, disulfide bond formation within PrPC’s C-terminal domain was found to be essential for LLPS as well as activation of the NF-κB signaling pathway. Collectively, our study provides comprehensive insights into the involvement and precise mechanisms underlying LLPS mediated by PrPC in liver cancer cells while suggesting a potential novel avenue for tumor treatment.
Results
PrPC expression is upregulated via HBx
To investigate the role of PrPC in HCC, we first analyzed The Cancer Genome Atlas Liver Hepatocellular Carcinoma (TCGA-LIHC) data in combination with GTEx data, which showed that PrPC expression was significantly higher in HCC tissues than in normal tissues (Fig. 1A). Furthermore, HCC patients with high PrPC expression had a lower survival rate than those with low PrPC expression (Fig. 1B). As chronic HBV infection is prevalent among HCC patients in China, we further explored the correlation between HBV and PrPC expression in liver cancer tissues. It’s noteworthy that PrPC expression was substantially higher in HBV-positive HCC tissues than in normal tissues, according to TCGA-LIHC data combined with GTEx data (Fig. 1C). To confirm further whether HBV infection upregulates PrPC, we compared different HBV-positive and negative HCC cell lines. The results showed that PrPC expression was significantly higher in HepG2 2.15 cells (HepG2 cells with stable integration of the HBV genome) than in HepG2 cells (Fig. 1D). Additionally, inhibition of HBV production in HepAD38 cells significantly reduced the expression of PrPC (Fig. 1E). In HBV infection cell models, expression of PrPC in HepG2-NTCP cells was significantly increased after HBV infection (Fig. 1F). Moreover, HBV infection induced the expression of PrPC in a concentration-dependent manner in HepG2 and Huh7 cells (Fig. 1G).
Fig. 1: PrPC is more highly expressed in HBV-positive liver cancer tissues than in normal liver tissues.
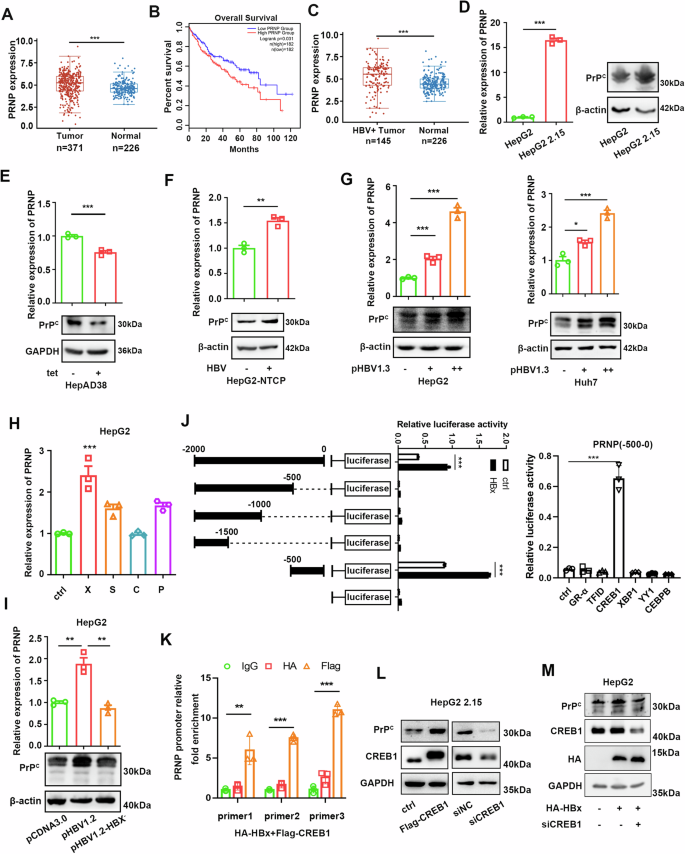
A TCGA and GTEx databases were used to analyze PrPC mRNA expression in liver cancer and normal liver tissues. The line shows the average value. Data were analyzed using Wilcoxon two-tailed t-tests. The data used in this study are standardized Transcripts Per Kilobase of exon model per Million mapped reads (TPM) data. B Overall survival rate of LIHC patients with high or low levels of PRNP mRNA in liver cancer tissues in the GEPIA website. Group cutoff: high=50%, low = 50%, high = 182, low = 182. C TCGA and GTEx databases were used to analyze PrPC mRNA expression in HBV-positive liver cancer and normal liver tissues. The line shows the average value. Data were analyzed using Wilcoxon two-tailed t-tests. The data used in this study are standardized TPM data. D Expression levels of PrPC in HepG2 and HepG2 2.15 cells were detected by qPCR and western blotting. E The expression of PrPC in HepAD38 cells was detected by qPCR and western blotting. Tetracycline was used to inhibit HBV production by HepAD38 cells. F qPCR and western blotting were used to measure the expression of PrPC in HepG2-NTCP cells infected with HBV. MOI = 500. G qPCR and western blotting were used to measure changes in PrPC expression in HepG2 and Huh7 cells transfected with pHBV1.3 plasmids. + represents 1 µg plasmid, and ++ represents 2 µg plasmid. H The mRNA levels of PrPC were detected after transfection of empty vector, pXJ40-HA-HBx, pXJ40-HA-HBS, pXJ40-HA-HBC, and pXJ40-HA-HBP in HepG2 cells. I After transfection with pcDNA3.0, pcDNA3.0-HBV1.2, or pcDNA3.0-HBV1.2-X-, the mRNA and protein expression levels of PrPC in HepG2 cells were detected. J Luciferase activity of different PRNP promoter constructs in 293T cells transfected with HBx or empty vector (left). Luciferase activity of PRNP (-500-0 bp) promoter constructs in 293T cells transfected with transcription factors CREB1, YY1, XBP1, CEBPB, GR-α, TFID, or empty vector (right). K Huh7 cells transfected with Flag-CREB1 and HA-HBx were subjected to ChIP assay with three sets of primers in the PRNP promoter region (-500-0 bp). L Western blotting was used to measure the protein level of PrPC in HepG2 2.15 cells transfected with pXJ40-flag-CREB1 or empty vector, CREB1 siRNAs, or siNC. M HepG2 cells were co-transfected with the plasmid expressing HBx and/or CREB1 siRNAs or siNC, and the PrPC protein level was analyzed. Data are means ± SEM. Student’s _t_-tests were used to determine group differences. *p < 0.05; **p < 0.01; ***p < 0.001.
Numerous studies have shown that HBx protein plays a key role in regulating gene expression and promoting carcinogenesis in HBV-related HCC33,34. To study how HBV induces PrPC expression, we transiently transfected various HBV genes in HepG2 cells. We found the level of PrPC expression was significantly elevated only in cells transfected with the HBx gene (Fig. 1H). In addition, unlike the pHBV1.2 plasmid, the pHBV1.2-X– plasmid, in which the HBx gene was deleted, failed to enhance PrPC expression when transfected into HepG2 cells (Fig.1I). HBx, the most critical oncogenic component of HBV proteins, lacks double-stranded DNA-binding activity. It can regulate the expression of numerous downstream genes by interacting with transcription factors and acting as a trans-activator to activate multiple signaling cascades33. To investigate how HBx affects the transcription of the PRNP gene, we constructed a series of PRNP promoter truncation mutants and verified them using a dual-luciferase assay. Promoter activity analysis revealed that the -500-0 region has a potential binding site for HBx (Fig. 1Jleft panel). Next, by predicting this sequence using ALGGE Promo and JASPAR websites, we obtained some candidate transcription factors. Dual-luciferase assay demonstrated that CREB1 is the primary transcription factor responsible for PRNP transcription (Fig. 1J right panel). Our previous studies have demonstrated that HBx can bind CREB1 and thus upregulate miR-520c-3p35. Further chromatin immunoprecipitation (ChIP) assay showed CREB1 was bound to the PRNP promoter region containing CREB1 binding sites in cells transfected with the CREB1 plasmid (Fig. 1K). Western blotting experiments confirmed that overexpression of CREB1 proteins can promote PrPC expression in HepG2 2.15 cells, while knockdown of CREB1 protein showed the opposite result (Fig. 1L). In addition, the knockdown of CREB1 inhibited the ability of HBx to promote PrPC expression in HepG2 cells (Fig. 1M). Overall, these results suggest that HBx can bind to the promoter of the PRNP gene by binding with the transcription factor CREB1, which in turn regulates PRNP expression.
PrPC promotes the proliferation and metastasis of HCC in vitro
It is well known that HBx is associated with tumorigenesis, but whether HBx upregulation of PrPC expression plays a role in the development of hepatocellular carcinoma remains unclear. To address this question, we knocked down PrPC in HepG2 2.15 cells. We performed CCK8 assay (Supplementary Fig. 1A left panel), clone formation assay (Supplementary Fig. 1B left panel), and EdU experiments (Supplementary Fig. 1C up panel). The results showed that the proliferation of HepG2 2.15 cells was inhibited when PrPC was knocked down. Furthermore, transwell experiments revealed that silence of PrPC suppressed the migration and invasion of HepG2 2.15 cells (Supplementary Fig. 1D, E up panel). When PrPC was upon overexpression, whereas the opposite result occurred in proliferation, migration, and invasion (Supplementary Fig. 1A–E). Finally, we also identified that PrPC can enhance the proliferation, migration, and invasion of Huh7 and HCCLM3 cells upon overexpression (Supplementary Fig. 2A–D). These results indicate that PrPC promotes the proliferation and metastasis of liver cancer cells.
PrPC promotes cell proliferation and migration by activating the NF-κB signaling pathway
PrPC contributes to tumorigenesis via various signaling pathways in different cancers16,36. To identify which signaling pathway PrPC regulates in HBV-associated tumor cells, we conducted transwell and EdU assays using specific signaling pathway inhibitors in HepG2.2.15. Interestingly, only SC-514 inhibited the promotion of proliferation and migration mediated by PrPC (Fig. 2A), suggesting that PrPC might promote HBV-related tumors by activating the NF-κB signaling pathway. Further experiments confirmed that knockdown of PrPC inhibited the phosphorylation of IκBα, reduced the expression of NF-κB downstream genes such as c-myc and cyclin D1, and suppressed cell proliferation and epithelial-mesenchymal transition (EMT), while overexpression of PrPC had the opposite effect (Fig. 2B). In addition, knocking down of PrPC resulted in decreased nuclear content of p65; however, this change was reversed upon overexpression of PrPC (Fig. 2C). Finally, dual-luciferase assays demonstrated that PrPC enhanced the luciferase activity of NF-κB (Fig. 2D).
Fig. 2: PrPC promotes the proliferation and migration of hepatoma cells by activating the NF-κB signaling pathway.
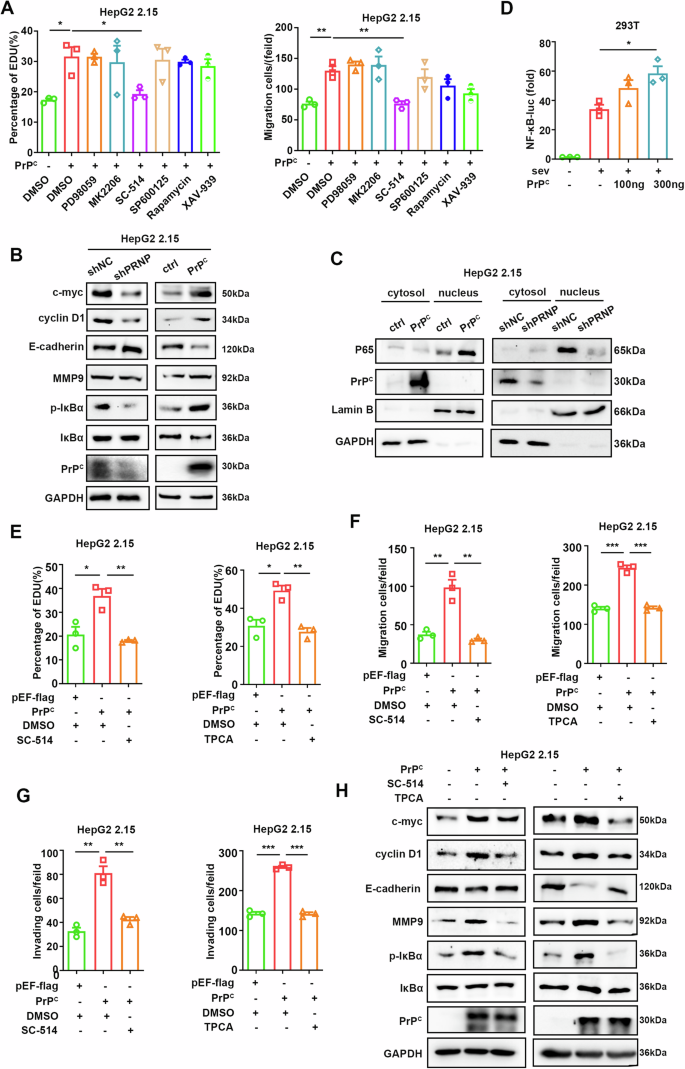
A EdU assays (left) and transwell experiments (right) were performed to screen for the signaling pathways required for the effects of PrPC on HepG2 2.15 cells. Signaling pathway inhibitors (100 μM PD98059 for MAPK/ERK, 10 μM MK2206 for AKT, 10 μM SC-514 for NF-κB, 10 μM SP600125 for JNK, 1 μM rapamycin for mTOR, 10 μM XAV-939 for Wnt and control agent DMSO) were added to cell culture medium 24 h after transfection. B Immunoblotting assays were used to detect marker proteins for cell proliferation, migration, and NF-κB pathway activation after knockdown or overexpression of PrPC in HepG2 2.15 cells. C Nuclear localization of the p65 protein was detected in HepG2 2.15 cells after overexpression or knockdown of PrPC. D HEK293T cells were transfected with NF-κB-luciferase (Luc) reporter along with empty vector (EV) or plasmids expressing PrPC followed by SeV treatment for 8 h. Lysates were collected 36 h post-transfection, and luciferase activities were measured. E EdU assays were performed after PrPC was overexpressed in HepG2 2.15 cells followed by treatment with the inhibitors SC-514 (100 μM) (left) and TPCA (100 μM**)** (right). F, G Transwell assays were performed to detect the migration (F) and invasion (G) of HepG2 2.15 cells after overexpression of PrPC, and cells were treated with the inhibitors SC-514 (100 μM) (left) and TPCA (100 μM) (right). H Western blotting assays were performed to detect marker proteins for cell proliferation, migration, and NF-κB pathway activation in HepG2 2.15 cells after overexpression of PrPC and treatment with SC-514 (100 μM). Data are means ± SEM. Student’s t-tests were used to determine group differences. *p < 0.05; **p < 0.01; ***p < 0.001.
To further confirm, the oncogenic effect of PrPC is related to its ability to activate the NF-κB pathway. We employed specific inhibitors for this pathway, such as SC-514 and TPCA, in EdU assays and transwell experiments during overexpression of PrPC. The results showed that the enhancement of HepG2 2.15 cell proliferation, migration, and invasion in response to PrPC was inhibited by SC-514 and TPCA (Fig. 2E–G). Similar results were obtained in HepAD38 cells as well (Supplementary Fig. 2E–H). Furthermore, inhibition of the NF-κB pathway attenuated the increase induced by PrPC on IκBα phosphorylation, c-myc, cyclin D1 expression, and EMT (Fig. 2H). Overall, these results suggest that PrPC activates the NF-κB pathway to promote the proliferation and metastasis of HBV-relational tumor cells.
PrPC activates the NF-κB pathway at the TAB2/TAB3 and its upstream level by the α3 helix
PrPC promotes tumorigenesis via different signaling pathways depending on binding with different ligands27. To determine which key molecules of the NF-κB interacted with PrPC in the NF-κB signaling pathway, we co-transfected PrPC with key molecules of the NF-κB pathway (Fig. 3A). To our surprise, co-immunoprecipitation analysis showed that PrPC interacted with most upstream molecules of the NF-κB pathway, including MYD88, TRAF2, TRAF6, TAB2, TAB3, and TAK1, but not TAB1, IKKα, and IKKβ (Fig. 3B). Furthermore, overexpression of PrPC enhanced the activation of NF-κB induced by MYD88, TRAF2, TRAF6, TAB2, or TAB3 but did not affect TAK1 + TAB1, IKKβ, or p65-mediated activation (Fig. 3C). These data indicated that PrPC affected NF-κB activation at the TAB2/TAB3 and its upstream level. To screen out the domains of PrPC that interact with NF-κB pathway kinases, various truncated PrPC plasmids were constructed based on their structural characteristics37 (Fig. 3D). The results showed that PrP125-231 interacted with MYD88, TRAF2, TRAF6, TAB2, TAB3, and TAK1 proteins as full-length PrPC, whereas PrP23-199 which lacked α3 helix did not interact with these proteins (Fig. 3E, F), suggesting that PrPC may promote NF-κB signaling activation by recruiting the kinase molecules upstream of the NF-κB pathway via the α3 helix. Dual-luciferase assays also showed that only the C-terminal domain PrP125-231 promoted activation of the NF-κB signaling pathway, whereas truncated mutant PrP23-199 did not stimulate the NF-κB signaling (Fig. 3G). Furthermore, we confirmed that only PrPC and PrP125-231 can promote the proliferation, migration, and invasion of tumor cells (Supplementary Fig. 2I, J). These findings suggested the α3 helix of PrPC was required for the recruitment of signaling molecules and promoted activation of the NF-κB pathway at the TAB2/TAB3 and its upstream level.
Fig. 3: PrPC activates the NF-κB pathway at the TAB2/TAB3 and its upstream level.
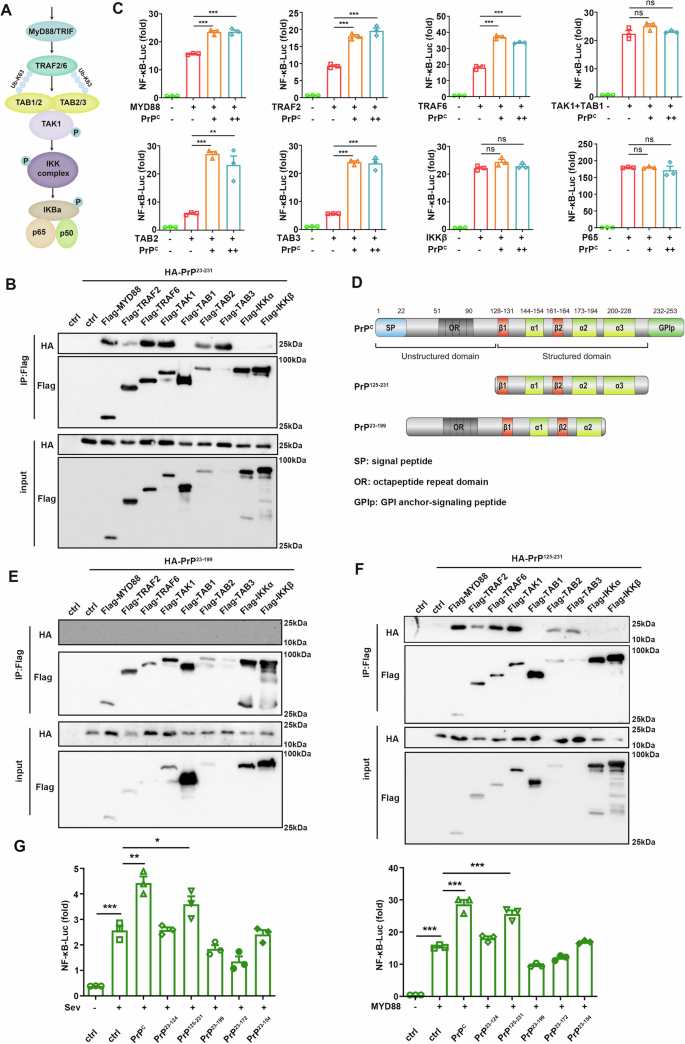
A Schematic diagram of NF-κB signaling pathway. C HEK293T cells were transiently transfected with NF-κB luciferase reporter, pRL-TK, or empty vector, and increasing amounts of PrPC together with plasmids expressing MYD88, TRAF2, TRAF6, TAK1, TAB1, TAB2, TAB3, IKKβ, or p65. The cell lysate was collected 36 h after transfection, and luciferase activity was detected. D Schematic illustration of PrPC domain organization. B, E, F HEK293T cells were transiently transfected with plasmids expressing HA-PrP23-231 (B), HA-PrP23-199 (E), and HA-PrP125-231 (F) proteins together with plasmids expressing Flag-MYD88, Flag-TRAF2, Flag-TRAF6, Flag-TAK1 and Flag-TAB1, Flag-TAB2, Flag-TAB3, Flag-IKKα, Flag-P65, or Flag-empty vector, and cells were harvested 36 h later. Whole-cell lysates were subjected to immunoprecipitation with anti-Flag beads and analyzed by western blotting with the indicated antibodies. *p < 0.05; G HEK293T cells were transfected with NF-κB luciferase reporter, pRL-TK, and pXJ40-HA, pXJ40-HA-PrPC, pXJ40-HA-PrP23-124, pXJ40-HA-PrP125-231, pXJ40-HA-PrP23-199, pXJ40-HA-PrP23-172, or pXJ40-HA-PrP23-154 plasmids. Cells were collected 36 h after transfection, and SeV was added to the medium 8 h before sample collection (left). MYD88 was used instead of SeV to activate the NF-κB pathway (right). Luciferase activity was measured after cell lysis. Data are means ± SEM. Student’s _t_-tests were used to determine group differences. *p < 0.05; **p < 0.01; ***p < 0.001, ns: no significance.
PrPC forms biomolecular condensates to activate the NF-κB signaling pathway through LLPS in vivo
How does PrPC interact with such a diverse array of molecules in order to activate the NF-κB signal? Biomolecular condensates, a membrane-less organelle, can recruit a diverse array of components to accelerate or inhibit specific biochemical reactions through liquid-liquid phase separation (LLPS). To confirm whether PrPC can form condensate, which was observed as a punctum or aggregated dot in cells, we initially observed the intracellular distribution of endogenous PrPC. We found that it was widely distributed within cells, with a considerable portion of PrPC exhibiting as puncta (Fig. 4A, B). More importantly, we found more puncta in HepG2 2.15 cells compared to HepG2 cells (Fig. 4A). Meanwhile, the number of intracellular puncta in Huh7 cells increased after transfection with the pHBV1.3 plasmids (Fig. 4B).
Fig. 4: PrPC forms biomolecular condensates to activate the NF-κB signaling pathway through LLPS in vivo.
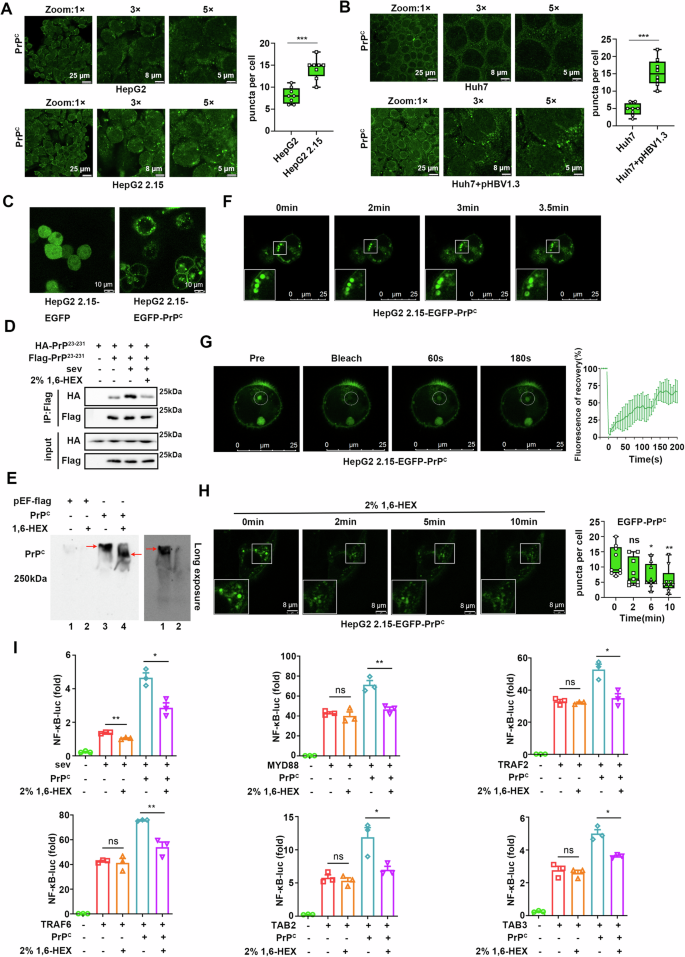
A Immunofluorescence staining of endogenous PrPC in HepG2 and HepG2 2.15 cells. Quantitative analysis of the puncta shown to the right. B Immunofluorescence staining of endogenous PrPC in Huh7 cells and Huh7 cells transfected with pHBV1.3 plasmids. Quantitative analysis of the puncta shown to the right. C Representative live-cell images of HepG2 2.15 cells stably expressing EGFP or EGFP-PrPC protein. D HEK293T cells were transfected with plasmids expressing HA-PrP23-231, flag-empty vector, or Flag-PrP23-231 and treated with SeV for 8 h followed by 2% 1,6-hexanediol 1 h before harvest. Whole-cell lysates were immunoprecipitated with anti-Flag beads and analyzed by western blotting with corresponding antibodies. E Plasmids expressing PrPC or empty vectors were transfected into HepG2 2.15 cells, and 2% 1,6-hexanediol was added 1 h before cells were harvested 48 h after transfection. Whole-cell lysates were subjected to native PAGE. Upper panel: short exposure; lower panel: long exposure for left two lanes. F Fusion analysis of EGFP-PrPC condensates in HepG2 2.15 cells. G FRAP assay of EGFP-PrPC condensates in HepG2 2.15 cells (left). Quantification of fluorescence recovery (right). H Time-lapse imaging of HepG2 2.15 cells stably expressing EGFP-PrPC protein after 2% 1,6-hexanediol treatment. Quantitative analysis of the puncta shown to the right. I HEK293T cells were transfected with NF-κB luciferase reporter, pRL-TK, or empty vector, and increasing amounts of PrPC together with plasmids expressing MYD88, TRAF2, TRAF6, TAB2, or TAB3 or stimulated with SeV for 8 h. Cells were collected 36 h after transfection, and 2% 1,6-hexanediol was added 1 h before sample collection. All scale bars are indicated in the figures. Data are means ± SEM. Student’s _t_-tests were used to determine group differences. *p < 0.05; **p < 0.01, ***p < 0.001, ns: no significance.
Although PrPC can undergo LLPS under certain conditions in vitro29,30,31, it remains unclear whether this event occurs in vivo. To address this question, we generated HepG2 2.15 and HepG2 cells that stably expressed EGFP-labeled PrPC. Images of living cells showed that PrPC was well positioned on the cell membrane and formed puncta in the cytoplasm (Fig. 4C and Supplementary Fig. 3A). To exclude the possibility that EGFP protein promotes protein aggregation, immunofluorescence staining was performed for HepG2 2.15 and HepG2 cells transiently transfected with PrPC. We found that PrPC not only localized on the cell membrane but also formed puncta in the cytoplasm (Supplementary Fig. 3B). Co-immunoprecipitation experiments using 293T cells showed that PrPC could aggregate and this ability was enhanced by viral stimulation, but was inhibited by the phase separation inhibitor 1,6-hexanediol (Fig. 4D). Additionally, native-PAGE analyses revealed that PrPC aggregated easily, which was partially inhibited by 1,6-hexanediol (Fig. 4E). As PrPC in normal cells is mainly located on the cell membrane and participates in the transport of membrane vesicles to form membranous structures, it is crucial to distinguish between puncta formed by PrPC and membranous organelles. Unsurprisingly, confocal microscopy demonstrated that EGFP-PrPC puncta did not co-localize with the endoplasmic reticulum, mitochondria, or peroxisomes but partially co-localized with early and late endosomes (Supplementary Fig. 3C), suggesting that a significant number of EGFP-PrPC puncta were membrane-less although some of them were membranous.
We next further explored whether PrPC could undergo LLPS in cells. First, we repeated the capacity of PrPC to undergo in vitro phase separation (Supplementary Fig. 3D–F; Movie 1). Then, we observed that intracellular EGFP-PrPC puncta fused via live imaging in HepG2 2.15 cells that stably expressed EGFP-PrPC (Fig. 4F; Supplementary Movie 2). More importantly, fluorescence recovery after photobleaching (FRAP) experiments indicated that the fluorescence of EGFP-PrPC puncta in cells recovered significantly within 3 min after bleaching (Fig. 4G; Supplementary Movie 3). Additionally, treatment with 1,6-hexanediol also significantly reduced the size and number of EGFP-PrPC puncta in HepG2 2.15 cells (Fig. 4H). These findings suggest that PrPC undergoes LLPS within cells to form biomolecular condensates. Notably, dual-luciferase assays revealed that PrPC significantly enhanced Sendai virus (SeV) activated NF-κB signaling in 293T cells, which was suppressed by 1,6-hexanediol. Moreover, 1,6-hexanediol inhibited PrPC-induced enhancement of NF-κB pathway activation by MYD88, TRAF2, TRAF6, TAB2, and TAB3 (Fig. 4I). Taken together, these results suggest that PrPC activates the NF-κB signaling pathway through LLPS.
PrPC condensates activate the NF-κB signaling pathway by recruiting TRAF2/6, TAB2/3, and TAK1 complexes
To further confirm that PrPC activates NF-κB by recruiting key molecules of the NF-κB pathway via LLPS, we performed immunofluorescence staining, which showed that TRAF2/TRAF6, TAB2/TAB3, and TAK1 co-localized with EGFP-PrPC condensates, while the TAB1, IKKα and IKKβ did not (Supplementary Fig. 4A). Notably, TRAF2/TRAF6 formed a circle around EGFP-PrPC condensates, whereas TAB2/TAB3 and TAK1 exhibited complete co-localization with them (Supplementary Fig. 4A). Triple co-localization analysis of EGFP-PrPC and mcherry-TAK1 with EBFP-TRAF2 or EBFP-TAB2 further confirmed these findings (Supplementary Fig. 4B). Since TRAF2/TRAF6 is a class of E3 ubiquitin ligases and previous studies show that ubiquitin molecules are key components in the formation of biomolecular condensates20, we found here that K63-linked ubiquitin chains co-localized with TRAF2 and co-coated EGFP-PrPC condensates (Supplementary Fig. 4C). In addition, we confirmed that cell membrane localization of PrPC was not necessary for the formation of biomolecular condensates and recruitment of NF-κB pathway molecules, as PrP23-231 (without the signal peptide) also exhibited this capacity (Supplementary Fig. 5).
To further validate this conclusion, we observed the intracellular distribution of endogenous PrPC. Immunofluorescence staining revealed that endogenous PrPC also co-localized with TRAF2, TAB2, and TAK1 proteins in HepG2 2.15 cells (Fig. 5A) and Huh7 cells transfected with pHBV1.3 (Fig. 5B). Among these, TRAF2 formed a large aggregate that encapsulated PrPC. Importantly, we also observed the presence of PrPC condensates and co-localization of PrPC with TRAF2, TAB2, and TAK1 in liver cancer tissues from HCC patients (Fig. 5C). In addition, the co-immunoprecipitation analysis revealed that the interaction between TAB2 and TAK1 was significantly enhanced by PrPC and inhibited by 1,6-hexanediol (Fig. 5D). Overexpression of PrPC significantly promoted the phosphorylation of TAK1, IKKβ, and IκBα, whereas 1,6-hexanediol counteracted this effect. Conversely, knockdown of PrPC led to the opposite results (Fig. 5E). Interestingly, recombinant mcherry-TAB2, mcherry-TAK1, and mcherry-TRAF2 proteins also co-localized well with EGFP-PrP23-231 droplets in vitro. Consistent with intracellular results, TAB2 and TAK1 proteins fully overlapped with PrP23-231 protein, whereas TRAF2 encapsulated PrP23-231 (Fig. 5F). Taken together, these results suggest that PrPC activates NF-κB signaling through the formation of biomolecular condensates by LLPS, which recruit TRAF2/6, TAB2/3, and TAK1 proteins.
Fig. 5: PrPC condensates activate the NF-κB signaling pathway by recruiting TRAF2/6, TAB2/3, and TAK1 complexes.
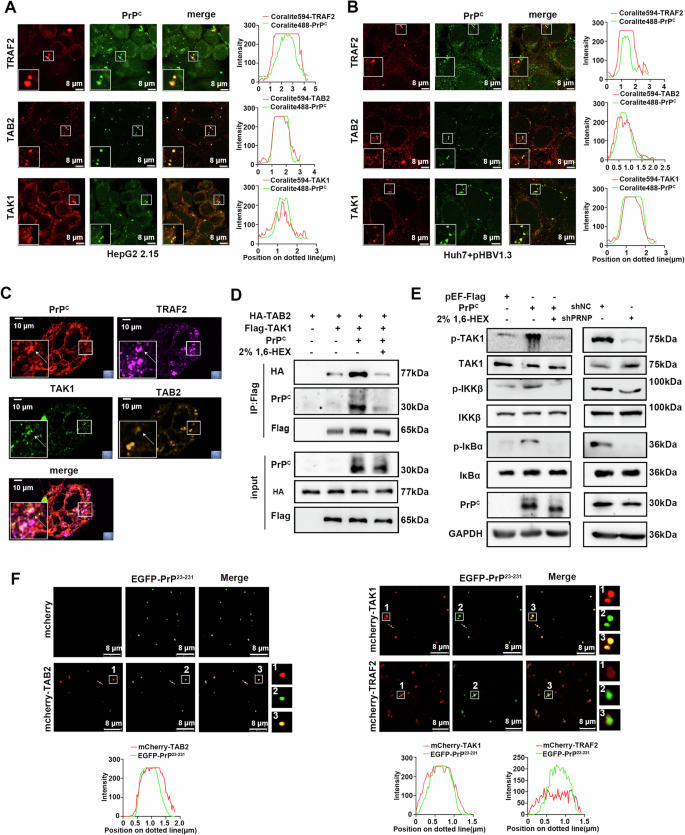
A Immunofluorescence was performed to stain endogenous PrPC, TRAF2, TAB2, or TAK1 proteins in HepG2 2.15 cells to determine the co-localization between PrPC and TRAF2/TAB2/TAK1 using confocal microscopy. Line profile of fluorescence (right). B Immunofluorescence was performed to stain endogenous PrPC, TRAF2, TAB2, or TAK1 proteins in Huh7 cells transfected with pHBV1.3 plasmids to determine the co-localization between PrPC and TRAF2/TAB2/TAK1 using confocal microscopy. Line profile of fluorescence (right). C Immunofluorescence staining of PrPC (red), TAB2 (orange), TAK1(green), and TRAF2 (pink) in liver sections from a liver cancer patient. D HEK293T cells were transfected with plasmids expressing HA-TAB2, Flag-TAK1, and PrPC and their corresponding empty plasmids. Cells were collected 36 h after transfection, and 2% 1,6-hexanediol was added 1 h before cell collection. Whole-cell lysates were immunoprecipitated with anti-Flag beads and analyzed by western blotting with corresponding antibodies. E HepG2 2.15 cells were transfected with pEF-flag and pEF-flag-PrPC or pLKO.1-shNC and pLKO.1-shPRNP plasmids. Cells were collected 48 h after transfection, and 2% 1,6-hexanediol was added to the medium 1 h before sample collection. F Representative images showing the distribution of TAB2, TAK1, and TRAF2 in PrP23-231 droplets in vitro. Line profile of fluorescence (down). All scale bars are indicated in the figures.
The C-terminal globular domain of PrPC forms condensates that recruit TRAF2/6, TAB2/3, and TAK1 complexes to activate the NF-κB signaling pathway
To probe the precise molecular structural basis of PrPC undergoing LLPS to recruit NF-κB pathway molecules in vivo, we constructed a series of truncated mutants of PrPC fused with EGFP protein to their N terminus (Supplementary Fig. 6A). Live-cell imaging revealed the presence of puncta in cells expressing various truncated mutations of PrPC, suggesting that LLPS may occur in both N- and C-terminal domain of PrPC (Supplementary Fig. 6B). However, dual-luciferase assays showed that only the C-terminal domain PrP125-231 promoted activation of the NF-κB signaling pathway, whereas truncated mutant PrP23-199 did not (Fig. 3G). We also found that purified recombinant EGFP-PrP125-231 protein formed circular droplets in vitro (Supplementary Fig. 6C), which exhibited fluorescence recovery within 6 min after photobleaching (Supplementary Fig. 6D; Movie 4). In addition, with an increase in EGFP-PrP125-231 protein concentration, a higher number of larger droplets were formed (Supplementary Fig. 6E). We also observed droplet fusion (Fig. 6A; Supplementary Movie 5) and rapid FRAP (Fig. 6B; Supplementary Movie 6) in HepG2 2.15 cells expressing EGFP-PrP125-231. These results collectively suggest that the C-terminal domain of PrPC is responsible for its NF-κB activation capability and can undergo LLPS.
Fig. 6: The globular domain of PrPC forms condensates and recruits TRAF2/6, TAB2/3, and TAK1 complexes to activate the NF-κB signaling pathway.
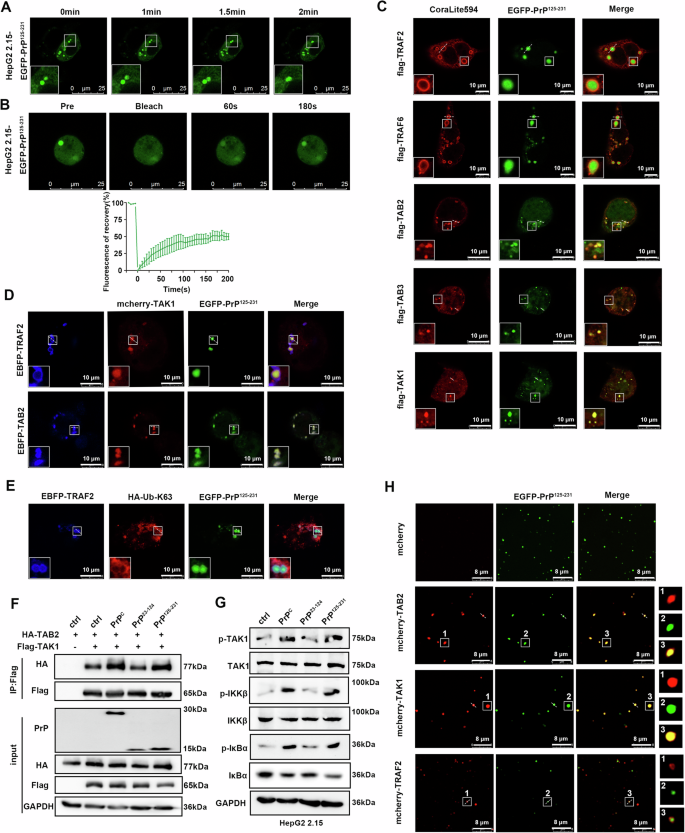
A Fusion analysis of EGFP-PrP125-231 condensates in HepG2 2.15 cells. B FRAP assay of EGFP-PrP125-231 condensates in HepG2 2.15 cells. The quantification of fluorescence intensity is shown below. C HepG2 2.15 cells were transfected with pHAGE-EGFP-PrP125-231 together with plasmids expressing Flag-TRAF2, Flag-TRAF6, Flag-TAB2, Flag-TAB3, or Flag-TAK1. Immunofluorescence staining for TRAF2, TRAF6, TAB2, TAB3, and TAK1 proteins. D HepG2 2.15 cells were transfected with pHAGE-EGFP-PrP125-231, pHAGE-mcherry-TAK1, pHAGE-EBFP-TRAF2, or pHAGE-EBFP-TAB2 plasmids to observe co-localization. E HepG2 2.15 cells were transfected with pHAGE-EGFP-PrP125-231, pHAGE-EBFP-TRAF2, and HA-Ub-K63 plasmids. After immunofluorescence staining of HA-Ub-K63, co-localization was observed. F HEK293T cells were transfected with plasmids expressing HA-TAB2, Flag-TAK1, PrPC, PrP23-124, PrP125-231, and corresponding empty plasmids and collected 36 h later. Whole-cell lysates were immunoprecipitated with anti-FLAG beads and analyzed by western blotting with corresponding antibodies. G HepG2 2.15 cells were transfected with plasmids expressing PrPC, PrP23-124, PrP125-231, or empty vector and collected 48 h later. Key signaling molecules of the NF-κB pathway in cells were analyzed. H Representative images showing the distribution of TAB2, TAK1, and TRAF2 in PrP125-231 droplets in vitro. All scale bars are indicated in the figures.
Next, we further explored the mechanism by which the C-terminal domain of PrPC activates NF-κB signaling molecules via LLPS. Immunofluorescence staining revealed that consistent with EGFP-PrPC, condensates formed by EGFP-PrP125-231 co-localized with TAB2, TAB3, and TAK1 in cells, which were encapsulated by TRAF2 and TRAF6 (Fig. 6C and Supplementary Fig. 7A). In addition, EGFP-PrP125-231, mcherry-TAK1, and EBFP-TRAF2 or EBFP-TAB2 co-localized in cells (Fig. 6D and Supplementary Fig. 7B). Furthermore, the K63-linked ubiquitin molecule and TRAF2 protein co-localized and encapsulated the EGFP-PrP125-231 condensates (Fig. 6E and Supplementary Fig. 7C). Co-immunoprecipitation assays also showed that the C-terminal domain PrP125-231, but not the N-terminal domain PrP23-124, played a major role in promoting the interaction between TAB2 and TAK1 (Fig. 6F). Similarly, overexpression of PrP125-231, but not PrP23-124, promoted phosphorylation of TAK1, IKKβ, and IκBα (Fig. 6G). Recombinant mcherry-TAB2, mcherry-TAK1, and mcherry-TRAF2 proteins also showed co-localization with EGFP-PrP125-231 proteins in vitro, with TRAF2 wrapping around the droplets (Fig. 6H and Supplementary Fig. 7D). These results suggest that the C-terminal of PrPC forms a condensate by LLPS and recruits TRAF2/6, TAB2/3, and TAK1 complexes to activate the NF-κB signaling pathway.
The α3 helix of PrPC is critical for its LLPS activity
Considering the important role of the PrPC α3 helix in NF-κB activation, we further truncated the C-terminal domain of PrPC (Fig. 7A). Remarkably, puncta were present in HepG2 2.15 cells stably expressing EGFP-PrP125-199 but not EGFP-PrP200-231 (Fig. 7B); however, the fluorescence was not restored after bleaching (Fig. 7C). Intriguingly, we also noted that upon addition of PEG8000, the EGFP-PrP125-199 protein solution became only slightly turbid and the EGFP-PrP200-231 protein solution remained clear in vitro, whereas the EGFP-PrP125-231 protein solution became cloudy (Fig. 7D left). Confocal microscopy further revealed that EGFP-PrP125-199 protein formed many irregular aggregates when EGFP-PrP125-231 protein generated circular droplets. At the same time, EGFP-PrP200-231 protein also formed similar aggregates, but their aggregation ability was much lower than that of EGFP-PrP125-199 (Fig. 7D right). In addition, we found that more and larger aggregates formed at higher protein concentrations, but no circular droplets were formed at any concentration (Fig. 7E). Interestingly, intrinsically disordered region prediction on human PrPC with the predictor of naturally disordered regions (PONDR) program revealed that segment 198-215 had a high tendency toward disorder (Supplementary Fig. 8). These results indicate that the α3 helix may be necessary for the phase separation of PrPC. Consistent with the results of dual-luciferase assays (Fig. 3G), both overexpression of PrP125-199 and PrP200-231 failed to activate the NF-κB pathway in that they did not enhance phosphorylation of TAK1, IKKβ, and IκBα (Fig. 7F), suggesting that phase separation of PrPC is essential for its activation of the NF-κB pathway. In summary, the α3 helix of PrPC appears to be critical for its LLPS activity to activate NF-κB signaling.
Fig. 7: PrP125-199 and PrP200-231 do not undergo LLPS.
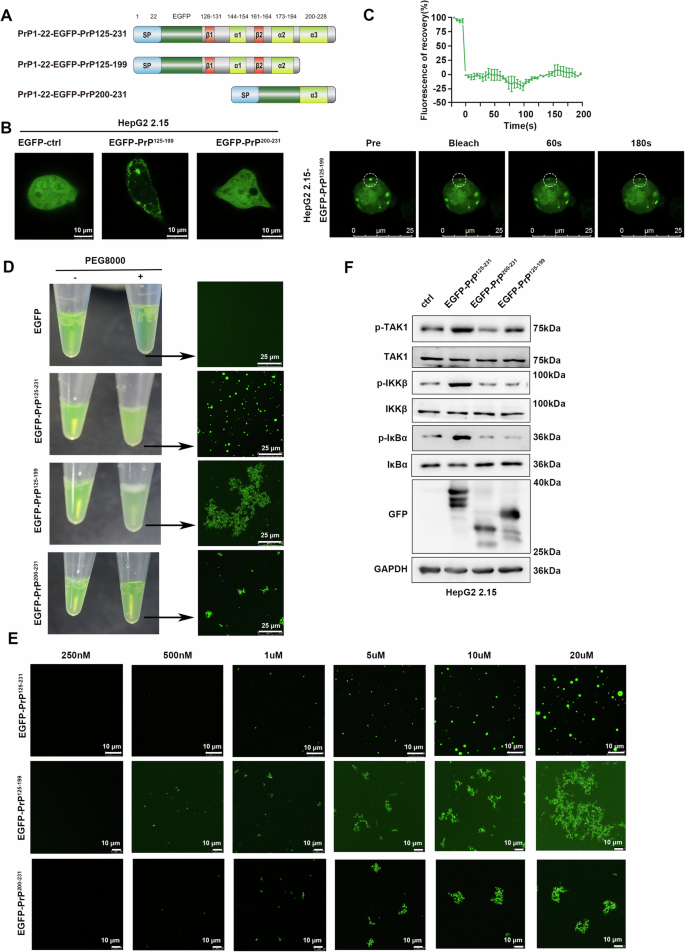
A Schematic diagram of EGFP-PrP125-231 truncation mutants. B Representative live-cell images of HepG2 2.15 cells stably expressing EGFP, EGFP-PrP125-199, and EGFP-PrP200-231. C FRAP assay of EGFP-PrP125-199 condensates in HepG2 2.15 cells. Quantification of fluorescence intensity is shown above. D Representative images showing the turbidity of 20 μM EGFP, EGFP-PrP125-231, EGFP-PrP125-199, and EGFP-PrP200-231 solution with or without 25% PEG8000. The indicated solution was observed under confocal microscopy. E The increasing concentration of EGFP-PrP125-199 and EGFP-PrP200-231 solution supplemented with 25% PEG8000 was observed under confocal microscopy. F HepG2 2.15 cells were transfected with EGFP-PrP125-231, EGFP-PrP125-199, EGFP-PrP200-231, or empty vector and collected 48 h later. Key signaling molecules of the NF-κB pathway in cells were analyzed. All scale bars are indicated in the figures.
The disulfide bond of PrPC is required for the LLPS of its C-terminal domain and its activation of the NF-κB signaling pathway
To further characterize key amino acids for PrP125-231 undergoing liquid-liquid phase separation, we conducted point mutations in the disordered sequence predicted by PONDOR. Different point mutation plasmids of PrP125-231 were constructed and transfected into HepG2 2.15 cells. The results revealed that only mutating Cys214 to Ala214 in PrP125-231 (PrP125-231-C214A) led to the loss of its ability to form condensates (Fig. 8A and Supplementary Fig. 9A). Notably, the Cys214 of PrPC forms a disulfide bond with the Cys179. So we hypothesized that the disulfide bond in PrPC is crucial for liquid-liquid phase separation. We next mutated Cys179 of PrP125-231 to Ala179 (PrP125-231-C179A) and found that it also loses its ability to form condensates (Fig. 8A). In addition, in vitro experiments also showed that phase separation disappears after mutation of Cys214 or Cys179 to Ala214 or Ala179 in PrP125-231, while mutations at other sites such as T199A and T201A did not affect phase separation (Fig. 8B and Supplementary Fig. 9B). We then investigated the interaction between PrP125-231-C214A and molecules of the NF-κB signaling pathway. Unexpectedly, CO-IP experiments showed that PrP125-231-C214A still interacted with TRAF2, TRAF6, TAB2, TAB3, and TAK1, whereas the interaction with TRAF2/TRAF6 was greatly attenuated (Fig. 8C and Supplementary Fig. 9C). So we performed immunofluorescence experiments to analyze the co-localization of PrP125-231-C214A with TRAF2, TRAF6, TAB2, TAB3, and TAK1 proteins. The results showed that PrP125-231-C214A had almost no co-localization with TRAF2/TRAF6, and had certain co-localization with TAB2, TAB3, and TAK1 proteins, but did not form condensates (Fig. 8D). The same results were observed in the PrP125-231-C179A mutant (Supplementary Fig. 9D). In addition, we also explored the effect of disulfide bond deletion mutants on the NF-κB signaling pathway. Western blot assays showed that both PrP125-231-C214A and PrP125-231-C179A lost the ability to activate the NF-κB pathway (Fig. 8E). Similarly, PrP125-231-C214A and PrP125-231-C179A mutants were unable to promote proliferation, migration and invasion of HepG2 2.15 cells (Fig. 8F, G). Taken together, these results suggest that the disulfide bond formation within PrPC is required for the liquid-liquid phase separation of its C-terminal domain and the activation of the NF-κB signaling pathway.
Fig. 8: The disulfide bond of PrPC is required for the LLPS of its C-terminal domain and its activation of the NF-κB signaling pathway.
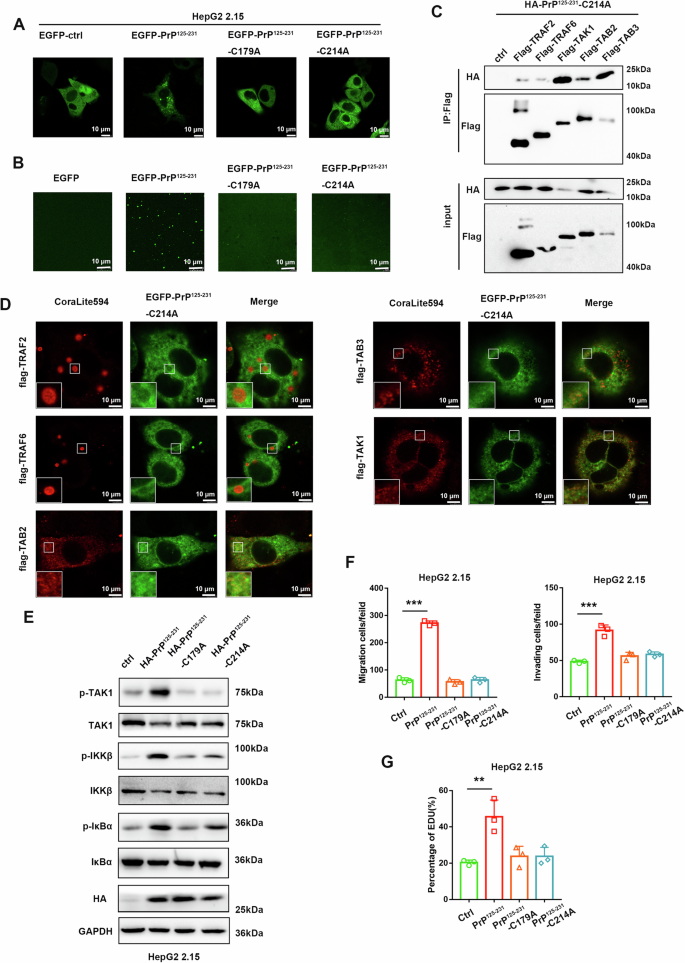
A Representative live-cell images of HepG2 2.15 cells transfected with plasmids expressing EGFP, EGFP-PrP125-231, EGFP-PrP125-231-C179A or EGFP-PrP125-231-C214A. B 20 μM EGFP, EGFP-PrP125-231, EGFP-PrP125-231-C179A or EGFP-PrP125-231-C214A solution supplemented with 25% PEG8000 were observed under confocal microscopy. C HEK293T cells were transiently transfected with plasmids expressing HA-PrP125-231–C214A proteins together with plasmids expressing Flag-TRAF2, Flag-TRAF6, Flag-TAK1, Flag-TAB2, Flag-TAB3, or Flag-empty vector, and cells were harvested 36 h later. Whole-cell lysates were subjected to immunoprecipitation with anti-Flag beads and analyzed by western blotting with the indicated antibodies. D HepG2 2.15 cells were transfected with pHAGE-EGFP-PrP125-231-C214A together with plasmids expressing Flag-TRAF2, Flag-TRAF6, Flag-TAB2, Flag-TAB3, or Flag-TAK1. Immunofluorescence staining for TRAF2, TRAF6, TAB2, TAB3, and TAK1 proteins. E HepG2 2.15 cells were transfected with pXJ40-HA, HA-PrP125-231, HA-PrP125-231-C179A, or HA-PrP125-231-C214A and collected 48 h later. Key signaling molecules of the NF-κB pathway in cells were analyzed. F Transwell experiments and G EdU assays were performed after the HepG2 2.15 cells were transfected with pXJ40-HA, HA-PrP125-231, HA-PrP125-231-C179A or HA-PrP125-231-C214A. All scale bars are indicated in the figures. Data are means ± SEM. Student’s t-tests were used to determine group differences. **p < 0.01; ***p < 0.001.
PrPC activates the NF-κB signaling pathway to promote tumor progression in vivo
Considering the effect of PrPC on the proliferation and metastasis of hepatoma cells through NF-κB signaling in vitro, we want to know whether PrPC promotes tumorigenesis in vivo. We used a PrPC knockout HepG2 2.15 cell line to construct subcutaneous xenograft tumor models (Fig. 9A). The results showed that PrPC knockdown HepG2 2.15 cells formed smaller tumors than HepG2 2.15-ctrl cells (Fig. 9B). By contrast, tumors in mice injected with HCCLM3-PrPC cells grew larger than those injected with HCCLM3-ctrl cells (Fig. 9D). Consistent with in vitro studies, more proliferative cells were observed in PrPC-overexpressing xenografts and fewer proliferative cells in PrPC knockdown xenografts as evidenced by Ki-67 staining (Fig. 9C, E). Additionally, in a lung metastasis model, there were significantly more tumor lesions in the livers of nude mice injected with Huh7-PrPC cells than in the livers of control mice (Fig. 9F). At the same time, overexpression of PrPC increased the metastatic burden in the lungs as evidenced by hematoxylin and eosin (H&E) staining (Fig. 9G). Western blot analysis of subcutaneous tumors formed from HCCLM3 and HepG2 2.15 cells indicated that tumors with high PrPC expression had significantly greater IκBa phosphorylation, higher c-myc, and cyclin D1 expression, and more obvious EMT characteristics (Fig. 9H). Taken together, these findings suggest that activation of the NF-κB pathway by PrPC promotes the proliferation and metastasis of hepatocellular carcinoma cells in vivo.
Fig. 9: PrPC promotes the proliferation and metastasis of HCC in vivo.
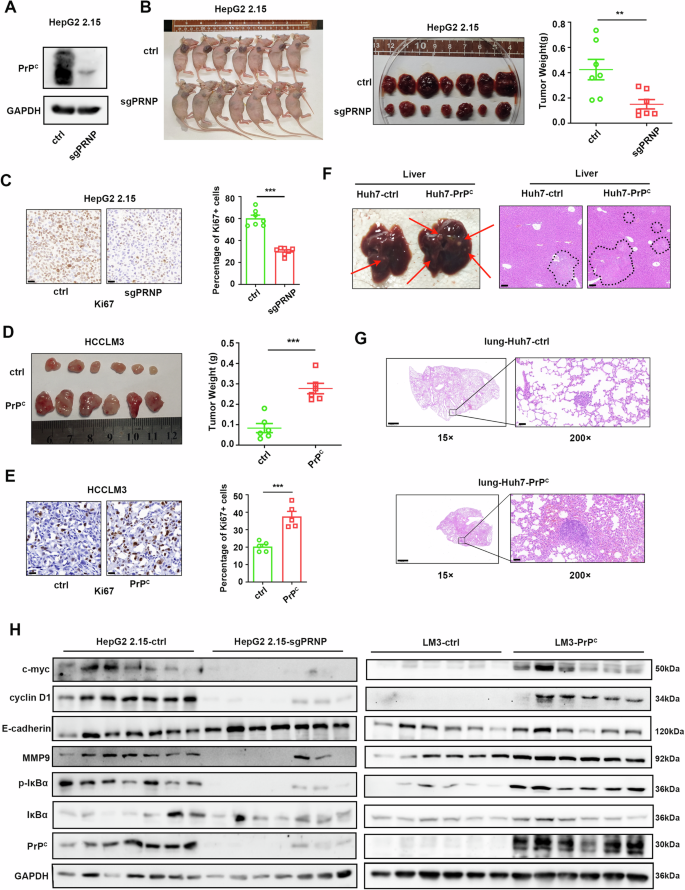
A Western blot validation of PrPC knockdown efficiency in HepG2 2.15 cells. B Tumor images of nude mice (left). Tumors were removed from the skin of nude mice that were injected subcutaneously with HepG2 2.15-ctrl or HepG2 2.15-sgPRNP cells (middle). Tumor weight (right). n = 7. C Representative images (left) and quantification (right) of Ki67 expression in tumors from PrPC knockdown and control groups. Scale bar, 20 μm. n = 7. D Tumors were removed from the skin of nude mice that were injected subcutaneously with LM3-ctrl or LM3-PrPC cells (left). Tumor weight (right). n = 6. E Representative images (left) and quantification (right) showing Ki67 expression in tumors in the PrPC overexpression and control groups. Magnification, 400×. Scale bar, 20 μm, n = 6. F Huh7-ctrl or Huh7-PrPC cells were injected into nude mice via the tail vein. Representative images of tumor growth in livers from the metastasis model (left). H&E staining of liver tissues (right). Tumor cells are circled. Scale bar, 100 μm. n = 6. G Representative H&E staining images showing lung metastases in the Huh7-ctrl and Huh7-PrPC groups. Scale bar for 15×, 1000 μm; scale bar for 200×, 100 μm, n = 6. H Immunoblotting assays were used to detect marker proteins of proliferation, migration, and NF-κB pathway activation in tumors formed by HepG2 2.15-ctrl, HepG2 2.15-sgPRNP cells (left), and LM3-ctrl, LM3-PrPC cells (right). Data are means ± SEM. Student’s _t_-tests were used to determine group differences. **p < 0.01; ***p < 0.001.
PrPC activates the NF-κB signaling pathway, which upregulates the expression of IL-8 and thereby promotes tumor progression
To investigate the mechanisms by which PrPC activation of the NF-κB pathway promotes tumor progression, we conducted RNA sequencing and generated a heat map associated with the NF-κB pathway (Supplementary Fig. 10A). Several top-ranked genes were selected and confirmed by quantitative real-time reverse-transcription polymerase chain reaction (qPCR) (Supplementary Fig. 10B). Notably, among these, only IL-8 (CXCL8) is a key downstream molecule that promotes hepatocarcinogenesis38,39. Additionally, qPCR revealed that the expression of IL-8 was specifically inhibited by SC-514 (Supplementary Fig. 10C). Furthermore, we investigated other common inflammatory factors downstream of the NF-κB pathway, including CXCL10, IL1β, IL6, and TNFα, and found that PrPC did not significantly impact their expression (Supplementary Fig. 10D). This is consistent with previous reports that only serum levels of IL-8 were significantly increased in chronic HBV-infected patients40,41. Collectively, these results suggest that IL-8 plays a critical role in mediating the hepatoma-promoting effects of PrPC.
Subsequently, we demonstrated that the ability of PrPC to enhance IL-8 expression and secretion in HepG2 2.15 cells could be neutralized by the inhibitors SC-514 and TPCA (Fig. 10A and Supplementary Fig. 10E). Importantly, PrPC-induced IL-8 expression and secretion were also reduced by the LLPS inhibitor 1,6-hexanediol (Fig. 10B). Consistent with our earlier results, PrPC mainly activated the NF-κB pathway through its C-terminal globular domain, which promoted IL-8 expression and secretion (Fig. 10C). Moreover, we observed a positive correlation between the transcription levels of IL-8 and PRNP in the TCGA-LIHC database (Fig. 10D). Similarly, qPCR analysis of tumor tissues from HCC patients demonstrated significant positive correlations between mRNA expression levels of PRNP and IL-8 (Supplementary Fig. 10F). Furthermore, the survival rate of patients with high expression of IL-8 was significantly lower than that of patients with low expression of IL-8 **(**Fig. 10E).
Fig. 10: PrPC promotes the expression of IL-8 by activating the NF-κB signaling pathway, thereby promoting tumor progression.
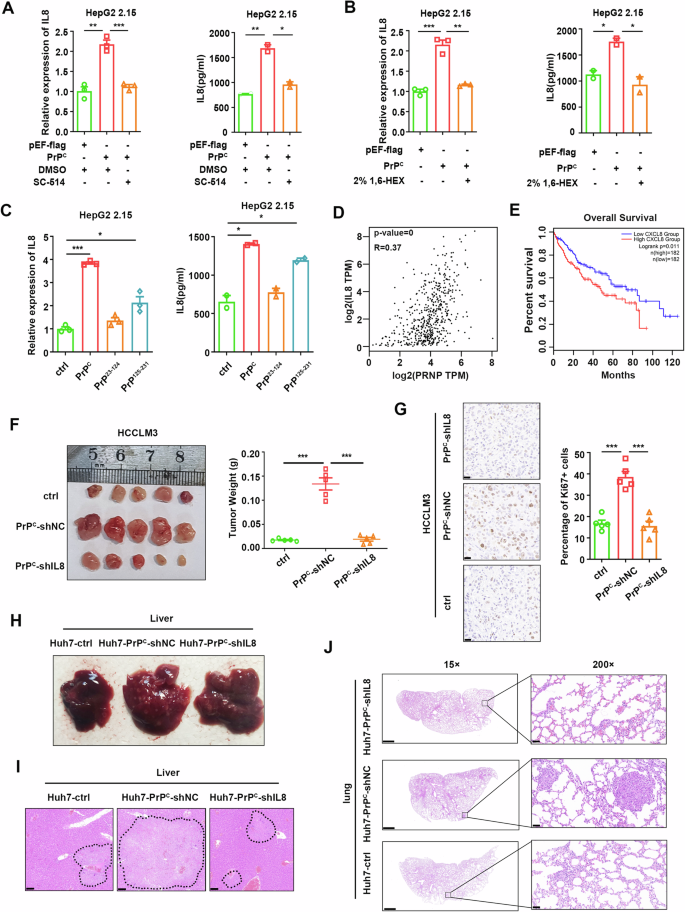
A qPCR and ELISA were performed to analyze the mRNA and protein levels of IL-8 in HepG2 2.15 cells transfected with plasmids expressing PrPC followed by treatment with the NF-κB inhibitor SC-514 24 h after transfection. Cell supernatant was collected for ELISA, and cells were collected for RNA extraction 48 h after transfection. B mRNA and protein levels of IL-8 in HepG2 2.15 cells transfected with plasmids expressing PrPC. 2% 1,6-hexanediol was added to the cell culture medium for 2 h before cells were collected. C mRNA and protein levels of IL-8 in HepG2 2.15 cells transfected with plasmids expressing PrPC and its truncated versions for 48 h. D Correlational analysis of PRNP and IL-8 levels in LIHC patients according to the TCGA database. E Overall survival rate of LIHC patients with high or low levels of IL-8 mRNA in liver cancer tissues from the TCGA database. F Tumors removed from the skin of nude mice were injected subcutaneously with LM3-ctrl, LM3-PrPC-shNC, or LM3-PrPC-shIL8 cells (left). Tumor weight (right). n = 5. G Representative images showing immunohistochemical staining of Ki-67 in tumors in the LM3-ctrl group, LM3-PrPC-shNC, and LM3-PrPC-shIL8 groups. Fraction of Ki67-positive cells in tumors (right). Magnification: 400×. Scale bar, 20 μm. n = 5. H Huh7-ctrl, Huh7-PrPC-shNC, and Huh7-PrPC-shIL8 cells were injected into nude mice via the tail vein. Representative images show tumor growth in the liver in the metastasis model. I H&E staining of liver tissues. Tumor cells are circled. Scale bar, 100 μm. n = 5. J Representative images showing H&E staining of lung tissues in the metastasis model. Scale bar for 15×, 1000 μm; scale bar for 200×, 100 μm. n = 5. Data are means ± SEM. Student’s t-tests were used to determine group differences. *p < 0.05; **p < 0.01; ***p < 0.001.
To investigate the role of PrPC in the promotion of HCC through IL-8, we employed shRNA to knock down IL-8. We observed a significant reduction in HCC cell proliferation and metastasis induced by PrPC (Supplementary Fig. 11A–E). Next, we further verified these results in animal experiments. In subcutaneous xenograft tumor models, mice injected with LM3-PrPC-shNC cells displayed significantly larger tumors than those injected with LM3-ctrl cells, which was suppressed upon IL-8 knockdown (Fig. 10F). Ki-67 staining revealed increased numbers of proliferative cells in PrPC-overexpressing xenografts. In contrast, the proportion of proliferative cells in tumors in the IL-8 knockdown group was similar to that of the control group (Fig. 10G). Additionally, an experimental lung metastasis assay was conducted by injecting 2 × 10⁶ HCC cells through the tail vein. We observed a higher incidence of tumor lesions in the livers of nude mice injected with Huh7-PrPC-shNC cells compared with Huh7-PrPC-shIL8 and control groups (Fig. 10H, I). Furthermore, the knockdown of IL-8 reversed the increased metastatic burden induced by PrPC overexpression, as evidenced by H&E staining (Fig. 10J). Taken together, these findings suggest that activation of the NF-κB pathway by PrPC leads to upregulation and secretion of IL-8, thereby promoting the proliferation and metastasis of hepatoma cells.
Discussion
The development of HCC is a complex multistep process involving ongoing inflammatory injury, including hepatocyte necrosis and regeneration, with fibrotic deposition4,33,42. The risk of HCC emerges at the time of cirrhosis formation and increases concomitantly with progressive liver function impairment. China has the highest burden of liver cancer in the world because of its large population and high incidence of liver cancer, and HBV infection is the main cause of primary liver cancer in China2. Although it has been reported that PrPC is closely associated with early recurrence and poor survival in patients with HCC43, the exact mechanism remains unclear. In this study, we observed that PrPC expression was upregulated in HCC, especially in HBV-positive HCC. Further studies showed that HBV could enhance PrPC expression via HBx protein in a dose-dependent manner. Highly expressed PrPC activated the NF-κB pathway by undergoing LLPS to induce IL-8 expression, thereby promoting the proliferation and metastasis of hepatocellular carcinoma cells.
PrPC has been found to be highly expressed in a variety of cancers11,13,44, which involved activating different signal pathways to induce tumorigenesis via interaction with different ligands27,36. For instance, PrPC can activate the PI3K-AKT pathway to accelerate the progression of gastric cancer45,46 and enhance the proliferation and invasion of pancreatic cancer by promoting Notch activation47. PrPC can contribute to the spread of lung cancer cells to other organs through the vascular circulatory system by activating the c-Jun N-terminal kinase (JNK) signaling pathway48. And PrPC can accelerate colorectal cancer metastasis via the Fyn-SP1-SATB1 axis49. Additionally, PrPC is found to be required for TNFα-triggered NF-κB signaling in a human melanoma cell line, M2, and a pancreatic ductal cell adenocarcinoma cell line, BxPC-350. Mechanically, PrPC traps the deubiquitinase tumor suppressor cylindromatosis (CYLD), preventing it from binding and deubiquitinating RIP1 and TRAF2 in M2 and BxPC-3 cells50. Recently, a review summarized that PrPC has a high binding affinity for 37/67 kDa laminin receptor (RPSA), a molecule that acts as a key player in tumorigenesis, to affect the cell growth, adhesion, migration, invasion, and cell death processes of cancer cells51. However, PrPC does not contain a kinase-active structure. It is puzzling how the highly expressed PrPC in different cells activates various signaling pathways. Here, we searched for possible mechanisms employed by PrPC in HCC and revealed that activation of the NF-κB pathway is also critical for its HCC-promoting effect. Further results showed that HBx can upregulate PrPC expression by binding CREB1 in HCC. Highly expressed PrPC can undergo LLPS and then recruit TRAF2/6, TAB2/3, and TAK1 complexes for reaction to accelerate the activation of the NF-κB pathway. Importantly, in liver cancer tissues from HCC patients, PrPC condensates co-localization with TRAF2, TAB2, and TAK1. As in M2 and BxPC-3 cells, PrPC acts as a scaffold protein to trap CYLD and then activates the NF-κB pathway. PrPC is also able to interact with RPSA to exert a wide range of pro-oncogenic functions. We speculate that PrPC may also function through LLPS in these cells, and LLPS may be a common mechanism by which PrPC exerts its scaffold role.
The NF-κB signaling pathway activates downstream immune and inflammatory responses. In our system, PrPC-activated NF-κB specifically upregulated the expression of IL-8 (CXCL8) without affecting the expression of other cytokines such as IL6, IL1β, and TNF-α. IL-8 is a chemokine that is widely involved in tumor proliferation, invasion, and migration in an autocrine or paracrine manner38,39,40,41,52,53. Interestingly, Pengyuan Yang et al. reported that HBx induced high IL-8 production through MEK–ERK signal activation, leading to enhanced endothelial permeability to facilitate tumor vascular invasion39. However, our study reveals that PrPC acts as an upstream molecule to activate the NF-κB pathway in an LLPS-dependent manner, thus specifically enhancing IL-8 expression and accelerating tumor development.
LLPS is broadly involved in intracellular signaling processes across time and space. Zhou et al. found that accumulated glycogen undergoes LLPS to block Hippo signaling, thereby increasing tumorigenesis25. Jiang et al. revealed that phase separation of endoplasmic reticulum-associated STING separates STING-TBK1 from IRF3 and prevents innate immune overactivation22. Interestingly, Cui et al. report that SARS-CoV-2 nucleocapsid protein undergoes LLPS to recruit TAK1 and IKK complexes, thus enhancing NF-κB activation54. Chen et al. also showed that the NF-κB pathway downstream molecule NEMO undergoes LLPS with the involvement of ubiquitin chains20. However, no study has shown whether molecules upstream of the NF-κB pathway can undergo LLPS. The results of our present study suggest that upregulated PrPC forms a biomolecular condensate capable of acting as a membrane-less organelle that provides a compartment for the reaction of upstream molecules of the NF-κB pathway. There, TRAF2/6 brings ubiquitin chains that activate TAB2/3, which in turn phosphorylates TAK1. Phosphorylated TAK1 can be released from the compartment to participate in downstream events. Our study elucidates for the first time the mechanism by which molecules upstream of NF-κB are activated by the occurrence of LLPS. However, the exchange of substances and information between biomolecular condensates still needs further research.
PrPC possesses two major potential sites for LLPS: the presence of an intrinsically disordered region at the N-terminal and a multivalent bound globular domain at the C-terminal5,28,55. The N-terminal domain (residues 23-110) of PrPC undergoes LLPS in vitro, which cannot be achieved without residues 90-110 30. Another study revealed that the C-terminal domain (residues 90-230) of PrPC is capable of phase separation and predicts that C-terminal regions (residues 194-231) are mostly disordered, which may be required for LLPS31. Strittmatter et al. found that helix-α2 and -α3 Thr residues become unstructured in the PrPC liquid phase32. Our work demonstrates for the first time that PrPC is capable of LLPS in human cells, and the C-terminal domain of PrPC is required for its enhancement of the NF-κB pathway. Although the C-terminal domain of PrPC underwent LLPS both in vitro and in vivo, it failed to undergo LLPS without the α3 helix, a key region for multivalent binding of PrPC to upstream proteins in the NF-κB pathway and instead formed irregular aggregates. Notably, although Strittmatter et al. show that helix-α2 and -α3 Thr residues become unstructured in the PrPC liquid phase in vitro, they did not identify the importance of helix-α2 and -α3 in LLPS32. Our results provide the first in vitro and intracellular evidence that the α3 helix is indispensable for the LLPS of the C-terminal domain of PrPC. Interestingly, the α3 helix alone also formed aggregates rather than liquid-like droplets in vitro, suggesting that an intact C-terminal globular domain is essential for the occurrence of LLPS. Importantly, we also found that disulfide bond formation in the globular domain of PrPC was necessary for it to undergo liquid-liquid phase separation. It is known that the disulfide bond of PrPC plays a crucial role in maintaining its structural stability6. These results further confirmed that the stabilization of the globular domain was essential for the liquid-liquid phase separation of PrPC.
An increasing number of studies have shown that many of the dysregulated cellular processes in cancer occur in biomolecular condensates. This has prompted researchers to explore how oncogenic alterations affect condensate biology and lead to malignant states. Dysregulated signaling is one of the distinguishing features of tumor cells, and numerous studies have shown that liquid-liquid phase separation can be extensively involved in signaling processes in tumor cells. For example, Zhou et al. found that cancer-initiating cells adapted to the glycogen storage mode and blocked Hippo signaling through glycogen phase separation, thereby increasing tumor incidence25. Groves et al. found that Son of Sevenless (SOS) is regulated by molecular assembly phase transitions and kinetics proofreading, which mediates activation of Ras56. Zhang et al. found that phase separation of PKA regulatory subunits controlled the cAMP compartment and oncogenic signaling57. Another study also revealed that TGF-β-induced DACT1 biomolecular condensate inhibited Wnt signaling and promoted bone metastasis of cancer cells58. Overall, the role of biomolecular condensates in tumor cell signaling and other cell biology provides new therapeutic hypotheses for cancer treatment, which may benefit cancer patients.
Methods
Chemicals and reagents
DMEM (#11995040), fetal bovine serum (FBS; #10100147), lipofectamine 2000 (#11668019), and trypsin were purchased from Thermo Fisher Scientific. DMSO (#D8371) was obtained from Solarbio. PD98059 (#167869-21-8), MK2206 (#1032350-13-2), SC-514 (#354812-17-2), SP600125 (#129-56-6), rapamycin (#53123-88-9), XAV-939 (#284028-89-3), TPCA (#507475-17-4), G418 (#108321-42-2), and tetracycline (#60-54-8) were purchased from TopScience. 1,6-hexanediol (#C12288832) and PEG8000 (#C10378437) were obtained from MACKLIN. Flag-beads (#20565ES08) were obtained from YEASEN. Ni-NTA agarose (#30230) was purchased from Qiagen.
Plasmid construction
Detailed steps for constructing the plasmids are described in Supplementary Table 1. The vectors, restriction enzymes, and PCR primers used in the plasmid construction process are also listed in Supplementary Table 1. The primers used for site-directed mutagenesis cloning are listed in Supplementary Table S6.
Animal models
Nude mice were purchased from Hunan SJA Laboratory Animal Co., Ltd. All animal experiments were approved by the Ethics Committee of Wuhan University (150013, Wuhan, China) and performed according to the Guide for the Care and Use of Medical Laboratory Animals (Ministry of Health, People’s Republic of China, 1998). LM3-ctrl, LM3-PrPC, LM3-PrPC-shIL8, HepG2 2.15-ctrl, and HepG2 2.15-sgPRNP cell lines were generated by the corresponding lentivirus. For subcutaneous tumor formation experiments, 5 × 10⁶ tumor cells in 50 µL PBS were randomly injected into the armpit of 4-week-old mice. Tumor size was measured weekly. Four weeks after injection, mice were sacrificed by asphyxiation, and their tumors were measured, weighed, and photographed. Tumor volume was calculated as follows: V = 0.5 × length × width2. For the lung metastasis model, 2 × 10⁶ tumor cells in 200 µL PBS were randomly injected into mice via the caudal vein. Mice were weighed weekly. Eight weeks after injection, mice were sacrificed by asphyxiation, and their livers and lungs were photographed and subjected to H&E staining.
Human tissues specimens
Clinical samples were collected at Hubei Cancer Hospital with written informed consent from all human participants as approved by the Research Ethics Committee of the Institute of Wuhan University.
Mammalian cell culture
The human HCC cell lines Hep-G2 (RRID: CVCL 0027) and Huh-7 (RRID: CVCL 0336) were purchased from the Cell Bank of the Chinese Academy of Sciences (Shanghai, China). The cell lines HepG2 2.15, HCCLM3, and 293T were gifted by Dr. Deyin Guo from the School of Basic Medical Sciences, Wuhan University. Huh7, HepG2, HepG2 2.15, HCCLM3, and 293T cells were cultured in DMEM (Gibco, USA) containing 10% FBS (Gibco, USA), 100 U/mL penicillin (Biosharp, China), and 100 U/mL streptomycin (Biosharp, China). The medium for HepG2 2.15 cells also included 400 μg/mL G418. HepAD38 and HepG2-NTCP cells were cultured in the same medium but with the culture dishes coated with 50 μg/mL type 1 collagen. All cells were cultured at 37 °C with 5% CO2 in an incubator.
Escherichia coli strains
BL21 E. coli strains were grown at 37 °C under 220 rpm in LB media. For expression of recombinant proteins, they were transformed with expression plasmids, propagated at 37 °C in 2× YT media, and induced with 0.1 mM IPTG at 16 °C.
DNA transfection
HepG2 2.15, HepAD38, HepG2, HepG2-NTCP, Huh7, and HCCLM3 cells at a confluency of 60% in a 12-well plate were transfected with plasmids using Lipofectamine 2000 transfection reagent according to manufacturer’s manual.
Cell proliferation
After transfection, cells were seeded in 96-well plates (5 × 10³ cells/well) for further culturing and analyzed 0, 24, 48, and 72 h later. Before analysis, 10 μL CCK-8 reagent (TargetMol, China) was added to each well and incubated for 1 h. The absorbance at 450 nm was measured with a microplate reader (Bio-Rad, USA). A minimum of five wells were used for each group, and average absorbance was used to assess cell proliferation.
EdU staining assay
EdU (KeyGEN BioTECH, China) reagent was added to the cell culture medium for a final concentration of 20 μM and incubated with cells for 2 h at 37 °C. Cells were then fixed with 4% paraformaldehyde (Biosharp, USA) at room temperature for 30 min, washed with PBS three times, and treated with 0.5% Triton X-100 (Sigma, Germany) at room temperature for 20 min. Next, the reaction buffer was mixed with Kflour488-azide (KeyGEN BioTECH, China) and incubated with the cells at room temperature for 30 min without light. Finally, cells were washed with PBS three times and incubated with Hoechst33342 solution (KeyGEN BioTECH, China) at room temperature for 30 min without light. The numbers of EdU- and Hoechst-positive cells were counted in random blocks, and the percentage of EdU-positive cells was calculated using the following formula: EdU-positive rate=EdU-positive cell count/(Hoechst-positive cell count)×100%.
Colony formation assay
Twenty-four hours after transfection, Huh7 and HepG2 cells (200 cells/well) and HepG2 2.15 cells (600 cells/well) were inoculated into 6-well culture plates and cultured for 7 days. Cells were then fixed with 4% paraformaldehyde for 15 min and stained with 0.1% (w/v) crystal violet for 30 min. After washing with PBS, the number of colonies was counted.
Cell migration and invasion assays
A transwell chamber (0.8-μm 24-well plate, Corning, USA) was used to assess cell migration and invasion. In cell migration assays, cells (1 × 10⁴) were placed in the transwell chamber with FBS-free DMEM, and DMEM containing 20% FBS was added to the well plate. After 36 h, cells were fixed with 4% paraformaldehyde and stained with 0.1% crystal violet solution. Cells were then observed under a microscope, and six randomly selected fields were counted to measure cell migration. In the cell invasion experiments, matrix gel (Corning) was added to the transwell chamber and incubated for 1 h before cell seeding. The remaining steps were the same as those performed for the cell migration assay.
Lentivirus packaging and infection
For the construction of stably overexpressing cell lines, the gene to be overexpressed was first cloned into pHAGE-CMV-MCS-PGK vector and then transfected into 293T cells with psPAX2 and pMD2.G plasmids at a ratio of 4:3:1. Seventy-two hours after transfection, the supernatant was collected and centrifuged at 3000 rpm for 10 min to remove cell debris. Finally, lentiviruses were filtered with 0.45-μM filters. To construct knockout or knockdown cell lines, the corresponding sgRNA was cloned into the lentiCRISPR V2 vector, or the corresponding shRNA was cloned into the pLKO.1 vector. The shRNA and sgRNA sequences are listed in Supplementary Tables 2 and 3. The remaining steps were the same as described above. The resulting lentivirus supplemented with 8 µg/mL polybrene was co-incubated with cells for 24 h, and a fresh medium was added. After 48 h, stably transfected cell lines were selected with 2 µg/mL puromycin. Overexpression and knockout or knockdown were confirmed by qPCR and western blot analyses.
RNA extraction and qPCR
Total RNA was extracted from cells with TRIzol reagent (Invitrogen, Life Technologies, USA). Nanodrop2000 (Thermo Fisher Scientific) was used to determine the concentration and quality of RNA. Equal amounts of mRNA from different samples were transcribed into cDNA using a PrimeScript RT reagent kit (Takara, Japan). Fluorescence qPCR was performed using SYBR Green Master Mix (Yeasen, China). The primers used are shown in Supplementary Table 1. Gene expression levels were calculated using 2−ΔΔCT. The qPCR primers used are listed in Supplementary Table 4.
Western blot
Total protein was extracted from cells and tumor tissues with RIPA lysis buffer, and protein concentration was determined with an enhanced BCA protein assay kit (Beyotime, China). Next, 10% SDS PAGE gel was used to separate total proteins (20 μg), and proteins were transferred to a nitrocellulose membrane (Millipore, USA). After being blocked with 5% milk at room temperature for 1 h, the membrane was incubated with primary antibody at 4 °C overnight. The next day, the membrane was washed with Tris-buffered saline/Tween (TBST) solution three times and incubated with horseradish peroxidase-conjugated secondary antibodies at room temperature for 1 h. After washing with TBST three times, immunoreactive bands on the membrane were observed using the enhanced chemiluminescence method. The antibodies used are listed in Supplementary Table 5.
Native polyacrylamide gel electrophoresis (PAGE)
Native PAGE was performed to analyze the quaternary structure of our protein of interest under non-denaturing conditions. Briefly, 30 μg of purified protein was mixed with native loading buffer without reducing agents and loaded onto a 4–12% gradient acrylamide gel. Electrophoresis was conducted at 150 V for approximately 90 min in a cold chamber using a running buffer containing 50 mM Tris-HCl, 384 mM glycine, and 1 mM EDTA at pH 8.3. After the Electrophoresis, the subsequent steps were similar to that of western blot experiments.
Dual-luciferase reporter assay
293 T cells (2 × 10⁵) were seeded into 24-well plates and transfected with 100 ng NF-κB-luciferase reporter plasmid (firefly luciferase), pRL-TK plasmid (10 ng, renilla luciferase) and corresponding plasmids expressing MyD88, TRAF2, TRAF6, TAK1, TAB1, TAB2, TAB3, IKKβ, p65, PrPC, and truncated mutants after cell confluence reached 70–80%, with three replicates per group. Twenty-four hours after transfection, the supernatant was replaced with fresh medium with or without SeV (MOI = 10) to activate the NF-κB signaling pathway. Cells were collected 36 h after transfection and subjected to luciferase activity assay using the Dual-Glo system (Promega, WI).
Nuclear localization analysis
HepG2 2.15 cells were placed in six-well plates. Forty-eight hours after transfection, the culture medium was removed, and cells were washed with PBS three times. Cytoplasmic and nuclear proteins were isolated using a separation kit (Applygen, China) and analyzed using western blot.
Immunofluorescence staining
Cells were fixed with 4% paraformaldehyde at room temperature for 20 min and then permeabilized with 0.2% Triton X-100 at room temperature for 15 min. Samples were blocked at room temperature for 30 min with 3% bovine serum albumin (diluted in PBS), washed with PBS three times for 5 min each, and incubated with primary antibody (diluted in 3% bovine serum albumin) at 4 °C overnight. After washing with PBS three times, samples were incubated with diluted corallite 594- or FITC-conjugated secondary antibody at room temperature for 2 h. Finally, cells were washed three times with PBS and immediately observed under a confocal microscope or temporarily stored in a refrigerator at 4 °C.
FRAP analysis
FRAP analysis for in vitro or cellular biomolecular condensates was conducted at room temperature using the FRAP module of the Leica SP8 confocal microscopy system. The droplets for bleaching were identified under a 63× oil lens, the circular region of interest was bleached using 100% laser power, and time-lapse images were collected. Leica AS Lite software was used to analyze the fluorescence intensity of the images.
1,6-hexanediol treatment
For fluorescence imaging, 72 h after transfection, 2% 1,6-hexanediol was added to the medium, and time-lapse photographs were taken under a 63× oil lens using the Leica SP8 confocal microscopy system. For dual-luciferase reporter assay, 2% 1,6-hexanediol was added to the medium 1 h before sample collection.
Protein expression and purification
The cDNA encoding EGFP-PrPC, EGFP-PrP125-231, mcherry-TAK1, mcherry-TAB2, and mcherry-TRAF2 proteins were cloned into pET30a vector. The expression vectors were transformed into E. coli BL21 (DE3) cells, which were then grown to OD600 0.6–0.8 at 37 °C in 1 L LB medium containing 50 µg/mL kanamycin. Next, 0.1 mM IPTG was added to the medium, and cells were induced to express the protein for 20 h at 4 °C. EGFP-PrPC and EGFP-PrP125-231 proteins were expressed as soluble proteins and inclusion bodies in BL21 cells, whereas mcherry-TAK1, mcherry-TAB2, and mcherry-TRAF2 were mainly expressed as inclusion bodies. For soluble proteins, after cells were collected by centrifugation, a binding buffer (20 mmol/L Na3PO4, 500 mmol/L NaCl, pH=7.8) was used to resuspend the bacteria. After high-pressure crushing, the supernatant was collected by centrifugation at 25,000 g for 45 min. The supernatant was incubated with Ni-NTA agarose beads (Qiagen) for 2 h at room temperature and washed with washing buffer solution (20 mmol/L Na3PO4, 500 mmol/L NaCl, 30 mmol/L imidazole, pH=6.0). Finally, proteins were eluted with an elution buffer (20 mmol/L Na3PO4, 500 mmol/L NaCl, 150 mmol/L imidazole, pH = 6.0). To isolate proteins from inclusion bodies, bacteria were resuspended with buffer A and crushed under high-pressure. The inclusion bodies were collected after centrifugation and washed three times with 30 mL buffer B containing 150 μL Triton X-100, 3.51 g NaCl, and 3.6 g urea. The washed precipitate was incubated with buffer C overnight at 4 °C to completely dissolve the inclusion body protein, and the dissolved protein was filtered with a 0.2-μm membrane and incubated with Ni-NTA agarose beads (Qiagen) at room temperature for 2 h. Next, buffer C was replaced by buffer D gradient so that the denatured inclusion body protein slowly renatured on the Ni-NTA agarose beads. Finally, the regenerated protein was eluted with an elution buffer. Buffer A consisted of 20 mmol/L Tris-HCl, 150 mmol/L NaCl, 2 mmol/L EDTA, 100 μg/mL lysozyme, 10 μg/mL DNase, 0.1% Triton X-100, 2 mmol/L PMSF, pH = 7.4; buffer B consisted of 20 mmol/L Tris-HCl, 150 mmol/L NaCl, pH = 7.4); buffer C consisted of 10 mmol/L Tris-HCL, 100 mmol/L Na2HPO4, 8 mol/L urea, 0.5% Triton X-100, 10 mmol/Lβ-mercaptoethanol, pH = 8.0; buffer D consisted of 10 mmol/L Tris-HCl, 100 mmol/L Na2HPO4, pH = 8.0); and elution buffer consisted of 20 mmol/L Na3PO4, 500 mmol/L NaCl, 150 mmol/L imidazole, pH = 6.0.
In vitro LLPS assay
Purified proteins were centrifuged at room temperature at 15,000 rpm for 10 min to remove any aggregates and then mixed to the specified concentration at room temperature, after which 2% PEG8000 was added to simulate the cytoplasmic environment and induce LLPS. The mixed solution (10 µL) was pipetted onto the glass slide and left for 1 h at room temperature after the coverslip was added. Slides were observed under a 63× oil lens using a Leica microscope. Leica AS Lite software was used to analyze the fluorescence intensity.
H&E staining and immunohistochemistry
For H&E and immunohistochemical staining, tissue samples were fixed with 10% formalin, embedded 24 h later to obtain paraffin blocks, and cut into 4-mm-thick tissue sections using a Leica slicing machine. Subsequently, tissue sections were dewaxed, rehydrated, hematoxylin-stained for 3–5 min, and eosin-stained for 5 min. Finally, slices were dehydrated and covered with neutral gum. For immunohistochemistry, the antibody was diluted at a ratio of 1:100 to detect the Ki67 protein. 3DHISTECH Case Viewer was used to scan slices for high-resolution images.
ChIP assay
ChIP assay was performed on Huh7 cells co-transfected with HA-HBx and Flag-CREB1. In brief, cells were fixed with 1% formaldehyde and then lysed. The chromatin was sheared with an ultrasonic cell disruptor. The protein-DNA complexes were precipitated with IgG or anti-FLAG M2 agarose beads (Sigma-Aldrich) and then the protein-DNA cross-links were reversed and DNA was purified. The PRNP promoter region containing the CREB1 binding site was amplified from immunoprecipitated DNA samples using specific primers.
RNA sequencing
PCR products corresponding to 200–500 bps were enriched, quantified, and sequenced by a Hiseq6000 sequencing apparatus (Illumina) and mapped onto the reference genome of Homo sapiens (Homo sapiens. GRCh38; ftp://ftp.ensembl.org/pub/release87/fasta/homo_sapiens/dna/) with default parameters using STRA software version 2.5.3 (a). Reads in the exon region of each gene were counted using the Counts feature (Subread-1.5.1; Bioconductor), and reads per kilobase of exon per million reads mapped were calculated. Differentially expressed genes between groups were identified using the edge R package (version 3.12.1). A false discovery rate-corrected p-value truncation value of 0.05 and fold-change truncation value of 2 were used to determine statistical significance.
Statistical analysis
All values are expressed as mean ± standard deviation (SD). Student’s _t_-tests were used to determine group differences. Survival curves were plotted according to the Kaplan–Meier method and compared using the log-rank test. A _p_-value < 0.05 was considered statistically significant. Experiments were repeated three times when possible. Data analysis was performed using GraphPad Prism 9.
Reporting summary
Further information on research design is available in the Nature Research Reporting Summary linked to this article.